


Introduction
In the semi-arid Norte Chico region of Chile (27–33˚S), the evolution of the cryosphere is of concern for local populations because of its role in local water resources. Although the region contains peaks in excess of 6000m a.s.l., low precipitation and strong ablation, a large portion of which can be sublimation Reference Garín(Ginot and others, 2002), mean that glaciers are limited in both number and extent (total ice coverage in Norte Chico administrative regions of 73.85 km2 (Reference Favier, Falvey, Rabatel, Praderio and LόpezGarín, 1987; Reference Müller, Caflisch and MüllerRivera and others, 2000)). Despite the limited glacier extent, glacial meltwaters, when combined with snowmelt, are an important component of the hydrological resources Reference Escobar and Aceituno(Favier and others, 2009) providing water that is vital for the regional economy.
The mountain climate is characterized by persistent low temperatures and humidity levels and generally clear skies. Meteorological conditions measured over 7 years at the Pascua-Lama mine exploration site (29˚ S, 70˚ W, ~5000m a.s.l.) show that monthly mean temperature remains negative year-round, monthly mean relative humidity is 34–54%, precipitation is concentrated in the winter season between May and August, and monthly mean wind speed remains above 4ms–1. Synoptic-scale winds are predominantly westerly but are deflected southward along the Andean range Reference Garín(Kalthoff and others, 2002). Prevailing wind direction at the Pascua-Lama meteorological stations is from the northwest to north-northwest.
The glaciers of northern Chile (18–32˚ S), including Norte Chico, were inventoried using aerial photographs from 1955 and 1961 (Garín, 1987). The report for this inventory highlights that in northern Chile: (1) it is not usually possible to separate permanent accumulations of snow from ice because glaciers show few surface signs of flow; (2) permanent snowpatches were likely to be a significant hydrological resource; (3) the glacial group at Los Tronquitos (28˚32' S) is the most significant concentration of ice in northern Chile; (4) clearly defined moraine forms were absent; and (5) rock-glacier features present in Norte Chico were difficult to identify as some did not show surface flow features. Reference Rau, Mauz, Vogt, Khalsa and RaupRivera and others (2000) noted that as this inventory was not well associated with watersheds, more detailed work was required to make better hydrological assessments.
This paper presents the findings of a new inventory of the upper Huasco valley (Fig. 1) based on Advanced Spaceborne Thermal Emission and Reflection Radiometer (ASTER) images from 2004, presents an assessment of glacier type and glacier evolution in this watershed, and compares the results with those from a similar study in the upper Aconcagua valley (33˚ S), central Chile Reference Bown, Rivera and Acuña(Bown and others, 2008).
Location of the Huasco valley showing the El Transito and El Carmen sub-catchments. ASTER images used for glacier delineation are indicated in grey.

Methods
Images and image treatment
All the materials used in this study are presented in Table 1. The inventory work was carried out using ASTER images from 2004 (Fig. 1), but the orthorectification process used images from 2002 and 2003 as well. A 15 m digital terrain model (DTM) was generated from the ASTER images using the ASTER DTM module for ENVI. The same module was used to orthorectify the images using an additional vectorial input of the 1 : 50 000 scale drainage network produced from the cartography of the Instituto Geográfico Militar (IGM). The rectified images were mosaicked and colour balanced using ENVI software. The catchment boundaries were determined from the 1:50 000 contours (IGM). Near the Argentine border, there is some discrepancy between the catchment boundaries determined this way and the ridgelines evident in the rectified ASTER mosaic. The DTM is expected to have a maximum of 10% difference to reality, and horizontal and vertical accuracy of 30 and 15 m, respectively (Reference RiveraToutin, 2008). Additional differences may be introduced because: (1) the ASTER images in this zone were not rectified with the use of further ASTER images to the east; (2) the drainage network vector used to optimize the rectification process covers the Chilean territory only, so does not cover all of the easternmost ASTER images; and (3) the catchment boundary follows the ridgeline and the rectification procedure is less accurate in high-relief areas. In places, the eastern catchment boundary was corrected manually to ensure glaciers draining to Chile are included in the inventory. Aerial photographs taken between 1996 and 1999 were used as a reference for feature identification rather than delimitation and also as a means of determining the non-transience of features to be included in the inventory.
Images and spatial data used in the study

Glacier delimitation
Snow and ice features identified in both the aerial photographs from the late 1990s and the 2004 ASTER images were considered as perennial and were included in the inventory, although some of these bodies are of very small surface area and it is not clear from the images whether they would be classified as névés, glacierets or glaciers. The term ‘glacieret’ defines an ice body that is formed primarily by blowing or avalanching snow, which usually shows no surface signs of flow (Reference MarangunicMüller and others, 1977; Reference Masiokas, Rivera, Espizua and VillalbaRau and others, 2005). Additionally, this inventory includes rock glaciers due to their prevalence in the basin and consequent role in hydrological resources.
Snow and ice feature limits were mapped manually from ASTER images taken on 14 February 2004, which is late summer and so should present the most snow-free conditions. Where transient snowpatches were identified to be merging with permanent snow and ice features, the transient portion was excluded from the inventoried area.
Only rock glaciers deemed to be active were included in the inventory, as inactive rock glaciers may in fact no longer contain ice and thus would not form part of the hydrological resource of the catchment. Rock glaciers were determined to be active if they showed: (1) a colour contrast between the frontal slope and upper surface, as this was considered to be indicative of ongoing frontal activity; and (2) evidence of surface flow features. There are numerous fossil rock-glacier features and valley fill deposits that may still contain some quantity of ice, but as this is unknown such features were not included in the inventory. Upper limits of rock glaciers were taken to be the break of slope above the highest surface flow features.
Database
The characteristics of mapped glaciers were entered into a database to include the data requirements of both the Chilean Direcciόn General de Aguas (DGA), which is based on the World Glacier Inventory (WGI) database, and also the Global Land Ice Measurements from Space (GLIMS) database. Thus two identities were generated for each glacier mapped, a UNESCO (WGI) name, based on country and catchment, and a GLIMS ID, based on latitude and longitude. Glaciers were classified using both the UNESCO/ WGI and expanded GLIMS system. The glaciers in this region do not have classical altitude-delimited accumulation and ablation areas, and instead wind patterns determine the spatial distribution of accumulation. Additionally, the whole surface can be an accumulation or ablation zone depending on the interannual climate variation (A. Rabatel and others, unpublished information), so the field referring to dimensions of the zonation of the glacier surface was filled with ‘not applicable’. Similarly, it was not possible to identify snowlines. The WGI database requests mean glacier width and length, but as the ice bodies mapped in the upper Huasco valley are small, and do not generally have a ‘tongue’ form the width of which can be measured, or multiple tributary flowlines, these fields were filled with maximum glacier dimensions instead. Maximum length and width were measured as straight line vectors parallel to and perpendicular to the main contour trend of the ice body given by the IGM 1:50 000 contours. Maximum and minimum elevations were determined from the polygon outlines and elevations derived from the DTM. Glacier orientation was determined automatically using the Landscape Management System (LMS Tools) extension for ArcView 3.3; this extension determines the predominant orientation and slope in a polygon using a gridded DTM, in this case taken from the IGM 1 : 50 000 contours.
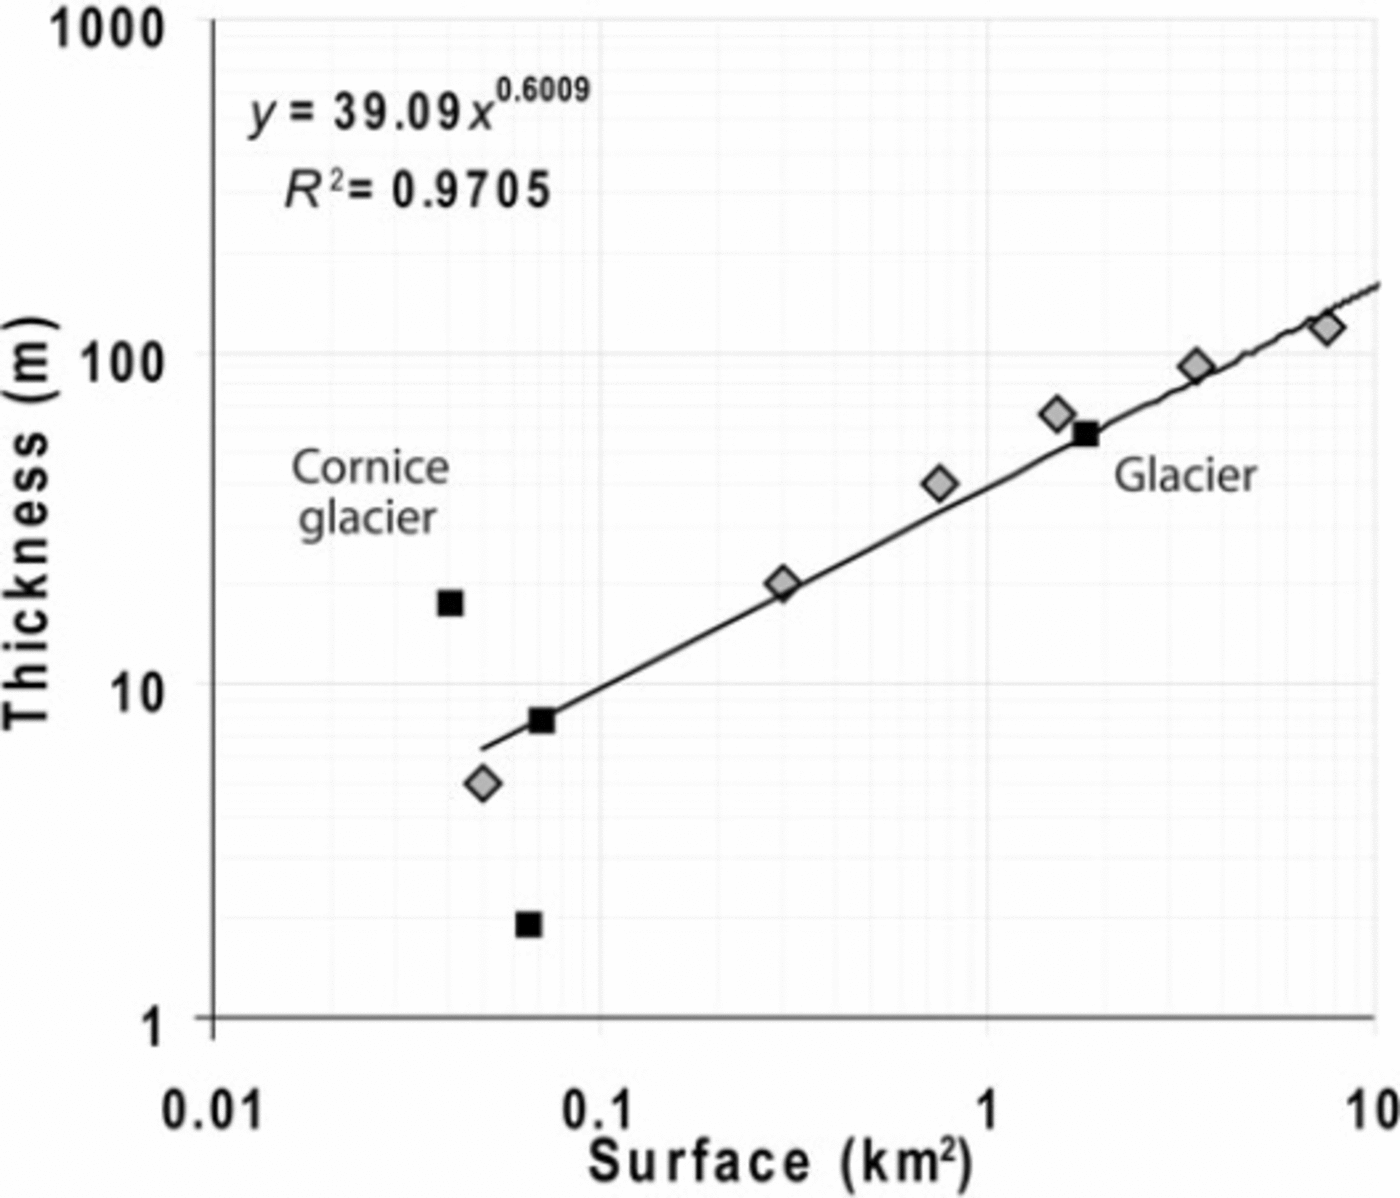
Mean glacier thickness was determined in accordance to an area–thickness relationship determined for glaciers in the Maipo valley of central Chile (Reference GinotMarangunic, 1979). Analysis of four ice bodies in the upper Huasco valley for which ground-penetrating radar (GPR) thickness data are available shows that the only glacier of the group is a good fit to the relationship, but of the three glacierets, two are outliers, with the positive outlier being a cornice glacieret (Fig. 2). From this we assume that the relationship applies to glaciers in this area as well, but it is less applicable to glacierets and may be likely to underestimate the thickness of cornice accumulations. Ice volumes were then estimated from the mapped glacier area and approximated mean ice thickness. Ice volume of rock glaciers was estimated following the method of Reference BrenningBrenning (2005), which assumes the average ice-rich thickness of all rock glaciers to be 30m and the volumetric ice content of this layer to be 50%. It should be noted that in the absence of bedrock topography and a more extensive program of GPR surveying on glaciers in the region, the ice volume estimates should be considered approximations only and it is impossible to provide error estimates on them. Water equivalents were calculated from these ice volumes using ice densities of 0.9 kgm–3 for the glaciers and 0.8 kgm–3 for the rock glaciers (Reference BrenningBrenning, 2005).
Relationships between glacier surface area and mean thickness. Grey diamonds and equation indicate the relationship given by Reference GinotMarangunic (1979); black squares represent three glacierets and one glacier in the Huasco valley computed from GPR measurements made by Golder Associates as part of the glacier monitoring program of the future Pascua-Lama mining project (Barrick Gold Corporation).
Results
Glaciation is limited in the upper Huasco valley, and many perennial features mapped are very small and are likely to be glacierets, névé patches or perennial cornices. In the first instance we consider all solid water features that were identified as perennial, and subsequently we consider thresholds for exclusion of smaller bodies. In the following discussion, all snow, firn or ice bodies are referred to as ‘glaciers’ for simplicity.
Of 152 glaciers identified, 111 were clean-ice glaciers, 1 was identified as having a debris-covered terminus and so was termed a debris-covered glacier and 40 were active rock glaciers. This population was considered as two groups: ‘glaciers’ (which includes the single glacier with a debris-covered terminus) and ‘rock glaciers’. These two groups constitute a total area of 23.17km2 of glacial features, of which 16.86 km2 are glaciers and 6.30 km2 are rock-glacier surfaces. Table 2 shows the distribution of glaciers within the sub-catchments shown in Figure 3. In comparison, in his inventory based on images from 1955 and 1961, Reference Favier, Falvey, Rabatel, Praderio and LόpezGarín (1987) identified 15 glaciers and snowpatches in the Huasco valley, ranging from 0.01 to 5.60 km2, although the latter area refers to a large snowpatch that was covering the location of present-day glaciers. The total ice-covered area given by Garín was 20.16 km2, which is 3.30 km2 more than the inventoried glacier area presented here for 2004. However, it should be noted that the two inventories are not directly comparable due to different techniques, imagery and scale of mapping used. The total estimated water volume of the glacier and rock-glacier component of the cryopshere in the upper Huasco valley in 2004 is 614.74 Mm3, of which 12% consists of rock glaciers.
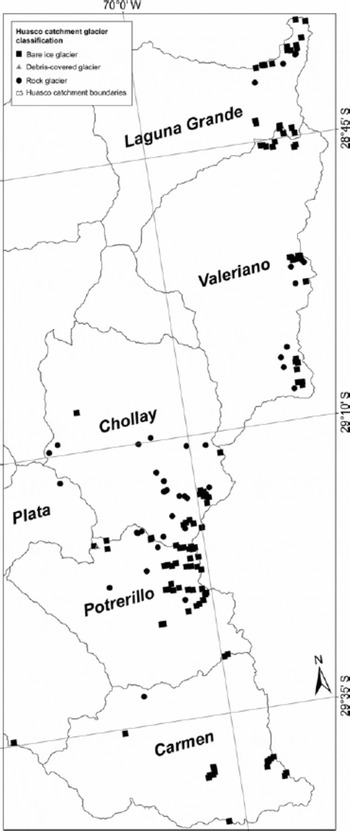
Glacier areas in terms of WGI rank sizes, separated by sub-catchments (see Fig. 3) and by glacier type
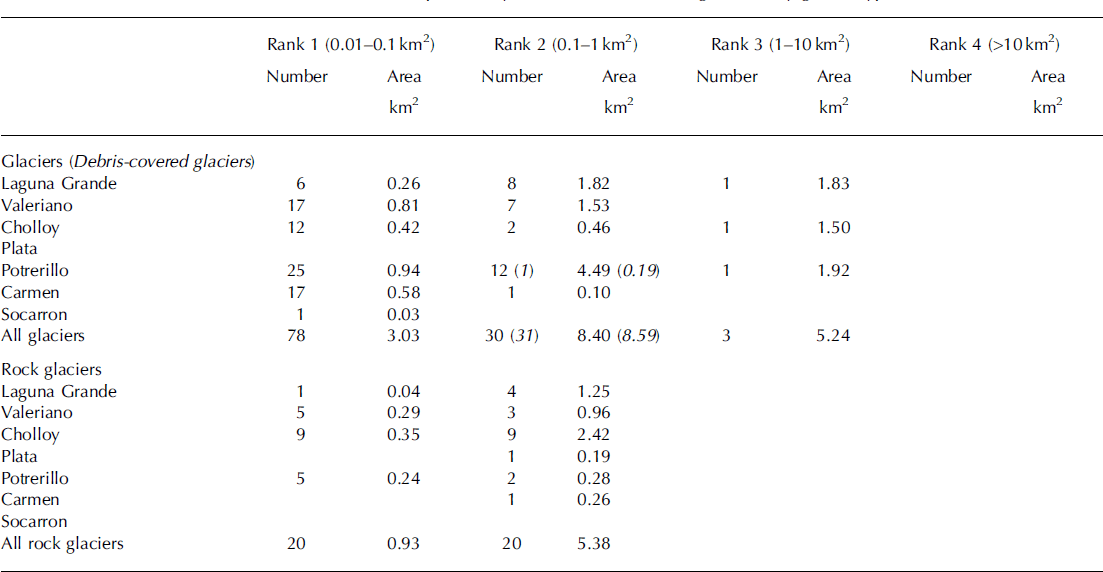
Mapped glacier features and sub-catchments of the upper Huasco valley.
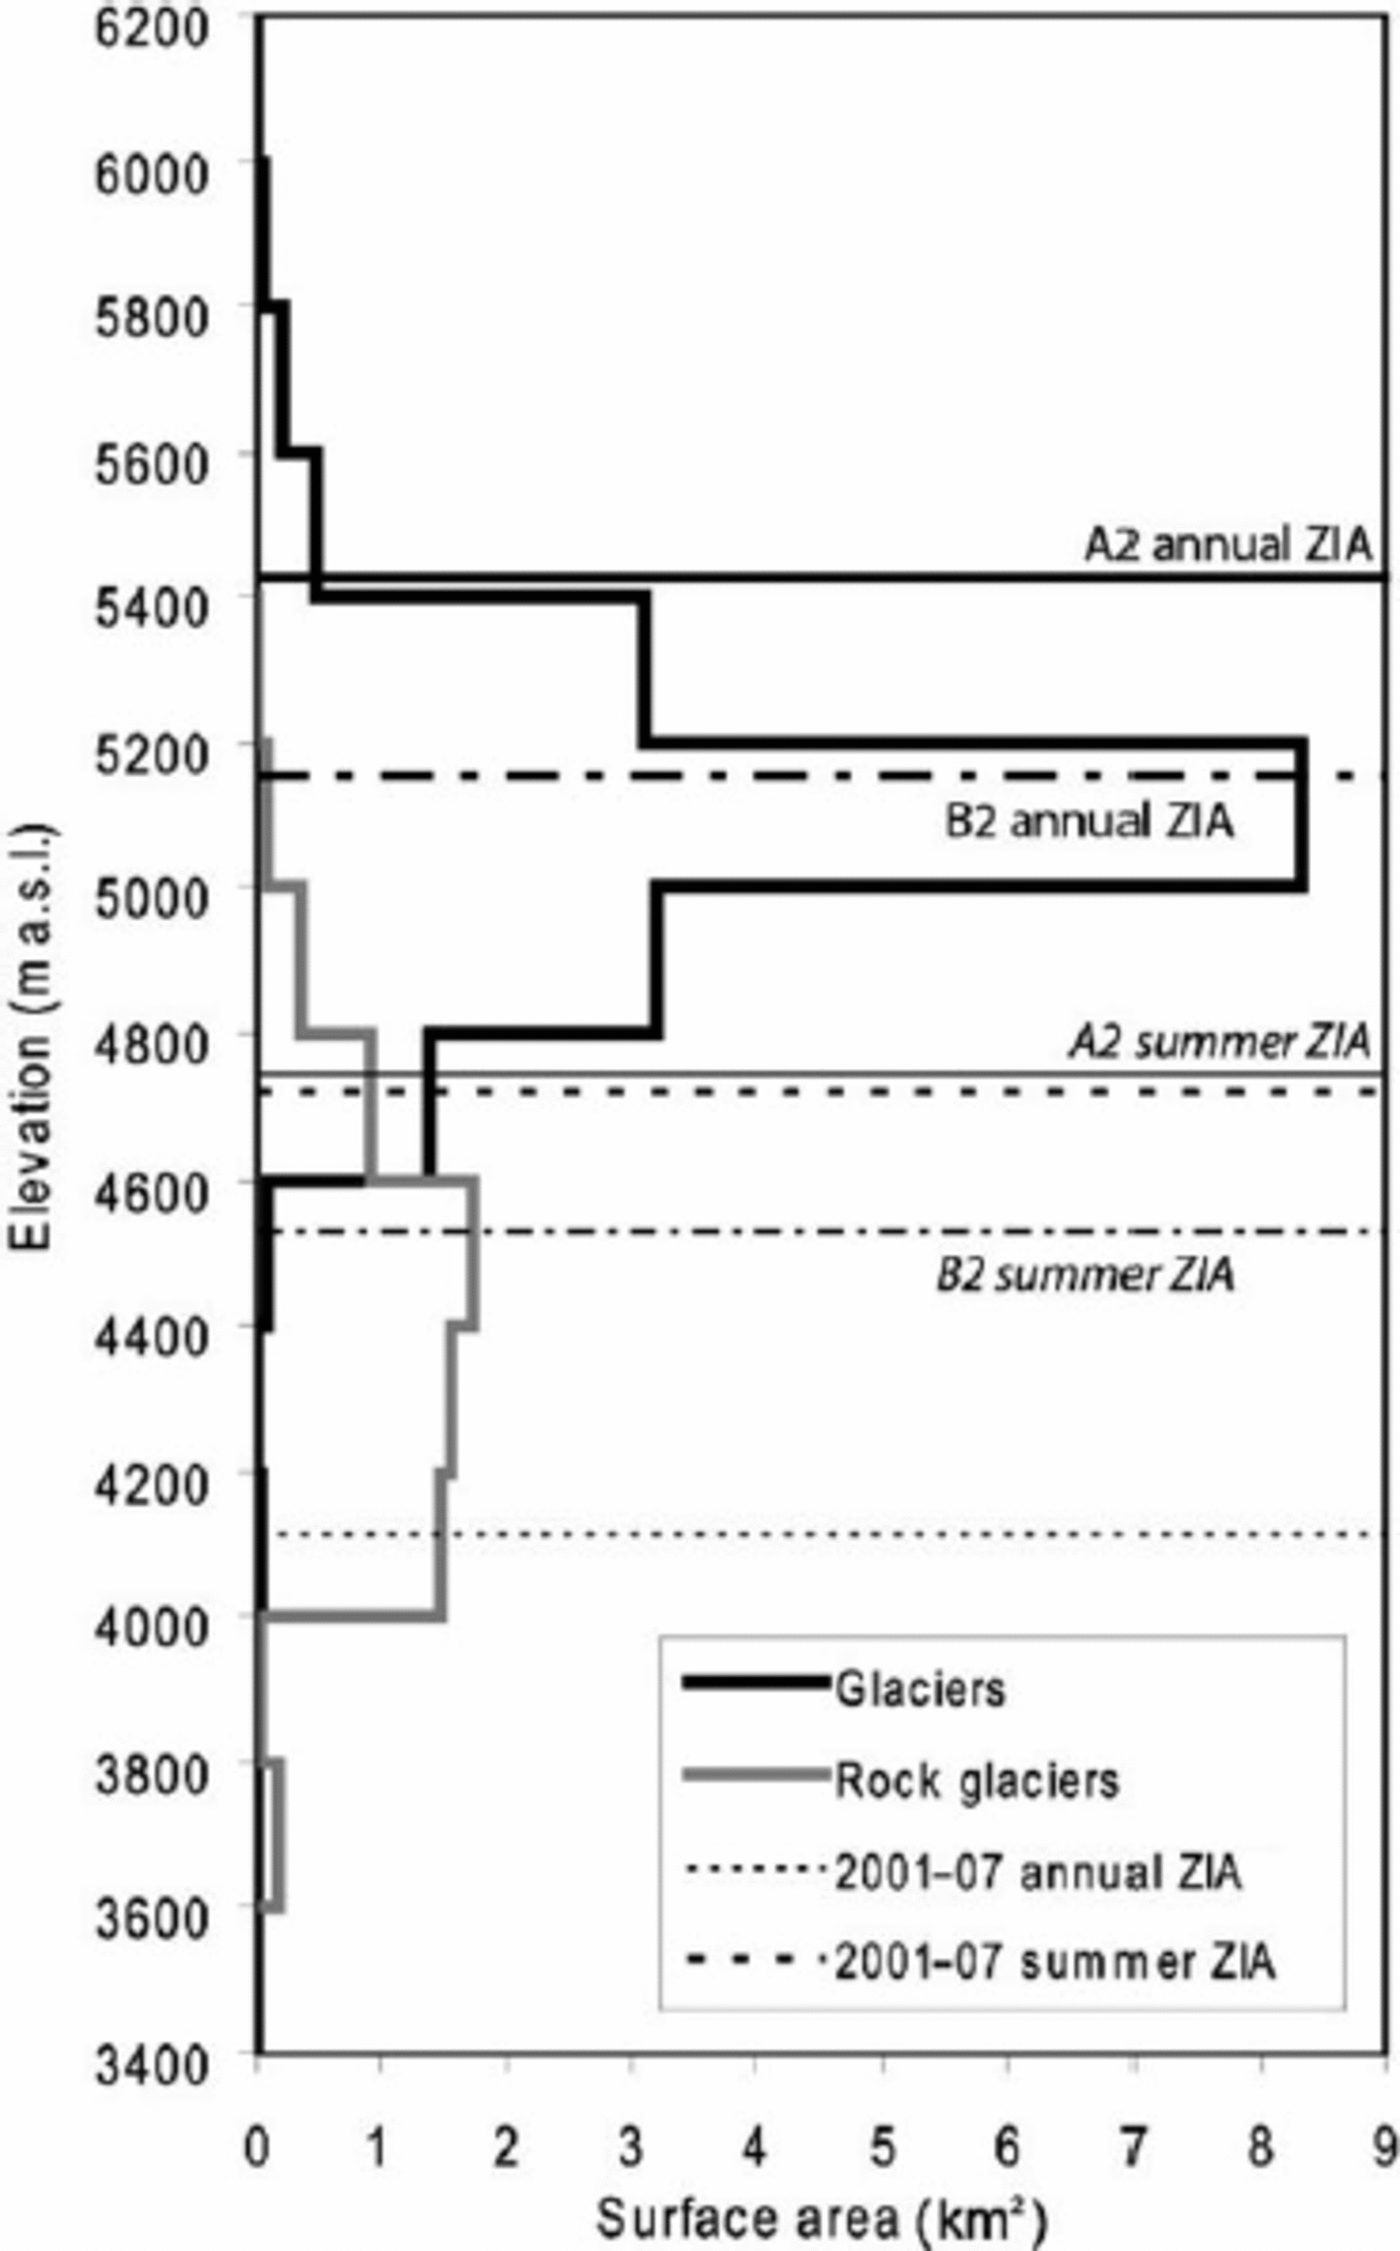
Glacier distribution is strongly controlled by aspect, with the result that over 80% of all the glaciers are on slopes orientated towards the southeast, south and southwest sectors. This preference is likely to be due in part to solar influences and in part to preferential lee-slope snow accumulation. There is no strong relationship between glacier size and latitude or longitude, as the glaciers are focused along high ridgelines. The hypsometry shows the majority of clean-ice area between 5000 and 5200ma.s.l., and the majority of rock-glacier surface area is found between 4000 and 4400ma.s.l. (Fig. 4). To elucidate this elevation distribution of glacial features in terms of air temperatures, the current zero-degree isotherm altitude (ZIA) was computed from two weather stations (3975 and 4927ma.s.l.) at the Pascua-Lama exploration mine site for 6 years (2001–2007). Annual ZIA is 4112 ma.s.l., and summer (December–March) ZIA is 4718 ma.s.l. This annual value is higher than that predicted from radiosonde measurements from coastal stations spanning 30–38˚ S Reference Carrasco, Casassa and Quintana(Carrasco and others, 2005), which would suggest a ZIA of about 3200ma.s.l., but is considered a more accurate representation for the upper catchment. Using these values, glacier surface area can be seen to exist above the summer ZIA, while rock glaciers are found between the annual and summer ZIA.
Area–altitude distribution of glaciers and rock glaciers in the upper Huasco catchment. Horizontal lines show the elevation of measured (2001–07) annual and summer ZIAs and PRECIS-modelled (2071–2100) annual and summer ZIAs for IPCC scenarios B2 and A2.
A recommended smallest size of 0.1km2 for features included in a glacier inventory is often used on the basis of optimizing comparability between inventories using different image types with different pixel resolution, for example if Landsat Thematic Mapper (25m pixel) images are being used. Applying this cut-off point to our data removes 70% of the glaciers counted, which represent 18% of the glacier area but only 3% of the estimated glacier volume. In the case of rock glaciers, this size threshold results in the rejection of 50% of those counted, representing 15% of the rock-glacier area and volume (Table 3).
Summary of upper Huasco inventory showing the area and estimated volume of glaciers and rock glaciers and the same values considering only features over and under a 0.1 km2 threshold

Many of the clean-ice glaciers identified were associated with ridgelines and are likely to be permanent or semipermanent snow cornices. These cornice features tend to be wider than they are long (where length is defined in the downslope direction) and were identified numerically using the ratio of glacier length to glacier width. Of the 112 glaciers, 40% have a length/width ratio <1, suggesting they are ridgeline or cornice features. Eight of the 34 glaciers with surface areas >0.1km2 were wider than they are long (24%), while 37 of the 78 glaciers with surface areas <0.1km2 were classified as ridgeline or cornice features (47%). Given that the area to average thickness relationship we used for glaciers appears to underestimate the volume of cornice features (Fig. 2) and that almost half of the small features excluded by this cut-off threshold are identified as cornice features, this suggests that the ice and water volumes represented by features <0.1km2 in Table 3 are a minimum estimate.
Discussion and Conclusions
Type of glaciation in the upper Huasco valley
No classical valley glaciers are present in the upper Huasco valley, and instead glaciation exists in the form of rock glaciers and glaciers/glacierets of limited extent. Glacier distribution is limited to ridgelines and shallow cirques and shows no regional gradients in glacier size. Even on high ridgelines, glaciers are limited to south-facing lee slopes, suggesting that shelter from wind ablation is an important control of glacier survival.
Methodological considerations
For the semi-arid Andes it is difficult to apply a number of the standard glacier inventory approaches suggested by WGI and GLIMS, as the glaciers here do not generally conform to the classical alpine glacier upon which inventory database parameters were previously based. For the upper Huasco valley a number of WGI attributes could not be determined. Due to the small size of ice features in the upper Huasco, maximum length and width parameters are more applicable than mean dimensions, and fields on snowline, accumulation and ablation zones are not relevant to this style of glaciation.
In this region of the Andes, rock glaciers are a significant water store (Reference BrenningBrenning, 2005) and they may become more hydrologically important under the influence of a warming climate. Currently, there are no WGI-approved criteria for mapping rock glaciers. In particular, it is necessary to develop a standard procedure for identifying the upper limits and the activity status of rock glaciers, which are both important factors for determining the area of the feature that may be ice-bearing. Inclusion of rock glaciers and the numerous small (<0.1 km2) ice bodies in the upper Huasco is required for an accurate hydrological estimate of the glaciological water stores.
Comparison of Norte Chico to central Chile
A recent inventory of the glaciers in the upper Aconcagua valley Reference Bown, Rivera and Acuña(Bown and others, 2008) provides an opportunity to compare the results of two Chilean glacier inventories in catchments north and south of the South American arid diagonal.
Most differences between these two regions can be attributed to the climatic setting, as the Huasco basin lies within the semi-arid conditions that prevail north of 32˚ S, whereas the Aconcagua basin has a more temperate environmental setting, with higher snowfall especially during winters affected by El Niño/El Niño–Southern Oscillation (ENSO) events, when precipitation well above normal is detected in the Andes of central Chile Reference Escobar and Aceituno(Escobar and Aceituno, 1998).
The outstanding difference between the two catchments is that there are essentially no debris-covered glaciers in the Huasco inventory, and rock glaciers constitute almost a quarter of the total accounted number of features (Table 3), whereas no rock glaciers were reported by Reference Bown, Rivera and AcuñaBown and others (2008) in the upper Aconcagua valley basin, and a third of the mapped ice area was debris-covered ice. In the Huasco basin, spatial distribution of glaciers shows a strong topographic control, with glaciers existing along ridgelines, and rock-glacier distribution appearing to be random, which is suggestive of very local topo-climatic controls and varying debris supply. In the Aconcagua region, the spatial pattern of ice distribution shows debris-covered glacier areas are concentrated in the southern sub-catchments of the upper Aconcagua valley and a significant increase of bare ice towards sub-catchments Juncal and Blanco, where most of the ice storage is located in deeply eroded high-elevation cirques.
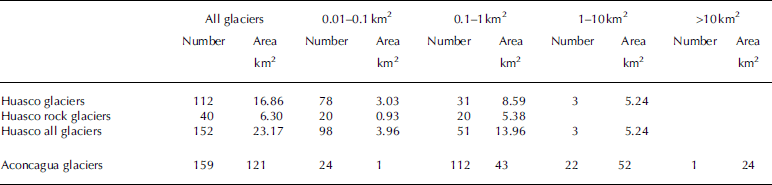
The two basins also differ significantly in terms of glacier distribution among the size classes. The upper Huasco valley contains many of the smallest size class of glaciers, which account for a non-negligible part of the net ice surface of the catchment, while in the Aconcagua region, where inventoried ice is fivefold larger (Table 4), ice bodies <0.1km2 play a marginal role.
Comparison of inventory data of Huasco and Aconcagua valleys
In the central Chilean Andes, active rock glaciers generally exist between 3500 and 4250ma.s.l. in relation to an annual ZIA of approximately 3600ma.s.l. (Reference BrenningBrenning, 2005). This relationship between ZIA and rock-glacier distribution is similar to that found in the upper Huasco, where the lower limit of active rock glaciers coincides (within 100 m) with the annual ZIA and rock glaciers exist in a range of 1000 m upwards of this level.
Glacier changes in the north-central Andes 1955– present
In Norte Chico, the surface area evolution of Glaciar Tronquitos (28˚32’ S, 69˚43‚ W) has been reconstructed using aerial photographs, showing a frontal retreat rate of 14ma–1 between 1955 and 1984 up to 23 ma–1 between 1984 and 1996 Reference Rau, Mauz, Vogt, Khalsa and Raup(Rivera and others, 2002). Expanding on this work, Figure 5a shows the comparison of glacier surface area evolution between 1955 and the early 21st century for six glaciers located between 28˚ S and 33˚ S. Their surface evolution has been reconstructed using aerial photographs and satellite images. Estrecho and Guanaco glaciers are located in the upper Huasco. Data from Reference Rau, Mauz, Vogt, Khalsa and RaupRivera and others (2002) on Glaciar Tronquitos have been updated with the 2004 ASTER images used for this study. Data from Glaciar Juncal Norte are presented in Reference Bown, Rivera and AcuñaBown and others (2008) and from Juncal Sur and Olivares Gamma glaciers in Reference KalthoffMasiokas and others (2008). A good consistency between changes in these six glaciers is observed. Their evolution over this 50 year period is homogeneous, although a slight acceleration could be suggested for some glaciers over the last decade (Juncal Norte, Olivares Gamma). Although some local conditions (e.g. topographical constraints Reference Bown, Rivera and Acuña(Bown and others, 2008) or mining activity (Reference BrenningBrenning, 2008)) may modify glacier retreat trends, climate should remain the main driving factor in glacier behavior.
(a) Surface evolution of sample Chilean glaciers (approximate central coordinates are given) and (b) glacier surface evolution as percent of the initial (1955) surface area. Data are from air photographs until 2003 and ASTER images thereafter; details of source data and mapping treatment are in the source articles.
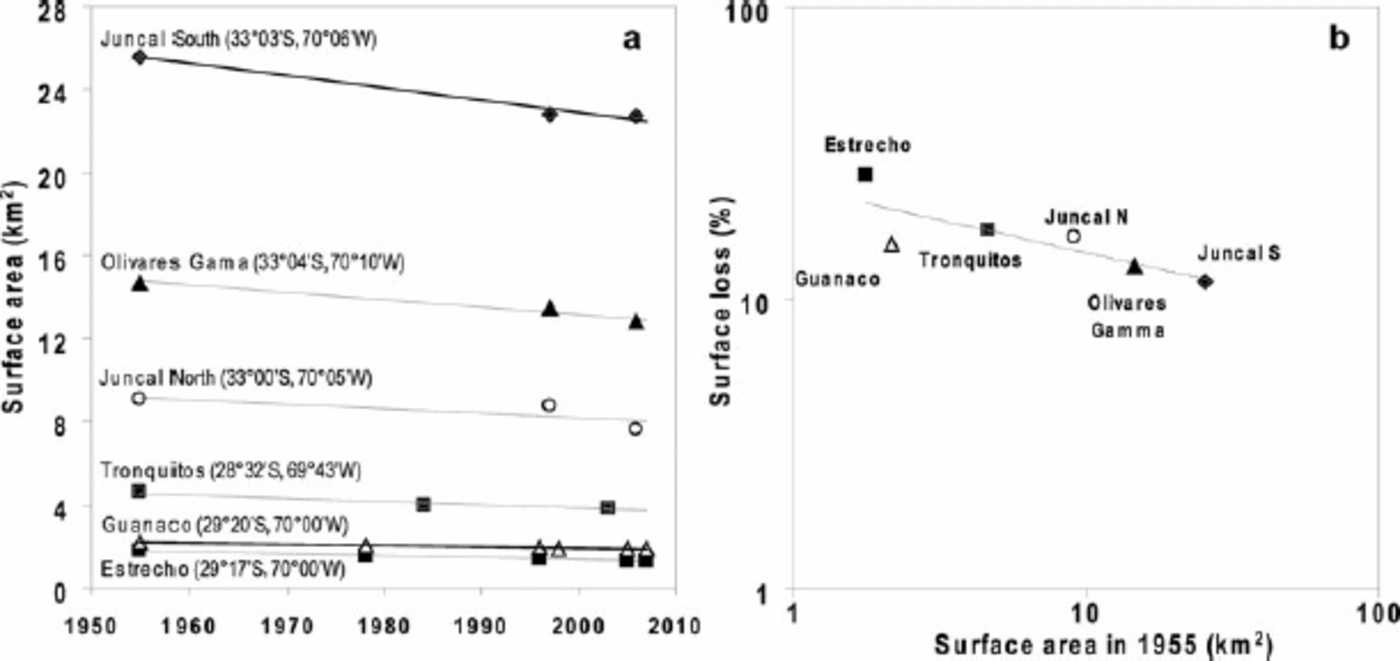
Figure 5bpresents a comparison between glacier loss during the last 50 years and their initial surface, showing a good relationship between surface lost and initial surface area. The small glaciers of the subtropical Andes (i.e. Estrecho, Guanaco and Tronquitos glaciers) experienced a greater retreat (in percent of their initial surface) than did the biggest glaciers of the central Andes of Chile (Juncal Norte, Juncal Sur and Olivares Gamma glaciers). This size dependency of response to climate also holds true within each climatic regime, with smaller glaciers within both the Huasco and the Aconcagua valleys showing a greater reduction in surface area compared with the climate response of the upper size-class glaciers within the same basins, which have been less affected proportionally by climate change.
Glacier change in future climate scenarios
Mid-troposperic warming has been highlighted as a cause for glacier retreat in central Chile, with changes in air temperature being more important in causing increases in glacier equilibrium-line altitude than are changes in precipitation Reference Carrasco, Casassa and Quintana(Carrasco and others, 2005). On this basis, a simple prediction of future glacier area change can be made using projected temperature shifts and the relationships established between the hypsometrical distribution of glacier surface area and the ZIA, to generate estimations of future glacier extent in the Huasco valley. Climate projections for 2071–2100 using Intergovernmental Panel on Climate Change (IPCC) scenarios B2 and A2 have been computed by the Departamento Geofisica of the Universidad de Chile using the PRECIS regional climate model (model description can be found at http://precis.metoffice.com/new_user.html and outputs are available at http://mirasol.dgf.uchile.cl/conama/).Modelled 2m air temperatures for 29.25˚ S and 70.00˚ E were used to compute the temperature change expected between average baseline (1961–90) and average future (2071–2100) conditions under the two climate scenarios. The temperature change was applied to the mean annual and summer air temperatures measured at 3975 ma.s.l. over the time period 2001–07. The modern-day (2001–07) lapse rate was used in conjunction with the projected temperatures to compute annual and summer ZIA for the B2 and A2 scenarios. Annual (summer) ZIA changes from the modern-day (2001–07) elevation of 4112 (4718)ma.s.l. to 4497 (5125)ma.s.l. under the conditions of scenario B2, and to 4718 (5400)ma.s.l. under the conditions of scenario A2 for the period 2071–2100. From the modern-day inventory we can approximate the lower limit of glaciers as the summer ZIA and the lower limit of rock glaciers as the annual ZIA (Fig. 4). Assuming glacial features below these limits will not be in equilibrium and thus will no longer exist under the projected conditions, scenario B2 suggests a loss of 11.00 km2 (65%) of current glacier area and 4.41 km2 (70%) of current active rock-glacier area, and scenario A2 suggests a loss of 16.07km2 (95%) of current glacier area and 5.72 km2 (91%) of current active rock-glacier area. However, it should be noted that these projected changes in glacierized area in the Huasco valley do not account for changing precipitation. PRECIS-modelled precipitation for the 2071–2100 period at the study site shows no significant change in precipitation amount or trend from the baseline period, but an increase in interannual variability, which will have an impact on how glacier mass balances respond to future climate change.
The glacier-derived water resources from the arid Andes contribute to the water supply downstream and are particularly important in maintaining summer base flow and water levels in drought periods. The results of this inventory reveal that the limited glaciation in the upper Huasco basin represents approximately 615 x106m3 of stored water. At present, the partitioning of glacier ice ablation into melt-waters and that lost to the atmosphere through sublimation remains poorly understood, as does the runoff contribution of rock glaciers in this region. Understanding the interaction of these ice masses with climate and projected climate change is likely to be important for long-term water resource management for the region.
Acknowledgements
Images used in this study were procured with funds provided by Barrick Gold Corporation as part of a glacier monitoring program in the arid Andes. We thank three reviewers for their helpful comments.



