




No CrossRef data available.
Article contents
Relation between subjective fogginess and neuropsychological testing following concussion
Published online by Cambridge University Press: 01 October 2004
Abstract
The purpose of this study was to examine the relation between the subjective report of feeling foggy at one-week post concussion and acute neuropsychological outcome. The outcome variables were derived from a computerized neuropsychological screening battery, Immediate Post-Concussion Assessment and Cognitive Testing (ImPACT). Participants were 110 high school students who sustained a sports-related concussion and were evaluated 5–10 days post injury (M = 6.8 days). Athletes were divided into two groups on the basis of self-reported fogginess. The first group reported no fogginess (n = 91), whereas the second group reported experiencing some degree of fogginess (n = 19) on a 6-point scale. The athletes with persistent fogginess experienced a large number of other post-concussion symptoms, compared to the athletes with no reported fogginess. In addition, the athletes with persistent fogginess had significantly slower reaction times, reduced memory performance, and slower processing speed. Thus, athletes with any degree of self-reported fogginess at one-week post injury are likely to have adverse effects from their concussions in multiple domains. (JINS, 2004, 10, 904–906.)
Information
- Type
- BRIEF COMMUNICATION
- Information
- Journal of the International Neuropsychological Society , Volume 10 , Issue 6 , October 2004 , pp. 904 - 906
- Copyright
- © 2004 The International Neuropsychological Society
INTRODUCTION
When assessing athletes who have recently sustained a concussion, a variety of somatic and cognitive symptoms are spontaneously reported. These symptoms often include problems with headache, dizziness, photophobia, memory, and concentration. Other descriptions of cognitive change include “feeling one step removed from my surroundings” or “feeling like I'm in a fog”. One author (M.G.) frequently heard these descriptions during his dissertation research with British Columbia Junior Hockey League players. Another author (M.R.L.) heard these complaints with such regularity in both amateur and professional athletes that the symptom “fogginess” was incorporated into his Postconcussion Scale that was developed through work with the Pittsburgh Steelers in the early 1990's.
The purpose of this study was to examine the relation between feeling mentally foggy at one-week post injury and neuropsychological outcome. The outcome variables were derived from a computerized neuropsychological screening battery called Immediate Post-Concussion Assessment and Cognitive Testing (ImPACT). A postconcussion symptom scale and three composite scores for reaction time, processing speed, and memory were used. It was hypothesized that high school athletes with self-reported fogginess would report more concussion symptoms, in general, than athletes who did not experience fogginess. Moreover, concussed athletes with persistent fogginess would perform more poorly on the neuropsychological composite scores than athletes without persistent fogginess.
METHODS
Participants
Participants in this study were 110 high school athletes who sustained a sports-related concussion during the 2000 and 2001 athletic seasons. All athletes participated in the Sports Medicine Concussion Program at the University of Pittsburgh Medical Center. Athletes were included from high schools within the states of Pennsylvania, Michigan, Illinois, Oregon, and Maine. Athletes entered into the study represented referrals for evaluation and were collected from high schools using the ImPACT neuropsychological test battery. Athletes were included in the sample if they exhibited signs or symptoms of concussion (as documented by a certified athletic trainer) following a sport-related injury. Following their initial diagnosis, athletes completed the ImPACT program under the direct supervision of an athletic trainer. ImPACT contains an internal scoring program, so there was no possibility for scoring errors by the trainers.
The average age of the sample was 15.8 years (SD = 1.2), and 84.5% were male. The majority of athletes were football players (63.6%). Other represented sports included basketball (12.7%), soccer (11.8%), hockey (3.6%), lacrosse (2.7%), softball (1.8%), track (.9%), volleyball (.9%), and wrestling (.9%). Half of the subjects (50.9%) reported at least one previous concussion, 33.6% reported that this was their first concussion, and 15.5% had missing data on this variable.
Protocol and Outcome Measures
Dependent measures were collected through the administration of ImPACT, a computerized neuropsychological test battery designed specifically for sports-related concussion. The test battery consists of seven individual cognitive test modules. Composite scores in the areas of memory, reaction time, and processing speed are computed by standardized formulas derived from the results of the seven individual cognitive tasks. In addition, the battery includes a Postconcussion Scale (Lovell & Collins, 1998). This Likert scale consists of 22 symptoms commonly associated with concussion (e.g., headache, dizziness, sleep deficits, nausea, feeling slowed down, etc.) that are graded from 0 (asymptomatic) to 6 (severely symptomatic). A more detailed description of the computerized test battery has been described in detail previously (Maroon et al., 2000).
Initial assessment of concussion was made by a certified athletic trainer or physician who was present at the time of injury. Concussion was diagnosed based on one or more of the following criteria as identified by on-field, court, rink examination: (1) any observable alteration in mental status or consciousness; (2) the presence of loss of consciousness and/or presence of anterograde amnesia (difficulty in forming new memory after trauma) or retrograde amnesia (difficulty in recalling events during period immediately preceding trauma); (3) evidence of a constellation of post-concussion symptoms, such as cognitive “fogginess”, nausea/vomiting, dizziness, balance problems, visual changes, presence of post-traumatic headache, etc., following a collision involving the head or body. All athletes were evaluated via computerized neuropsychological testing 5–10 days post diagnosis of concussion (M = 6.8 days). The Postconcussion Scale was completed by the athlete as part of the computerized test battery.
Formation of Outcome Groups
Concussed athletes were divided into two groups on the basis of self-reported fogginess at the time of the post-injury neuropsychological evaluation. The first group reported no fogginess at this follow-up interval (n = 91), whereas the second group reported experiencing fogginess (n = 19). Concussed athletes were included in the persistent fogginess group if they endorsed any degree of fogginess on the Post-Concussion Symptom Scale. Fogginess severity was rated on a 6-point scale, with 1 indicating very mild fogginess and 6 indicating severe fogginess. The breakdown of this group by fogginess severity was as follows: 1 = 31.6%, 2 = 21.1%, 3 = 10.5%, 4 = 31.6%, and 5 = 5.3%. The two groups did not differ in age but they did differ in gender composition. All of the athletes in the persistent fogginess group were male, whereas 19% of the athletes without persistent fogginess were female. We were not able to determine if the groups differed in academic background or achievement because this information was not available in the database.
RESULTS AND DISCUSSION
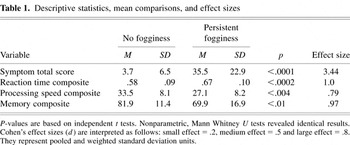
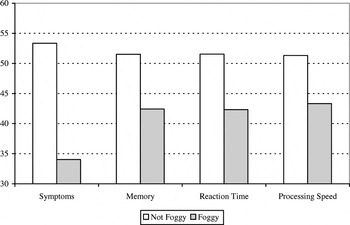
Athletes with persistent fogginess also experienced a large number of other post-concussion symptoms, compared to the athletes with no fogginess (p < .0001; d = 3.44, very large effect size). In addition, the athletes with persistent fogginess had significantly slower reaction times (p < .0002; d = 1.0, large effect), reduced memory performance (p < .01; d = .97, large effect), and slower processing speed (p < .004; d = .79, large effect). Descriptive statistics, mean comparisons, and effect sizes are presented in Table 1. These differences in total symptoms, reaction time, memory, and processing speed are illustrated graphically in Figure 1. Thus, athletes with any degree of self-reported fogginess at one-week post injury are likely to have adverse effects from their concussions in multiple domains at this point.
Descriptive statistics, mean comparisons, and effect sizes


Comparison of groups on the four composite scores transformed into uniform T scores. These T scores are not normative T scores. They are standardized scores. The distributions of scores for each composite were standardized with a mean of 50 and a standard deviation of 10. The direction of the symptom score and the reaction time score was reversed, so that lower T scores represented worse scores. Thus, all four composites can be compared graphically on a common metric.
This study is preliminary and exploratory. An obvious question is whether there is anything unique about the symptom of “fogginess.” It is obvious that athletes who report fogginess at one week post injury also report many other symptoms. It was beyond the scope of this paper to systematically analyze every symptom in this manner. However, this same methodology recently was used to study the relation between headache and neuropsychological outcome in concussed amateur athletes (Collins et al., 2003). That is, 73 concussed athletes with no reported headaches at approximately 7 days post injury were compared to 36 athletes who had reported headaches at this post-injury interval. The effect sizes for the symptom total score (d = 1.55), reaction time composite (d = .80), and memory composite (d = .60) were all smaller in the headache study versus the current study. Moreover, in the headache study, the groups did not differ on the processing speed composite. As seen in Table 1, the effect sizes are much bigger in this study involving fogginess than in the headache study.
In the current sample, any degree of fogginess was associated with increased risk for incomplete recovery at one-week post injury. Therefore, high school athletes with post-injury fogginess, regardless of severity, will likely benefit from an extended break from participation. Future research is necessary, however, to determine if one or two subjective symptoms can be used as a simplified return-to-play heuristic for coaches and athletic trainers.
References
REFERENCES
Collins, M.W.,
Field, M.,
Lovell, M.R.,
Iverson, G.L.,
Johnston, K.M.,
Maroon, J., &
Fu, F.H.
(2003).
Relationship between post-concussion headache and
neuropsychological test performance in high school athletes.
American Journal of Sports Medicine,
31,
168–173.Google Scholar
Lovell, M.R. &
Collins, M.W.
(1998).
Neuropsychological assessment of the college football player.
Journal of Head Trauma Rehabilitation,
13,
9–26.CrossRefGoogle Scholar
Maroon, J.C.,
Lovell, M.R.,
Norwig, J.,
Podell, K.,
Powell, J.W., &
Hartl, R.
(2000).
Cerebral concussion in athletes: Evaluation and neuropsychological
testing.
Neurosurgery,
47,
659–672.Google Scholar
Descriptive statistics, mean comparisons, and effect sizes
Comparison of groups on the four composite scores transformed into uniform T scores. These T scores are not normative T scores. They are standardized scores. The distributions of scores for each composite were standardized with a mean of 50 and a standard deviation of 10. The direction of the symptom score and the reaction time score was reversed, so that lower T scores represented worse scores. Thus, all four composites can be compared graphically on a common metric.
 You have
Access
- 95
- Cited by