





1. Introduction
Internal tides (ITs) are internal gravity waves generated in the ocean interior when the barotropic tidal flow sloshes the stratified ocean over variable bottom topography (e.g. Wunsch Reference Wunsch1975). They play an important role in the conversion and dissipation of tidal energy, and contribute to ocean mixing. It is estimated that 30 % of the total energy of the barotropic tide is lost to the generation of ITs on the global scale (Garrett & Kunze Reference Garrett and Kunze2007). Most of the energy of the ITs are contained in the low-mode waves, which propagate away from the generation site for thousands of kilometres (e.g. Garrett Reference Garrett2003). These modes explain important dynamics of ITs and can leave significant signatures on the ocean surface to be observed through remote sensing, e.g. satellite altimetry (e.g. Ray & Mitchum Reference Ray and Mitchum1996; Dushaw Reference Dushaw2002; Tian, Zhou & Zhang Reference Tian, Zhou and Zhang2006; Zhao & Alford Reference Zhao and Alford2009).
The propagation of ITs can be affected by the dynamic rotational and heterogeneous ocean background, i.e. the dynamic mean flow and density fields, as well as the spatially varying topography. The influence of (some or all of) these background features on the low-mode ITs have been studied through ray tracing (e.g. Rainville & Pinkel Reference Rainville and Pinkel2006; Duda et al. Reference Duda, Lin, Buijsman and Newhall2018), mooring observations (e.g. Huang et al. Reference Huang, Wang, Zhang, Yang, Zhou, Yang, Zhao and Tian2018), scattering theory (e.g. Olbers Reference Olbers1981a; Savva & Vanneste Reference Savva and Vanneste2018) and coupled vertical-mode equations (e.g. Dunphy & Lamb Reference Dunphy and Lamb2014; Zaron & Egbert Reference Zaron and Egbert2014; Kelly & Lermusiaux Reference Kelly and Lermusiaux2016; Dunphy et al. Reference Dunphy, Ponte, Klein and Le Gentil2017; Li et al. Reference Li, Mao, Huthnance, Cai and Kelly2019). The mesoscale variability of the background has been shown to significantly affect ITs, resulting in loss of coherence (with astronomical forcing), even close to their generation sites (e.g. Chavanne et al. Reference Chavanne, Flament, Luther and Gurgel2010; Nash et al. Reference Nash, Shroyer, Kelly, Inall, Duda, Levine, Jones and Musgrave2012; Buijsman et al. Reference Buijsman, Arbic, Richman, Shriver, Wallcraft and Zamudio2017). Theoretically, methods to study these interactions can be classified depending on the comparative scales of the IT and the background variation.
For many cases, the horizontal scale of the low-mode IT,  $O(100\ \textrm {km})$, is similar to that of the variable ocean medium, such as the mesoscale mean flow or the continental shelfbreak. An appropriate assumption is then the separation of time scales between the IT and the background evolution. Existing models to describe this type of interaction include the ‘coupled-mode tidal equations’ (CTE) developed in Kelly & Lermusiaux (Reference Kelly and Lermusiaux2016) and Kelly et al. (Reference Kelly, Lermusiaux, Duda and Haley2016) and the ‘hydrostatic wave equation’ (HWE) developed in Wagner, Ferrando & Young (Reference Wagner, Ferrando and Young2016). Both models are derived from the hydrostatic Boussinesq equations and extract the dynamical evolution of the IT field neglecting the nonlinear wave–wave interactions. The HWE considers the slow evolution of the tidal amplitude in a quasi-geostrophic mean flow, which is of similar magnitude as the IT and slowly evolves due to the advection of potential vorticity. The CTE expands the wave field using vertical modes superposed on an arbitrarily prescribed mean flow, and considers the evolution of modal amplitudes on a fast time scale resolving the tidal motions. Specifically, the CTE is derived using a decomposition of the tidal and background fields similar to the Reynolds decomposition in turbulent flows, so it does not restrict the profile of the mean flow and incorporates the variations of topography and density fields. The vertical modes as utilized in the CTE facilitate the dynamical analysis of ITs and help explain their life cycles. For example, vertical modes of ITs have been used to estimate the geography of topographic tidal conversion rates (Falahat et al. Reference Falahat, Nycander, Roquet and Zarroug2014) and energy dissipation (Kelly et al. Reference Kelly, Jones, Nash and Waterhouse2013; de Lavergne et al. Reference de Lavergne, Falahat, Madec, Roquet, Nycander and Vic2019) in global ocean models.
In the derivation and application of CTE (Kelly & Lermusiaux Reference Kelly and Lermusiaux2016), the effect of the mean flow is decomposed separately from the modal conversion due to the horizontal variation of topography and buoyancy (e.g. shelfbreak front). Therefore, neither the model nor the analysis account for the three-way co-existent mean flow, buoyancy and horizontally varying topography. In § 2, we extend the derivation of CTE describing the interactions of ITs with varying mean flow, topography and buoyancy fields, with additional terms accounting for the three-way interactions. In § 3, the IT dynamics is extracted from the simulations of the primitive equations (PEs), for a set of idealized cases and two realistic data-assimilative cases in the Middle Atlantic Bight region (broad shelf with tides and shelfbreak to strong western boundary current) and Palau Island region (narrow shelf with tides and steep topography to deep ocean with eddy fields and broad currents). The derived extended CTE is verified and it is shown that the new terms are necessary to enhance the accuracy of CTE in describing the dynamics of ITs in regions with co-existent background features and strong tides. The CTE analysis is used to study the modal energy budget in the generation and propagation of ITs in the two realistic cases, quantifying the effects of mean-flow advection, energy exchanges with background fields and modal conversions due to topography–buoyancy–mean-flow effects. Of course, we note that ITs can significantly force the mean flow in return, through mechanisms of net momentum flux (in the presence of a bottom flow) (Shakespeare & McC. Hogg Reference Shakespeare and McC. Hogg2019) and/or dissipation (Grisouard & Bühler Reference Grisouard and Bühler2012). Presently, all such IT feedback is accounted for in our nonlinear PE simulations: we only use the CTE to diagnose ITs, not as a predictive model. For the equation governing the evolution of the mean flow including IT feedback, we refer to Kelly & Lermusiaux (Reference Kelly and Lermusiaux2016).
The interaction of ITs with the background (in particular with the mean flow) described by the CTE can be simplified in some cases. Considering the mean flow as a barotropic, weak (i.e. small Rossby number) and homogeneous random (turbulent) field, a kinetic equation can be derived which governs the scattering of ITs by the turbulent flow background (Savva & Vanneste Reference Savva and Vanneste2018). This analysis has also been applied to study the interactions of internal gravity waves with a mean flow, with (Kafiabad, Savva & Vanneste Reference Kafiabad, Savva and Vanneste2019) and without (Savva, Kafiabad & Vanneste Reference Savva, Kafiabad and Vanneste2020) spatial scale separation in a three-dimensional unbounded domain. If the mean flow is considered as deterministic with a (much) larger horizontal scale compared with the IT (but not necessarily weak), the Wentzel–Kramers–Brillouin (WKB) approximation can be used to study the interaction, i.e. as the wave trains propagate through physical space, they slowly change their amplitudes and wavenumbers. This applies to the situation of higher-mode ITs on a mesoscale mean flow or lower-mode ITs on large-scale mean current. In general, the modulation of wave amplitude in a slowly varying medium is described by the conservation of wave action, derived from the method of averaged Lagrangian and shown for multiple types of waves (Whitham Reference Whitham1965; Bretherton & Garrett Reference Bretherton and Garrett1968). In an unbounded domain, the horizontal and vertical propagations of internal waves are studied using Lagrangian (Salmon Reference Salmon2016) and Eulerian (Muller Reference Muller1976; Olbers Reference Olbers1981b) approaches, with both leading to the principle of conservation of wave action. In a vertically bounded domain, the trace of the horizontal propagation of the vertical modes in a barotropic current is studied in Rainville & Pinkel (Reference Rainville and Pinkel2006) using geometric ray theory. The method has also been extended to baroclinic currents using non-orthogonal vertical modes (Duda et al. Reference Duda, Lin, Buijsman and Newhall2018). However, the evolution of modal amplitude along the ray is yet to be established, and a representative case is desired to physically understand this modulation effect.
In § 4, we show that, in a heterogeneous medium represented by a barotropic current with slow horizontal variation, the CTE can be reduced to the principle of conservation of modal wave action for each decoupled mode (or equivalently the evolution of modal energy with the terms of radiation stress; Longuet-Higgins & Stewart Reference Longuet-Higgins and Stewart1960). This derivation in § 4.1 supplements Rainville & Pinkel (Reference Rainville and Pinkel2006) and establishes the theoretical framework of the WKB approach for the horizontal propagation of modal ITs in a vertically bounded domain. In § 4.2, the usefulness of the developed principle is demonstrated in the analysis of the propagation of IT from a quiescent region into a collinear current. The modulation of the IT by the current (including the variations of wavenumber and modal energy) is analytically obtained. It is shown that the modal wavelength becomes longer on a following current, and shorter on an opposing current. For a given current magnitude, the extent of this refraction effect is determined by the key parameter  $f/\omega _0$, which is the ratio of inertial frequency and tidal frequency. The modal energy of the IT is shown to be suppressed by a following current, and amplified by an opposing current, but an anomaly occurs for
 $|\,f/\omega _0|$ above a threshold value (near-inertial waves) whose physical reason is elucidated. For an opposing current, the critical current speed (as a fraction of the modal phase speed) that triggers modal IT focusing is analytically obtained as a function of
 $f/\omega _0$. The implications of these analytical solutions to the propagation of ITs in the real ocean are discussed. Conclusions are given in § 5.
2. Generalized formulation of the CTE
Starting from Kelly & Lermusiaux (Reference Kelly and Lermusiaux2016) and Kelly et al. (Reference Kelly, Lermusiaux, Duda and Haley2016), we extend the derivation of the CTE to include simultaneous effects of the mean flow and horizontal variations of buoyancy and topography. This leads to generalized momentum and energy equations with key new terms describing the interaction of ITs with co-varying background features.
2.1. Governing equations
We start from the inviscid, incompressible, hydrostatic and Boussinesq momentum, continuity and internal energy equations (e.g. Cushman-Roisin & Beckers Reference Cushman-Roisin and Beckers2011)
 $$\begin{gather} \frac{\textrm{D} \boldsymbol{u}_{tot}(\boldsymbol{x},z,t)}{\textrm{D}t}+ \boldsymbol{f}\times\boldsymbol{u}_{tot}(\boldsymbol{x},z,t) ={-}\frac{1}{\rho_0}\boldsymbol{\nabla} p_{tot}(\boldsymbol{x},z,t), \end{gather}$$
 $$\begin{gather}\frac{\partial p_{tot}(\boldsymbol{x},z,t)}{\partial z}+\rho_{tot}(\boldsymbol{x},z,t) g=0, \end{gather}$$
 $$\begin{gather}\boldsymbol{\nabla} \boldsymbol{\cdot} \boldsymbol{u}_{tot}(\boldsymbol{x},z,t) + \frac{\partial w_{tot}(\boldsymbol{x},z,t)}{\partial z}=0, \end{gather}$$
 $$\begin{gather}\frac{\textrm{D} \rho_{tot}(\boldsymbol{x},z,t)}{\textrm{D}t}=0, \end{gather}$$
where  $\boldsymbol {x}\equiv (x,y)$ is the horizontal plane,
 $z$ is the upward vertical axis,
 $\boldsymbol {\nabla }\equiv (\partial /\partial x, \partial /\partial y)$ is the horizontal divergence operator,
 $t$ is the time,
 $\textrm {D}/\textrm {D}t$ the material derivative, and
 $\boldsymbol {u}_{tot}\equiv (u_{tot}, v_{tot}), w_{tot}, p_{tot}$ and
 $\rho _{tot}$ are respectively the total horizontal velocity, vertical velocity, pressure and density;
 $\boldsymbol {f}\equiv f\hat {z}$ with
 $f$ being the inertial (Coriolis) frequency and
 $\hat {z}$ the unit upward vector;
 $\rho _0$ is the reference density (due to the Boussinesq approximation) and
 $g$ the gravitational acceleration. We note that the hydrostatic approximation made in (2.1b) is generally valid for large-scale, lower-mode ITs, which are the focus of the present paper. Non-hydrostatic effects can be important for higher IT modes (e.g. in estuaries).
We consider the total field as a superposition of a rapidly evolving tidal flow field and a time-averaged (or slowly evolving) background field (e.g. Kunze Reference Kunze1985)
 $$\begin{gather} \boldsymbol{u}_{tot}(\boldsymbol{x},z,t)=\boldsymbol{U}(\boldsymbol{x},z; t_0, \tau)+\boldsymbol{u}(\boldsymbol{x},z,t), \end{gather}$$
 $$\begin{gather}w_{tot}(\boldsymbol{x},z,t)=W(\boldsymbol{x},z; t_0, \tau)+\boldsymbol{w}(\boldsymbol{x},z,t), \end{gather}$$
 $$\begin{gather}\rho_{tot}(\boldsymbol{x},z,t)=\rho_0-\frac{\rho_0}{g}b_{tot}(\boldsymbol{x},z,t),\quad b_{tot}=B(\boldsymbol{x},z; t_0, \tau)+b(\boldsymbol{x},z,t), \end{gather}$$
 $$\begin{gather}p_{tot}(\boldsymbol{x},z,t)=p_0(z)+P(\boldsymbol{x},z; t_0, \tau)+p(\boldsymbol{x},z,t), \end{gather}$$
where ( $\boldsymbol {U}(\boldsymbol {x},z; t_0, \tau ), W(\boldsymbol {x},z; t_0, \tau )$) is the
 $[t_0, t_0+\tau ]$ time-averaged flow field defined by
 \begin{equation} \boldsymbol{U} = \int_{t=t_0}^{t_0+\tau} \boldsymbol{u}_{tot} \, \textrm{d} t, \quad W = \int_{t=t_0}^{t_0+\tau} w_{tot} \, \textrm{d} t, \end{equation}
where  $\tau$ is a time scale much larger than the tidal period; (
 $\boldsymbol {u}(\boldsymbol {x},z,t), w(\boldsymbol {x},z,t)$) is the oscillatory tidal flow field; and
 $b_{tot}(\boldsymbol {x},z,t) \equiv -g\rho '(\boldsymbol {x},z,t)/\rho _0$ is the buoyancy term that is further decomposed into its time-averaged
 $B(\boldsymbol {x},z; t_0, \tau )$ and oscillatory
 $b(\boldsymbol {x},z,t)$ parts, where
 $\rho '(\boldsymbol {x},z,t)\equiv \rho _{tot}(\boldsymbol {x},z,t)-\rho _0$ is the perturbed density due to stratification, mean flow and ITs. The hydrostatic pressures
 $p_0(z), P(\boldsymbol {x},z; t_0, \tau )$ and
 $p(\boldsymbol {x},z,t)$ are determined respectively from
 $\rho _0, B(\boldsymbol {x},z)$ and
 $b(\boldsymbol {x},z,t)$.
For notational simplicity, we will hereafter omit writing the dependence of the background field on  $t_0$ and
 $\tau$, but one should keep in mind that the background field evolves slowly with a time scale
 $\tau$ that is (much) larger than the tidal period. The equations governing the small amplitude oscillatory tidal flow (Kelly & Lermusiaux Reference Kelly and Lermusiaux2016) are obtained by subtracting the time-averaged background part from the total (2.1) using (2.2) and neglecting the component of wave–wave interactions, which gives
 $$\begin{gather} \frac{\partial \boldsymbol{u}}{\partial t}+(\boldsymbol{U}\boldsymbol{\cdot}\boldsymbol{\nabla})\boldsymbol{u} +(\boldsymbol{u}\boldsymbol{\cdot}\boldsymbol{\nabla})\boldsymbol{U} + w\frac{\partial \boldsymbol{U}}{\partial z} + W\frac{\partial \boldsymbol{u}}{\partial z} + \boldsymbol{f}\times\boldsymbol{u} ={-}\frac{1}{\rho_0}\boldsymbol{\nabla} p, \end{gather}$$
 $$\begin{gather}\frac{1}{\rho_0}\frac{\partial p}{\partial z}-b=0, \end{gather}$$
 $$\begin{gather}\boldsymbol{\nabla} \boldsymbol{\cdot} \boldsymbol{u} + \frac{\partial w}{\partial z}=0, \end{gather}$$
 $$\begin{gather}\frac{\partial b}{\partial t}+(\boldsymbol{U}\boldsymbol{\cdot}\boldsymbol{\nabla})b +(\boldsymbol{u}\boldsymbol{\cdot}\boldsymbol{\nabla})B+W\frac{\partial b}{\partial z}+wN^2=0, \end{gather}$$
where  $N(\boldsymbol {x},z)$ is the spatially varying background buoyancy frequency, with
 \begin{equation} N^2(\boldsymbol{x},z) \equiv \frac{\partial B}{\partial z}. \end{equation}
Note that, although we neglect the wave–wave interactions in (2.4), when we diagnose a full PE simulation the time average of the wave–wave interactions is fully preserved in the background fields (see (3) in Kelly & Lermusiaux Reference Kelly and Lermusiaux2016).
The tidal field is governed by (2.4) in a vertically bounded domain from  $z=-H(\boldsymbol {x})$ to
 $z=0$. We assume simplified boundary conditions
 \begin{equation} w=0, \quad \text{at } z=0\ \text{and}\ z={-}H(\boldsymbol{x}). \end{equation}
The error introduced by (2.6) is of the same order as the small errors done in the hydrostatic approximation given that  $\alpha \sim O(H/L)$, where
 $\alpha$ is the boundary slope due to surface elevation and sloping bottom topography, and
 $L$ is the horizontal scale. Specifically, for
 $\alpha \sim O(H/L)$, we neglect a vertical velocity component of
 $O(U_hH/L)$ in the flow field, where
 $U_h$ is the characteristic horizontal velocity. This approximation is of the same order as the hydrostatic approximation used to neglect the vertical velocity component in (2.4b) (Cushman-Roisin & Beckers Reference Cushman-Roisin and Beckers2011) and is therefore justified. This simplification facilitates the vertical-mode decomposition introduced in § 2.2, although more accurate ways to specify the boundary conditions exist (Griffiths & Grimshaw Reference Griffiths and Grimshaw2007; Kelly Reference Kelly2016). The ultimate validity of the derivation including this simplification can be evaluated by comparison with the PE simulations.
2.2. Projection onto vertical modes and CTE
We consider the tidal field described by (2.4) subject to (2.6). The traditional vertical decomposition of ITs can be obtained by considering constant topography, zero mean flow and zero horizontal buoyancy gradient. Under these conditions, (2.4) can be solved, leading to decoupled orthogonal vertical modes as the solution of an eigenvalue problem depending only on  $N^2(z)$ and
 $H$. With the complexities added by the varying mean flow, topography and buoyancy frequency in (2.4), the decoupling of vertical modes is not possible (the horizontal variation of the background prohibits the vertical modes being independent of the horizontal location, and the depth-varying background renders the eigenvalue problem to be of the Taylor–Goldstein form, yielding non-orthogonal eigenmodes, see Duda et al. Reference Duda, Lin, Buijsman and Newhall2018; Huang et al. Reference Huang, Wang, Zhang, Yang, Zhou, Yang, Zhao and Tian2018). However, as in Kelly & Lermusiaux Reference Kelly and Lermusiaux2016, we can use a different treatment by decomposing the vertical tidal structure into prescribed orthogonal vertical modes determined from local
 $N^2(\boldsymbol {x},z)$ and
 $H(\boldsymbol {x})$, and deriving equations governing the evolution of the modal amplitudes at all locations in the horizontal plane. Although this treatment results in equations involving the coupling of the vertical modes, it is still desirable as it replaces the vertical dependence of ITs with modal representation. With the major dynamics of IT captured by the lowest few modes which contain most of the energy and propagate for a long distance (e.g. Nash et al. Reference Nash, Kunze, Lee and Sanford2006; Alford & Zhao Reference Alford and Zhao2007), the modal approach provides a reduced-order model for the IT.
Therefore, we consider the expansion of the IT field as a series of vertical modes (Kelly & Lermusiaux Reference Kelly and Lermusiaux2016)
 $$\begin{gather} \boldsymbol{u}(\boldsymbol{x},z,t)=\sum_{n=0}^\infty \boldsymbol{u}_n(\boldsymbol{x},t)\phi_n(\boldsymbol{x},z,\tau), \end{gather}$$
 $$\begin{gather}p(\boldsymbol{x},z,t)=\sum_{n=0}^\infty p_n(\boldsymbol{x},t)\phi_n(\boldsymbol{x},z,\tau), \end{gather}$$
 $$\begin{gather}w(\boldsymbol{x},z,t)=\sum_{n=0}^\infty w_n(\boldsymbol{x},t)\varPhi_n(\boldsymbol{x},z,\tau), \end{gather}$$
 $$\begin{gather}b(\boldsymbol{x},z,t)=\sum_{n=0}^\infty b_n(\boldsymbol{x},t)N^2(\boldsymbol{x},z)\varPhi_n(\boldsymbol{x},z,\tau), \end{gather}$$
where  $n$ is the mode number,
 $\boldsymbol {u}_n(\boldsymbol {x},t), p_n(\boldsymbol {x},t), w_n(\boldsymbol {x},t)$ and
 $b_n(\boldsymbol {x},t)$ are modal amplitudes. Here,
 $\varPhi _n(\boldsymbol {x},z,\tau )$ and
 $\phi _n(\boldsymbol {x},z,\tau )$ are the vertical modes determined locally at each
 $\boldsymbol {x}$. As we did for the background fields, we will omit writing the dependency of the vertical modes on
 $\tau$. For
 $n \geq 1$, the internal baroclinic modes (mode-
 $1$ to mode-
 $n$) are defined by a prescribed eigenvalue problem (cf. Gill & Clarke Reference Gill and Clarke1974)
 \begin{equation} \frac{\partial^2 \varPhi_n}{\partial z^2} + \frac{N^2}{c_n^2}\varPhi_n=0,\quad \text{with}\ \varPhi_n(\boldsymbol{x},0)=\varPhi_n(\boldsymbol{x},-H)=0, \end{equation}
with  $c_n$ being the eigenspeed, and
 \begin{equation} \phi_n(\boldsymbol{x},z)\equiv \frac{\partial \varPhi_n(\boldsymbol{x},z)}{\partial z}. \end{equation}
For  $n=0$, we define the barotropic mode (mode-
 $0$) to be
 $\varPhi _0=0$ and
 $\phi _0$ as a non-zero constant (with values to be determined by specific normalization), satisfying the vertical dependence of the barotropic tidal flow. Under these definitions, the eigenfunctions
 $\varPhi _n(\boldsymbol {x},z)$ and
 $\phi _n(\boldsymbol {x},z)$ are both orthogonal at each location
 $\boldsymbol {x}$, and the boundary conditions in (2.6) are satisfied. We further choose a normalization
 $$\begin{gather} \int_{{-}H}^0 N^2 \varPhi_m \varPhi_n \, \textrm{d} z = c_n^2 \delta_{mn},\quad n \geq 1, \end{gather}$$
 $$\begin{gather}\int_{{-}H}^0 \phi_m \phi_n \, \textrm{d} z = \delta_{mn}, \end{gather}$$
where  $\delta _{mn}$ is the Kronecker delta function. We note that the normalization used in (2.10) differs from that in Kelly & Lermusiaux (Reference Kelly and Lermusiaux2016) by a factor of
 $H$. This simplifies the form of the CTE when the co-varying features of the background fields are considered.
The momentum and pressure CTEs can then be derived by projecting (2.4) onto the vertical modes (2.7), (2.8) and (2.9). Due to the simultaneous consideration of mean flow in (2.4) and horizontally varying topography and buoyancy in (2.7), new three-way interaction terms can be expected, in contrast to the separate treatment in Kelly & Lermusiaux (Reference Kelly and Lermusiaux2016). Specifically, we depth integrate the product of (2.4a) with  $\phi _n$, and the product of (2.4d) with
 $\varPhi _n$. From (2.4b) and (2.4c),
 $p_n$ is related to
 $b_n$, and
 $w_n$ to
 $u_n$ (where integration by parts and Leibniz's rule are used, see Kelly et al. Reference Kelly, Lermusiaux, Duda and Haley2016), and the projections of (2.4a) and (2.4d) lead to the CTEs
 \begin{align} & \frac{\partial \boldsymbol{u}_n}{\partial t} + \sum_{m=0}^{\infty} \left[ (\boldsymbol{U}_{nm}\boldsymbol{\cdot}\boldsymbol{\nabla} + C_{nm} - W_{nm})\boldsymbol{u}_m + \boldsymbol{u}_m \boldsymbol{\cdot} \boldsymbol{\mathcal{U}}^g_{nm} + \left(\sum_{l=0}^{\infty}\boldsymbol{u}_l\boldsymbol{\cdot} \boldsymbol{T}_{ml}-\boldsymbol{\nabla}\boldsymbol{\cdot}\boldsymbol{u}_m\right)\boldsymbol{U}^z_{nm} \right] \nonumber\\ &\quad + \boldsymbol{f}\times\boldsymbol{u}_n ={-}\frac{1}{\rho_0} \left(\boldsymbol{\nabla} p_n + \sum_{m=0}^{\infty} p_m\boldsymbol{T}_{mn}\right), \end{align}
and
 \begin{align} &\frac{\partial p_n}{\partial t} + \sum_{m=0}^{\infty} \left[ (\boldsymbol{U}^p_{nm} \boldsymbol{\cdot} \boldsymbol{\nabla} + C^p_{nm} + W^p_{nm})p_m - \rho_0\boldsymbol{u}_m\boldsymbol{\cdot} \boldsymbol{B}_{nm} \right]\nonumber\\ &\quad ={-}\rho_0 c_n^2 \boldsymbol{\nabla}\boldsymbol{\cdot} \boldsymbol{u}_n + \rho_0c_n^2\sum_{m=0}^{\infty} \boldsymbol{u}_m \boldsymbol{\cdot} \boldsymbol{T}_{nm}, \end{align}
where the momentum mode-coupling coefficients are defined as
 $$\begin{gather} \boldsymbol{U}_{nm}=\int_{{-}H}^0 \boldsymbol{U} \phi_m \phi_n \, \textrm{d} z, \end{gather}$$
 $$\begin{gather}\text{(*)}\quad C_{nm}=\int_{{-}H}^0 \boldsymbol{U} \boldsymbol{\cdot} \boldsymbol{\nabla} \phi_m \phi_n \, \textrm{d} z, \end{gather}$$
 $$\begin{gather}W_{nm}=\int_{{-}H}^0 \frac{N^2}{c_m^2} W\varPhi_m \phi_n \, \textrm{d} z, \end{gather}$$
 $$\begin{gather}{\boldsymbol{\mathcal{U}}}^g_{nm} = \int_{{-}H}^0 \boldsymbol{\nabla}\boldsymbol{U} \phi_m \phi_n \, \textrm{d} z, \end{gather}$$
 $$\begin{gather}\boldsymbol{U}^z_{nm} = \int_{{-}H}^0 \frac{\partial \boldsymbol{U}}{\partial z} \varPhi_m \phi_n \, \textrm{d} z, \end{gather}$$
 $$\begin{gather}\boldsymbol{T}_{nm}=\int_{{-}H}^0\phi_m\boldsymbol{\nabla}\phi_n \, \textrm{d} z, \end{gather}$$
 $$\begin{gather}\boldsymbol{U}^p_{nm} = \int_{{-}H}^0 \boldsymbol{U} \frac{N^2}{c_m^2} \varPhi_m \varPhi_n \, \textrm{d} z, \end{gather}$$
 $$\begin{gather}\text{(*)}\quad C^p_{nm} = \int_{{-}H}^0 \frac{\boldsymbol{U}}{c_m^2} \boldsymbol{\cdot} \boldsymbol{\nabla} (N^2\varPhi_m)\varPhi_n \, \textrm{d} z, \end{gather}$$
 $$\begin{gather}W^p_{nm} = \int_{{-}H}^0 \frac{W}{c_m^2} \frac{\partial}{\partial z}(N^2\varPhi_m)\varPhi_n \, \textrm{d} z, \end{gather}$$
 $$\begin{gather}\boldsymbol{B}_{nm} = \int_{{-}H}^0 \boldsymbol{\nabla} B \phi_m \varPhi_n \, \textrm{d} z, \end{gather}$$
and where we denoted the new three-way interaction terms with a ( $*$). In (2.12), we use symbols
 $\boldsymbol {U}$ and
 $W$ (with subscript) to represent the coupling due to mean flow,
 $\boldsymbol {B}$ the coupling due to (only) horizontal buoyancy gradient,
 $\boldsymbol {T}$ the coupling due to horizontally varying topography and buoyancy and
 $C$ the coupling due to the co-existent mean flow and horizontally varying topography and buoyancy. The terms of
 $C$ (arising from the three-way co-existent mean flow and horizontal variation of basis functions) were not considered in Kelly & Lermusiaux (Reference Kelly and Lermusiaux2016) and Kelly et al. (Reference Kelly, Lermusiaux, Duda and Haley2016), due to the separate treatment of the mean flow and topographic coupling. In addition, the modal
 $W$ term, resulting from the vertical mean velocity, is kept for the completeness of the present derivation. The effects of
 $C$ in modelling the interaction of ITs with the co-existent background features are showcased in § 3.
2.3. Modal energy CTE
We define the modal energy density  $E_n$ as the (tidally averaged) energy of mode
 $n$ per surface area. By computing
 $E_n$ as the depth integration of the kinetic energy and available potential energy (e.g. Kang & Fringer Reference Kang and Fringer2010), we obtain
 \begin{equation} E_n=\frac{1}{2}\rho_0 \langle |\boldsymbol{u}_n|^2 \rangle + \frac{1}{2} \,\frac{\langle \,p_n^2\rangle} {\rho_0 c_n^2}, \end{equation}
where the angle brackets denote the time average over a tidal period. The evolution equation of  $E_n$ can be obtained by summing the averaged results of the product of (2.11a) with
 $\rho _0\boldsymbol {u}_n$ and the product of (2.11b) with
 $p_n/(\rho _0c_n^2)$. This gives
 \begin{equation} \frac{\partial E_n}{\partial t} + \boldsymbol{\nabla} \boldsymbol{\cdot} F_n = A_n + R_n + TC_n, \end{equation}
where
 \begin{equation} F_n = \langle \,p_n \boldsymbol{u}_n \rangle, \end{equation}
is the modal energy flux,
 \begin{align} A_n
&={-} \sum_{m=0}^{\infty} \left[ \vphantom{\frac{1}{\rho_0c_n^2}}\rho_0
(\langle\boldsymbol{U}_{nm}\boldsymbol{\cdot}\boldsymbol{\nabla}\boldsymbol{u}_m\boldsymbol{\cdot}\boldsymbol{u}_n
\rangle - W_{nm}\langle \boldsymbol{u}_m \boldsymbol{\cdot}
\boldsymbol{u}_n \rangle)\right.\notag\\
&\quad +\left. \frac{1}{\rho_0c_n^2}
(\langle\boldsymbol{U}^p_{nm} \boldsymbol{\cdot}
\boldsymbol{\nabla} p_m p_n\rangle + W^p_{nm} \langle \,p_m
p_n \rangle) \right],
\end{align}
is the advection of modal energy by the mean flow and
 \begin{equation} R_n ={-} \sum_{m=0}^{\infty} \left[ \rho_0 \left( \langle \boldsymbol{u}_m \boldsymbol{\cdot} \boldsymbol{\mathcal{U}}^g_{nm}\boldsymbol{\cdot} \boldsymbol{u}_n \rangle - \langle (\boldsymbol{\nabla}\boldsymbol{\cdot}\boldsymbol{u}_m) \boldsymbol{u}_n \rangle \boldsymbol{\cdot} \boldsymbol{U}^z_{nm} \right) - \frac{\langle \,p_n\boldsymbol{u}_m \rangle}{c_n^2} \boldsymbol{\cdot} \boldsymbol{B}_{nm} \right], \end{equation}
represents the rate of energy exchange between the tidal flow and the varying background mean flow and buoyancy fields. In  $R_n$, the first two terms (shear production) describe the rate of work done by the radiation stress (Longuet-Higgins & Stewart Reference Longuet-Higgins and Stewart1960, Reference Longuet-Higgins and Stewart1961) of the tidal flow on the strain of the mean flow, and the last term (buoyancy production) represents the rate of work done by the buoyancy flux of the tidal flow on the background density variation. Finally,
 \begin{align} TC_n &={-} \sum_{m=0}^{\infty} \left[ \underbrace{\rho_0 C_{nm} \langle \boldsymbol{u}_m \boldsymbol{\cdot} \boldsymbol{u}_n \rangle + \frac{1}{\rho_0c_n^2} C^p_{nm} \langle \,p_m p_n \rangle}_{\text{new three-way terms}} + \langle \,p_m\boldsymbol{u}_n \rangle \boldsymbol{\cdot} \boldsymbol{T}_{mn} - \langle \,p_n \boldsymbol{u}_m \rangle \boldsymbol{\cdot} \boldsymbol{T}_{nm} \right.\nonumber\\ &\quad +\left. \rho_0 \left\langle \left(\sum_{l=0}^{\infty}\boldsymbol{u}_l\boldsymbol{\cdot}\boldsymbol{T}_{ml}\right) \boldsymbol{u}_n \right\rangle \boldsymbol{\cdot} \boldsymbol{U}^z_{nm} \right], \end{align}
is the modal conversion due to the heterogeneous ocean background, including mean flow and horizontally varying buoyancy and topography. The presence of  $TC_n$ is purely due to the heterogeneous background, excluding the physical effects incorporated in
 $A_n$ and
 $R_n$. The new three-way terms in (2.18) are the effects of co-existent background features, arising from (2.12b) and (2.12h). We also provide a dimensional analysis of the modal energy CTE terms in Appendix B.
3. Analysis of IT interactions using the generalized CTE
In this section, we apply the CTE of § 2 to analyse the results from PE simulations. In § 3.1 we examine a series of idealized simulations, varying the background flow, topographic slope and background vertical density gradient. In § 3.2, we analyse a data-driven simulation off the east coast of the USA. Finally, in § 3.3, we analyse a data-driven simulation in the western Pacific with flow impinging on a steep island ridge. For all of these analyses, we employ 25 vertical modes in the evaluation of the CTE terms.
3.1. Idealized test cases and CTE validation
We consider a series of idealized two-dimensional cases (table 1 and figure 1) of the generation of IT at a shelfbreak region affected by a surface current (which can be caused by wind stress). These test cases extend the idealized test of Zhang & Duda (Reference Zhang and Duda2013). The modelling domain has a size of  $61 \times 225$ km with 500 m horizontal resolution and 100 terrain-following coordinates in the vertical. The baseline topography is the hyperbolic tangent portion of that in Zhang & Duda (Reference Zhang and Duda2013) (we eliminate the initial linear term since we consider an open plateau instead of a closed coastal endpoint). The baseline background density is a horizontally uniform profile corresponding to a summertime climatology in the Middle Atlantic Bight region (Lermusiaux & Robinson Reference Lermusiaux and Robinson1999; Zhang et al. Reference Zhang, Gawarkiewicz, McGillicuddy and Wilkin2011; Zhang & Duda Reference Zhang and Duda2013). The baseline background velocity is a southward flow confined to the upper 90 m, with a quartic velocity profile that goes from 50 cm s
 $^{-1}$ at the surface to 0 cm s
 $^{-1}$ at 90 m. The background features of the baseline simulation are shown in figure 1(a). We force the idealized cases with barotropic tides at the
 $M_2$-frequency. We obtain the barotropic tides by solving a simplified one-dimensional tidal model where we assume the surface elevation uniformly moves up and down with an amplitude of 0.5 m. The resulting velocities have an amplitude that varies between 0.25 and 5.5 cm s
 $^{-1}$. With these small tidal velocities, the linearization made in (2.4) is adequate. We initialize the test case with a superposition of the background state and the barotropic tides. At the open boundaries we apply a combination of the superposition of the background and tidal fields with radiative corrections. The (baroclinic) ITs are generated at the shelfbreak region, with the influence of the surface current, which then propagates to both the deep and shallow water regions. The simulation is performed using the PE model of Multidisciplinary Simulation, Estimation and Assimilation Systems (MSEAS-PE; Haley & Lermusiaux Reference Haley and Lermusiaux2010; Haley, Agarwal & Lermusiaux Reference Haley, Agarwal and Lermusiaux2015) until a stationary IT field is developed (with
 $\partial E_n/ \partial t=0$). For the remaining idealized test cases, we vary the background fields. We multiply the background velocity by factors of 2,
 $-$1 and
 $-$2 (i.e. reversing the flow). We also consider a case with local velocity profiles that extend to the bottom (
 $H$). The maximum velocity over the shelf is set to 200 cm s
 $^{-1}$ northward at the surface with zero at the bottom. Over deeper regions the maximum velocity is set to match the transport over the 90 m depths (figure 1b). We also take the case with the southward flow in the upper 90 m and 100 cm s
 $^{-1}$ maximum, and increase/decrease the topographic slope by a factor of 2 (white lines in figure 1a). Lastly, we take this southward flow case and increase/decrease the vertical gradient of the density profile by a factor of 2 (figure 1c).
The computational domain and background features for the various idealized cases. (a) The topography (brown) and background density (colour map) with background velocity (arrows) for most of the test cases. Cases 1–4 have peak velocities of 50 cm s $^{-1}$, 100 cm s
 $^{-1}$,
 $-$50 cm s
 $^{-1}$ and
 $-$100 cm s
 $^{-1}$, respectively. Also shown are the steeper topography (white dash-dot line) and less steep topography (white dotted line). (b) The topography and background velocity magnitude (colour map) and direction (arrows) for the cases with velocity extending to the local bottom. Note that the background flow is such that the transport is maintained. (c) The different density profiles used.

The parameter space for the idealized experiments. The baseline topography and density profile refer to those used in Zhang & Duda (Reference Zhang and Duda2013).

The purpose of this idealized analysis is to test the validity of the CTE (2.11), and in particular, to illustrate the effect of the new terms  $C_{nm}$ and
 $C^p_{nm}$ in regions with co-existent mean flow and topography variation. For this purpose, we re-group terms in (2.11) as
 $RD_{\boldsymbol {u}}=MC_{\boldsymbol {u}}$ and
 $RD_p=MC_p$, where
 $RD$ represents the remainder of the traditional terms (e.g. Cushman-Roisin & Beckers Reference Cushman-Roisin and Beckers2011) of modal IT propagating in a quiescent background, and
 $MC$ represents mode-coupling terms due to the interaction with the background
 \begin{gather} RD_{\boldsymbol u}={-}\frac{\partial \boldsymbol{u}_n}{\partial t} - \boldsymbol{f}\times\boldsymbol{u}_n - \frac{1}{\rho_0} \boldsymbol{\nabla} p_n, \end{gather}
 \begin{gather} MC_{\boldsymbol u}= \sum_{m=0}^{\infty} \left[\vphantom{\sum_{l=0}^{\infty}} (\boldsymbol{U}_{nm}\boldsymbol{\cdot}\boldsymbol{\nabla} + C_{nm} - W_{nm})\boldsymbol{u}_m + \boldsymbol{u}_m \boldsymbol{\cdot} \boldsymbol{\mathcal{U}}^g_{nm}\right. \nonumber\\ \qquad\qquad\qquad + \left.\left(\sum_{l=0}^{\infty}\boldsymbol{u}_l\boldsymbol{\cdot} \boldsymbol{T}_{ml}-\boldsymbol{\nabla}\boldsymbol{\cdot}\boldsymbol{u}_m\right)\boldsymbol{U}^z_{nm} + \frac{1}{\rho_0} p_m\boldsymbol{T}_{mn} \right], \end{gather}
 $$\begin{gather} RD_p={-}\frac{\partial p_n}{\partial t}-\rho_0 c_n^2 \boldsymbol{\nabla}\boldsymbol{\cdot} \boldsymbol{u}_n, \end{gather}$$
 $$\begin{gather}MC_p=\sum_{m=0}^{\infty} \left[ (\boldsymbol{U}^p_{nm} \boldsymbol{\cdot} \boldsymbol{\nabla} + C^p_{nm} + W^p_{nm})p_m - \rho_0\boldsymbol{u}_m\boldsymbol{\cdot} \boldsymbol{B}_{nm} - \rho_0c_n^2 \boldsymbol{u}_m \boldsymbol{\cdot} \boldsymbol{T}_{nm} \right]. \end{gather}$$
The  $M_2$-frequency Fourier coefficients of
 $RD_{\boldsymbol {u}_1,p_1}(x)$ and
 $MC_{\boldsymbol {u}_1,p_1}(x)$ of the mode-1 IT (at an arbitrary phase) are plotted in figure 2. It is clear that the mode-coupling terms
 $MC$ account for the remainders of the traditional terms
 $RD$, showing the effectiveness of CTE in describing the interaction of ITs with both the mean flow and topography variation. The oscillations of the curves at
 $x<90$ km correspond to the wavelength of the generated ITs at the shelfbreak which propagates towards the shallow water region.
Comparisons of the  $M_2$-frequency Fourier coefficients (at an arbitrary phase) of (a)
 $RD_{u_1}(x)$ and
 $MC_{u_1}(x)$ (with and without three-way interaction terms) and (b)
 $RD_{p_1}(x)$ and
 $MC_{p_1}(x)$ (with and without three-way interaction terms). The regions near the two boundaries, affected by the numerical sponge layer model, are not plotted.

The magnitude of the new terms  $C_{nm}$ (2.12b) and
 $C^p_{nm}$ (2.12h) is quantified by comparison to that of terms in (2.11) (to obtain the non-dimensional ratio). This shows that the new terms are important when both the topography variation and mean flow are significant. To illustrate this, we define a relative error
 $\tilde {\mathcal {E}}_{\boldsymbol {u}_1,p_1}\equiv |RD_{\boldsymbol {u}_1,p_1}-MC_{\boldsymbol {u}_1,p_1}| / |RD_{\boldsymbol {u}_1,p_1}|$. The value of
 $\tilde {\mathcal {E}}_{\boldsymbol {u}_1,p_1}$ is evaluated in the region (depth over
 $200\ \textrm {m} \sim 800\ \textrm {m}$) with both significant topography variation and mean flow. The mean and maximum values of
 $\tilde {\mathcal {E}}_{\boldsymbol {u}_1,p_1}$ are listed in table 2, obtained with and without terms
 $C_{nm}$ and
 $C^p_{nm}$ in
 $MC_{\boldsymbol {u}_1,p_1}$. It shows that including the new terms reduces the error and thus enhances the accuracy of CTE with co-existent background features.
Relative error  $\tilde {\mathcal {E}}_{u_1,p_1}$ in the region (depth over
 $200\ \textrm {m} \sim 800\ \textrm {m}$) with both significant topography variation and mean flow.

In figure 3, we examine the modal energy CTE budget (W m $^{-2}$) of the mode-1 IT for the idealized test cases presented in figure 1. We start with the case of the background flow consisting of a southward velocity confined to the upper 90 m with a maximum of 50 cm s
 $^{-1}$ and the standard background slope and density gradient (figure 3a). We notice that overall,
 $\boldsymbol {\nabla } \boldsymbol {\cdot } F_1, A_1$ and
 $TC_1$ are all approximately the same magnitude, with
 $\boldsymbol {\nabla } \boldsymbol {\cdot } F_1$ and
 $TC_1$ balancing over the topographic slope and
 $\boldsymbol {\nabla } \boldsymbol {\cdot } F_1$ and
 $A_1$ balancing away from the slope. Over the slope, the new three-way interaction terms largely balance the local contributions from
 $A_1$ and contribute on average 15 % to
 $TC_1$, with peak values of 38 %. If we increase the maximum background velocity to 100 cm s
 $^{-1}$ (figure 3b), we see that, over the slope,
 $\boldsymbol {\nabla } \boldsymbol {\cdot } F_1$ remains approximately the same as the previous case, while
 $TC_1, A_1$ and the contributions from the three-way interactions all increase, as expected from the dimensional analysis. The three-way interactions still balance
 $A_1$ over the slope but now can account for an average of 22 % of
 $TC_1$, with peak values of 66 %–100 %. On the shelf,
 $\boldsymbol {\nabla } \boldsymbol {\cdot } F_1$ and
 $A_1$ still largely balance. In this region, the three-way interactions can account for a higher fraction of
 $TC_1$. We next consider the effects of reversing the background flow. Figure 3(c) shows the case of a northward background flow confined to the upper 90 m with a maximum of 50 cm s
 $^{-1}$. All the contributions away from the main slope are greatly attenuated. Over the slope,
 $\boldsymbol {\nabla } \boldsymbol {\cdot } F_1$ and
 $TC_1$ remain largely in balance, although the extreme peaks of
 $TC_1$ can be 50 % smaller than in the southward case. Here,
 $A_1$ and the three-way terms remain in approximate balance. The average contribution of the three-way terms is 18 % of
 $TC_1$, with peaks of 40 %–50 %. Increasing the maximum background flow to 100 cm s
 $^{-1}$ brings back some of the
 $\boldsymbol {\nabla } \boldsymbol {\cdot } F_1$ and
 $A_1$ contributions on the shelf, figure 3(d). Over the slope,
 $\boldsymbol {\nabla } \boldsymbol {\cdot } F_1$ remains approximately the same, while
 $A_1$ and the three-way terms increase (again, consistent with our dimensional analysis). Here,
 $A_1$ and
 $TC_1$ oscillate in space and either one or the other approximately balances
 $\boldsymbol {\nabla } \boldsymbol {\cdot } F_1$, depending on the location. In this test case, the new three-way interaction terms on average account for 48 % of
 $TC_1$, with peaks of 100 %. For the last background velocity test, we have a northward velocity throughout the entire water column. Over the shelf, the maximum velocity is 200 cm s
 $^{-1}$, the local maximum velocity decreases with the total water depth to maintain a constant transport, figure 3(e). The modal energy is decreased everywhere, largely driven by the greatly decreased background velocity over most of the slope where
 $TC_1$ dominates
 $\boldsymbol {\nabla } \boldsymbol {\cdot } F_1$ and
 $A_1$. We also notice that the three-way interactions account for 98 % of
 $TC_1$ on average. The next pair of tests explore the effects of varying the topographic slope. In figure 3( f), we see the effects of increasing the slope by a factor of two compared to the case in figure 3(b). We see that modal energy is increased for all terms. The contributions from
 $TC_1$ tend to dominate the other terms. The contributions from the three-way terms approximately balance
 $A_1$ and contribute 36 % to
 $TC_1$, with peaks of 52 %. Decreasing the topographic slope by a factor 2 decreases the modal energy, figure 3(g) for all terms. We see that modal energy is reduced for all terms. Over the slope, the contributions from
 $TC_1$ dominate the modal energy CTE budget with the three-way interaction contributing an average of 63 % to
 $TC_1$ with peaks of 100 %. On the shelf away from the slope,
 $\boldsymbol{\nabla} \boldsymbol{\cdot}F_1$ and
 $A_1$ tend to be the main contributors. The contributions of the three-way terms to
 $TC_1$ are much more variable and span the range 0 %–100 % of
 $TC_1$. The last pair of cases explore the effects of varying the vertical gradient of the background density profile. Increasing the density gradient increases
 $\boldsymbol {\nabla } \boldsymbol {\cdot } F_1, A_1$, and
 $TC_1$ by 50 %–100 % (figure 3h). The three-way terms generally experience less of an increase, contributing on average 20 % to
 $TC_1$, with peaks of 90 %. Overall, the relative importance of the three-way terms is slightly decreased by the increased density gradient. This is consistent with the dimensional analysis which had a small factor multiplying the three-way terms scaled by by
 $N^2$. Lastly decreasing the vertical gradient of the background density profile decreases
 $\boldsymbol {\nabla } \boldsymbol {\cdot } F_1, A_1$, and
 $TC_1$ (figure 3i). The three-way terms now contribute 32 % of
 $TC_1$ on average, with peaks of 100 %, leading to a slight increase in the relative importance of the three-way terms.
The modal energy CTE budget (W m $^{-2}$) of the mode-1 IT for several idealized test cases. (a) Southward velocity confined to upper 90 m (
 $V_{max}=50$ cm s
 $^{-1}$); (b) southward velocity confined to upper 90 m (
 $V_{max}=100$ cm s
 $^{-1}$); (c) northward velocity confined to upper 90 m (
 $V_{max}=50$ cm s
 $^{-1}$); (d) northward velocity confined to upper 90 m (
 $V_{max}=100$ cm s
 $^{-1}$); (e) northward velocity in entire water column (constant transport,
 $V_{max}$=200 cm s
 $^{-1}$ on the shelf); ( f) as in (b) but topographic slope increased by a factor of 2; (g) as in (b) but topographic slope decreased by a factor of 2; (h) as in (b) but
 ${\partial \rho }/{\partial z}$ increased by a factor of 2; (i) as in (b) but
 ${\partial \rho }/{\partial z}$ decreased by a factor of 2.

3.2. Middle Atlantic Bight region
We now study the IT dynamics including three-way interactions in the Middle Atlantic Bight (MAB) region ( $\sim 39^\circ \textrm {N}, 73^\circ W$). It consists of a broad shelf with strong tides, near-inertial wave activity, significant freshwater influences, a shelfbreak with a front, a slope to a strong western boundary current, the Gulf Stream and a recirculating deep western boundary current (e.g. Beardsley, Boicourt & Hansen Reference Beardsley, Boicourt and Hansen1976). The Gulf Stream sheds warm-core rings that can interact with the shelf and shelfbreak front. Additional topographic interactions occur at the Hudson Canyon (and lesser canyons). The MAB is also impacted by tropical storms (Gangopadhyay, Robinson & Arango Reference Gangopadhyay, Robinson and Arango1997; Tang et al. Reference Tang2007, and references therein).
Our MAB ocean re-analysis has its origin in the Shallow Water 2006 (SW06) and Autonomous Wide Aperture Cluster for Surveillance (AWACS) 2006 experiments (Tang et al. Reference Tang2007; Chapman & Lynch Reference Chapman and Lynch2010). During those experiments, real-time MSEAS-PE forecasts were issued (Lermusiaux et al. Reference Lermusiaux, Haley, Leslie, Logoutov and Robinson2006; Haley & Lermusiaux Reference Haley and Lermusiaux2010; Lin et al. Reference Lin, Newhall, Duda, Lermusiaux and Haley2010; Colin et al. Reference Colin2013) assimilating real-time data (Newhall et al. Reference Newhall2007; Lynch & Tang Reference Lynch and Tang2008; Colosi et al. Reference Colosi, Duda, Lin, Lynch, Newhall and Cornuelle2012). Following the experiments, a series of over 1400 re-analyses were completed, culminating in an ocean re-analysis for the period 14 August 2006 to 24 September 2006 using the MSEAS-PE with data assimilation. The details of the simulation can be found in Appendix A.1. The computational domain and topography are shown in figure 4(a). The mean surface flow for a 62 h period and an instantaneous surface flow are shown in figure 4(b) and figure 4(c). The ITs are mainly generated as the barotropic tidal flow sloshes the sloping topography around the continental shelfbreak (depth 80 to 2000 m), locally interacting with the shelfbreak front. The generated ITs interact on the deep side with the Gulf Stream and the horizontal buoyancy gradient (not shown) as they propagate through slowly varying topography (depth  $2000 \sim 4000\ \textrm {m}$). On the shelf, they also interact with the shelf currents, buoyancy field and slowly varying topography.
Middle Atlantic Bight region. (a) The computational domain, with the bathymetry (m) indicated by coloured contour levels; (b) 62 h averaged surface velocity during a modal IT analysis period (2100Z 6 September 2006 to 1000Z 9 September 2006); (c) instantaneous surface velocity at maximum tides (0900Z 8 September 2006). Velocity magnitude shown is limited to 75 cm s $^{-1}$.

The energy budget of the mode-1 IT, as formulated in (2.14), is computed from the MSEAS-PE re-analysis simulation and illustrated in figure 5 for a 62 h period of very strong spring tides (2100Z 6 September 2006 to 1000Z 9 September 2006, see background fields in figure 4). This region is similar to the baseline idealized case. The background density profile is a close match and, away from the Gulf Stream, the background velocity is surface intensified in the upper 100 m. Over the upper slope (near the shelfbreak front), the background velocity penetrates deeper, nearly to the bottom. We thus expect more contributions from the three-way interactions in these regions. The slope is a factor of 2–4 steeper than the baseline case, so we also expect an overall increase in the modal CTE energy. The positive values of the divergence of the mode-1 energy flux  $\boldsymbol {\nabla }\boldsymbol {\cdot } F_1$ (figure 5a) on the continental shelfbreak indicate a significant generation of ITs (affected by the shelfbreak front). This generation is mainly explained by the topography–buoyancy part of the modal conversion
 $TC_1$ (figure 5d). The three-way interactions with the mean flow and topography (figure 5e) are smaller at most locations. However, at local hot spots where both topographic variation and mean flow are significant (e.g. at the shelfbreak, near
 $38.5^\circ \textrm {N}, 73.5^\circ W$, as can be observed in figures 4 and 5e), during this strong tidal period, we find that the three-way interaction terms account for 10 %–30 % of the term
 $TC_1$ (the three-way interaction is then the major interaction in this region).
The modal energy CTE budget (W m $^{-2}$) of the mode-1 IT in the Middle Atlantic Bight region for the 62 h analysis period 2100Z 6 September 2006 to 1000Z 9 September 2006 (figure 4): (a)
 $\boldsymbol {\nabla }\boldsymbol {\cdot } F_1$; (b)
 $A_1$; (c)
 $R_1$; (d)
 $TC_1$ and (e) new three-way contributions to
 $TC_1$.

The interactions are also significant in the Gulf Stream region. The divergence of the mode-1 energy flux  $\boldsymbol {\nabla }\boldsymbol {\cdot } F_1$ is there mainly balanced by the advection of the mode-1 energy by the mean flow
 $A_1$ (figure 5b) and, to a lesser extent, by energy exchanges between mode-1 IT and variable background fields
 $R_1$, i.e. the shear (varying mean flow) and buoyancy (varying density) production terms (figure 5c), and by modal conversions with topography
 $TC_1$, mostly involving two-way terms (figure 5d). However, we find that, in local hot spots, the new three-way interaction terms (figure 5e) contribute at least 50 % to
 $TC_1$ in the Gulf Stream. On the shelf, inshore of the shelfbreak, we observe that the dominant contributions to the divergence of mode-1 energy flux
 $\boldsymbol {\nabla }\boldsymbol {\cdot } F_1$ come from the combined energy exchanges due to shear and buoyancy productions
 $R_1$ and from the two-way part of the modal conversion
 $TC_1$.
We have also compared the non-dimensional groups of the three-way term ((B8) and subsequent text) to figure 5(e). The leading-order group,  $Ro\, f T$, does predict the strong contributions along the shelfbreak and the weaker contributions in the Gulf Stream. It also captures processes unrelated to the semi-diurnal ITs.
3.3. Palau Island region
We now study the IT dynamics with three-way interactions in the Palau Island region ( $\sim 7.5^\circ \textrm {N}, 134.6^\circ \textrm {E}$). It consists of an island chain with narrow shelves and tides and a ridge with steep topography to the deep ocean with eddy fields and broad currents. The Palau archipelago (figure 6a) sits atop a plateau
 $O(50\ \textrm {m})$ along the Kyushu-Palau ridge with a deep trench
 $O(8000\ \textrm {m})$ to the southeast. The surrounding abyssal plain is
 $O(4500\ \textrm {m})$ deep. Across the southern boundary of the domain, the North Equatorial Counter Current (NECC) flows to the east. North of the domain, the North Equatorial Current (NEC) flows to the west. Between these two, a surface flow impinges on the archipelago from the southeast and flows around and over the plateau to the northwest, generating vorticity and eddies (figure 6c). The ITs are generated mainly along the ridge, and they propagate both westward and eastward, interacting with the currents and the varying topography. Additionally, flow separation, wake eddies and lee waves are generated as the currents flow around the islands and over the ridge. These wake processes are now known to have significant impacts on the overall energy budget and to enhance local mixing and potentially the transport of mass and nutrients. These interactions occur over a wide range of scales, from the
 $O(1000\ \textrm {km})$ scale of the NEC and NECC, through wake eddies on the scale of Palau island
 $O(100\ \textrm {km})$, submesoscales
 $O(10\ \textrm {km})$, tidally influenced wake eddies
 $O(1\ \textrm {km})$ and all the way to turbulent scales
 $O(\textrm {mm})$ (Johnston et al. Reference Johnston2019a,Reference Johnstonb; MacKinnon et al. Reference MacKinnon, Alford, Voet, Zeiden, Shaun Johnston, Siegelman, Merrifield and Merrifield2019, and references therein).
Palau Island region. (a) The computational domain, with the bathymetry (m) indicated by coloured contour levels; (b) 62 h averaged surface velocity (magnitude shown is limited to 75 cm s $^{-1}$) during a modal IT analysis period (0900Z 17 May 2015 to 2200Z 19 May 19 2015); (c) instantaneous snapshot of the relative vorticity field at 2 m depth on 1200Z 19 May 2015.

The FLow Encountering Abrupt Topography (FLEAT; Johnston et al. Reference Johnston2019b) program was created to improve our understanding of the above interactions. As part of FLEAT, a large number of simulations were completed, leading to an ocean re-analysis for the Palau Island region from 8–19 May 2015, using the data-assimilative MSEAS-PE modelling system. The simulation set-up and methodology are provided in Appendix A.2. The computational domain is shown in figure 6(a). The mean surface flow for a 62 h period and an instantaneous relative vorticity field at 2 m, shown in figures 6(b) and 6(c), clearly indicates the main currents and the eddies of multiple scale.
The energy budget of the mode-1 IT, as formulated in (2.14), is computed from the MSEAS-PE re-analysis simulation and illustrated in figure 7 for a 62 h period during the spring tides (0900Z 17 May 2015 to 2200Z 19 May 2015, see background fields in figure 6). This region is somewhat similar to the baseline idealized case. The vertical gradient background density profile has a similar magnitude although the main pycnocline is a bit broader. The background velocity is surface intensified in the upper 150 m, with deeper extensions near the ridge. The topography is significantly steeper (in places a factor of 10 steeper). We thus expect contributions from the three-way interactions to be more confined to the ridge areas with deeper velocity penetration. And we expect an overall increase in the modal CTE energy over the baseline case. The positive value of  $\boldsymbol {\nabla }\boldsymbol {\cdot } F_1$ along the ridge shows the significant generation of mode-1 IT at a rate of
 $O(40\ \textrm {mW}\ \textrm {m}^{-2})$. The negative value of
 $\boldsymbol {\nabla }\boldsymbol {\cdot } F_1$ occurs mainly at the edge of the trench as the IT propagates toward a shallower region, indicating a reduction in modal energy flux in the propagation direction. In the vicinity of the ridge, we find that the divergence of the mode-1 energy flux
 $\boldsymbol {\nabla }\boldsymbol {\cdot } F_1$ (figure 7a) is largely balanced by modal conversions due to the heterogeneous ocean background
 $TC_1$ (figure 7d), mostly here due to two-way terms involving the horizontally varying buoyancy and topography, and the vertical gradients of the mean flow. The new three-way interactions (figure 7e) locally account for approximately 10 %–20 % of the total topography-linked modal conversion (
 $TC_1$) around regions of steep topography and relatively strong mean flow (strong horizontal shear in topography or buoyancy), with
 $TC_1$ being a significant contributor to the energy budget. As we found in the MAB case, the non-dimensional group of the leading-order three-way term, i.e.
 $Ro \, f T$, see (B8) and subsequent text, does predict the main contributions of the three-way terms but also captures processes unrelated to the semi-diurnal ITs.
The modal energy CTE budget (W m $^{-2}$) of mode-1 IT in the Palau island region: (a)
 $\boldsymbol {\nabla }\boldsymbol {\cdot } F_1$; (b)
 $A_1$; (c)
 $R_1$; (d)
 $TC_1$ and (e) new three-way contributions to
 $TC_1$.

Importantly, away from the ridge, we find that the advection of the mode-1 energy by the mean flow  $A_1$ (figure 7b) typically accounts for 10 %–30 % of the divergence in the modal energy flux and locally can account for 50 % or more of this divergence. Examples of where these relatively larger advections (50 % or more of
 $\boldsymbol{\nabla}\boldsymbol{\cdot} F_1$) occur include the island-scale eddies around
 $7.75^\circ \textrm {N}, 133.3^\circ \textrm {E}$ and
 $8.25^\circ \textrm {N}, 133.9^\circ \textrm {E}$, and in the eastward flowing NECC, especially at the meander around
 $7.75^\circ \textrm {N}$, in the range
 $135^\circ \text {--} 136^\circ \textrm {E}$. Just as important in these regions is the energy exchange between the mode-1 IT and variable background fields through the shear and buoyancy production terms
 $R_1$ (figure 7c). Away from the ridge, these terms typically account for 10 %–20 % of the divergence in the modal energy flux, with local contribution of up to 50 % or more. For example, such larger exchanges (50 % or more of
 $\boldsymbol {\nabla }\boldsymbol {\cdot } F_1$) occur around the meander in the NECC and near the northernmost of the two island-scale eddies, in part because it entrains more water that upwelled in the lee of the ridge and thus enhances the buoyancy shear (not shown).
In summary, the above results clearly indicate that the interactions of ITs with island eddies, currents and buoyancy shear above steep topography can be significant. Here, they account for 10 %–30 % of the total redistribution of energy ( $\boldsymbol {\nabla }\boldsymbol {\cdot } F_1$) through the advection of mode-1 energy by the mean flow (
 $A_1$) and exchanges of mode-1 and background energy via shear and buoyancy productions (
 $R_1$). In addition, the new three-way interaction terms can locally account for 10 % of the mode-1 energy conversion (
 $TC_1$), due to interactions of mode-1 with co-existent background features over the Kyushu-Palau ridge.
4. Interaction of ITs with a large-scale current
While the CTE describes the interactions of ITs with a general heterogeneous ocean background, the dynamics can be simplified in some cases. As an example, in § 3.2, the term  $TC_1$ is dominant at the shelfbreak but less important in the Gulf Stream region (see figure 5 for details). In addition, higher modes of ITs may have a wavelength that is significantly smaller than the scale of the Gulf Stream, where the modulation of the ITs can be studied through a WKB analysis. In the following, we consider such a simplified situation where ITs interact with a large-scale barotropic current (i.e. higher-mode ITs on a mesoscale mean flow or lower-mode ITs on a large-scale mean flow). We show that the CTE can be reduced to the wave action balance equation, which yields new physical descriptions (through analytical solutions) for the refraction and focusing of ITs. We finally visualize the IT refraction by a following current in the MAB region as in § 3.2, which highlights behaviour consistent with the simplified analytical results.
4.1. Theory
We consider the interaction of ITs with a barotropic two-dimensional  $(x,y)$ steady large-scale current. Although we do not constrain the horizontal variation of the current, it can be assumed to be an f-plane geostrophic flow
 $\boldsymbol {U}=(U,V)$ given by
 \begin{equation} U(x,y)={-}\frac{1}{f\rho}\frac{\partial P}{\partial y},\quad V(x,y)=\frac{1}{f\rho}\frac{\partial P}{\partial x}. \end{equation}
Upon the further neglect of horizontal density and topographic variations, the vertical modes of ITs can be decoupled. These modes, propagating horizontally in physical space, are plane waves viewed from the scale of the IT, but their wavenumber and amplitude slowly vary on the scale of the mean flow. This suggests a description of the propagation of the modal IT using the theory of ray tracing (WKB approximation).
In the general theory, the changes of the position  $\boldsymbol {x}\equiv (x,y)$ and vector wavenumber
 $\boldsymbol {k}\equiv (k_x,k_y)$ of a wave group are obtained by purely kinematic considerations (e.g.Peregrine (Reference Peregrine1976), also refer to the consideration for modal IT in Rainville & Pinkel Reference Rainville and Pinkel2006).
 \begin{equation} \textrm{d} \boldsymbol{x}/ \textrm{d} t=\boldsymbol{c}_g+\boldsymbol{U}, \end{equation}
and
 \begin{equation} \textrm{d} k_\alpha/ \textrm{d} t={-}\boldsymbol{k}\boldsymbol{\cdot} (\partial \boldsymbol{U}/\partial x_\alpha), \end{equation}
where  $\boldsymbol {c}_g$ is the group velocity,
 $\alpha$ denotes the subscript
 $x$ or
 $y$ and
 $\textrm {d} / \textrm {d} t$ indicates the derivative along a ray.
To derive the variation of wave modal amplitude with the transport, the standard method requires the perturbation expansion of the governing equations and the solution of a solvability problem at certain order (e.g. Mei, Stiassnie & Yue Reference Mei, Stiassnie and Yue1989). We shall follow an alternative approach, by considering the modal energy (2.14) with a local plane wave solution, which correctly yields the same result as the perturbation method (Muller Reference Muller1976). To this end, we consider a modal amplitude of the IT as a plane wave in the form of  $\exp [\textrm {i}(kx-\omega t-kUt)]$ with
 $\omega$ being the intrinsic frequency, where we have rotated the
 $x$ and
 $y$ axes so that the wavenumber vector is aligned with the
 $x$ axis, i.e.
 $k_x=k$ and
 $k_y=0$. This treatment simplifies the derivation without loss of generality, as such axis can be defined locally even though the vector wavenumber slowly varies in space. All the modal amplitudes
 $\boldsymbol {u}_n=(u_n,v_n), p_n, w_n$ and
 $b_n$ can be written as local amplitude factors
 $\mathcal {U}_n, \mathcal {V}_n, \mathcal {P}_n, \mathcal {W}_n$ and
 $\mathcal {B}_n$ multiplying
 $\exp [\textrm {i}(kx-\omega t-kUt)]$, with
 \begin{equation} (\mathcal{U}_n, \mathcal{V}_n, \mathcal{P}_n, \mathcal{B}_n)=\left( \frac{i}{k}, \frac{f}{\omega k}, i\rho_0\frac{c_n^2}{\omega}, -\frac{i}{\omega} \right) \mathcal{W}_n, \end{equation}
and the modal energy
 \begin{equation} E_n=(\rho_0/k^2)\mathcal{W}_n\mathcal{W}_n^*, \end{equation}
with  $\omega , k=|\boldsymbol {k}|$ satisfying the dispersion relation
 \begin{equation} \omega^2=f^2+c_n^2 k^2. \end{equation}
Equations (4.4)–(4.6) are consistent with those obtained from (2.4) with a zero background field. This agrees with the WKB assumption that the presence of a slowly varying current does not affect the local amplitude of the wave (Muller Reference Muller1976), but only the local dispersion relation, i.e.  $\omega _a=\omega +kU$ with
 $\omega _a$ the apparent frequency. Physically, this can be thought of as the current shifting the overall solution horizontally but not affecting the structure of the IT. We note that
 $u_n$ is out of phase with both
 $v_n$ and
 $w_n$ as shown in (4.4). This indicates that the modal waves are Poincare-type waves but with the elliptical particle path inclined with respect to the horizontal plane, and with vertically varying profiles defined by (2.8) and (2.9). The modal group velocity and phase velocity can be obtained from (4.6)
 \begin{equation} \boldsymbol{c}_{g(n)}=c_n(1-f^2/\omega^2)^{1/2}\hat{\boldsymbol{k}},\quad \boldsymbol{c}_{p(n)}=c_n(1-f^2/\omega^2)^{{-}1/2}\hat{\boldsymbol{k}}, \end{equation}
where  $\hat {\boldsymbol {k}}$ is a unit vector in the direction of
 $\boldsymbol {k}$. We neglect the subscript
 $n$ of
 $c_g$ and
 $c_p$ hereafter for simplicity of presentation, but keep in mind that they are both functions of the mode number.
The evolution of modal energy is derived by substituting (4.4)–(4.6) into (2.14) and using the assumptions of negligible vertical shear of mean flow and topographic variations
 \begin{equation} \frac{\partial E_n}{\partial t}+\boldsymbol{\nabla} \boldsymbol{\cdot} [ E_n (\boldsymbol{U} + \boldsymbol{c}_g) ] + S_{xx}\frac{\partial U}{\partial x} + S_{yy}\frac{\partial V}{\partial y}=0, \end{equation}
where
 \begin{equation} S_{xx}=E_n,\ S_{yy}=E_n (\,f^2/\omega^2) \end{equation}
are the radiation stresses representing the IT-induced momentum flux. The absence of  $S_{xy}$ and
 $S_{yx}$ is a convenience due to our choice of local axis that aligns
 $U$ with the wave vector
 $\boldsymbol {k}$.
Equation (4.8) was first introduced by Longuet-Higgins & Stewart (Reference Longuet-Higgins and Stewart1960) for surface waves, and sufficiently describes the modulation of the modal energy by the current. We further define the modal wave action as the modal energy divided by the intrinsic frequency  $N_n=E_n/\omega$ (Bretherton & Garrett Reference Bretherton and Garrett1968). The evolution of
 $N_n$ is governed by
 \begin{align}
\frac{\partial N_n}{\partial t}+\boldsymbol{\nabla}
\boldsymbol{\cdot} [ N_n (\boldsymbol{U} +
\boldsymbol{c}_g) ] &= \frac{1}{\omega} \left\{
\frac{\partial E_n}{\partial t}+\boldsymbol{\nabla}
\boldsymbol{\cdot} [ E_n (\boldsymbol{U} +
\boldsymbol{c}_g) ] \right\}\notag\\
&\quad + E_n \left\{ \frac{\partial
}{\partial t}+(\boldsymbol{U} + \boldsymbol{c}_g)
\boldsymbol{\cdot} \boldsymbol{\nabla} \right\}
\frac{1}{\omega}.
\end{align}
Substituting (4.8) and (4.3) into (4.10), the source terms on the right-hand side vanish and we obtain the conservation of modal wave action
 \begin{equation} \frac{\partial N_n}{\partial t}+\boldsymbol{\nabla} \boldsymbol{\cdot} [ N_n (\boldsymbol{U} + \boldsymbol{c}_g) ] = 0. \end{equation}
Given the initial condition of the IT, its propagation and evolution in the large-scale geostrophic flow can be fully solved by (4.2), (4.3) and (4.11) (or (4.8)) for each decoupled modal component. This supplements the kinematic consideration in Rainville & Pinkel (Reference Rainville and Pinkel2006) and completes the theory for the modulation of an IT by a large-scale barotropic current.
4.2. Analytical solution of IT modulation by a collinear current
To show the usefulness of the WKB analysis and theory developed in § 4.1, we provide an example of the interaction of the IT with a collinear current  $U(x)$ in the stationary state. Since the variation of
 $U(x)$ in the
 $x$ direction is compensated by
 $V(y)$ in the
 $y$ direction, the current can be considered as a converging or diverging current symmetric to
 $y=0$, depending on the sign of
 $U$ and
 $\partial U/\partial x$. We consider two cases of IT propagating from a quiescent field into a following or opposing current, as sketched in figure 8.
IT propagating from a quiescent field into a (a) following and (b) opposing current.

The modulation of modal wavenumber of the IT can be determined from (4.3), which is equivalent to the conservation of apparent frequency,
 \begin{equation} k(c_p+U)=k_0(c_{p0}+U_0), \end{equation}
where  $c_p=\omega /k$ is the (modal) phase velocity, and subscript ‘0’ denotes a reference position in the quiescent field, i.e.
 $U_0=0$. Since
 $c_p$ and
 $k$ (also
 $c_{p0}$ and
 $k_0$) are related by (4.6), (4.12) is quadratic in
 $c_p/c_{p0}$, and has the solution
 \begin{equation} \left(\frac{f^2/k^2+c_n^2}{f^2/k_0^2+c_n^2}\right)^{1/2}= \frac{c_p}{c_{p0}}=\gamma(A-1)+\sqrt{1+\gamma^2 A(A-1)},\end{equation}
where  $\gamma \equiv U/c_{p0}$ and
 $A\equiv c_{p0}^2/c_n^2=1/(1-(\,f/\omega _0)^2)$.
The change of modal energy density of the IT can be determined from (4.11) (or (4.8)), by solving
 \begin{equation} \frac{E_n}{\omega}(U+c_g)=\frac{E_{n0}}{\omega_0}(U_0+c_{g0}). \end{equation}
This gives
 \begin{equation} \frac{E_n}{E_{n0}}=\sqrt{\frac{A-1}{A-(c_{p0}/c_p)^2}}\boldsymbol{\cdot} \frac{1}{\gamma A+c_{p0}/c_p}. \end{equation}
The change of modal amplitude can then be determined from (4.4) and (4.5).
The modulation of the modal IT by a collinear current is fully described by (4.13) and (4.15), and plotted in figure 9 for a range of  $\gamma$ and representative values of
 $|\,f/\omega _0|$. It is shown that, for
 $\gamma >0$, i.e. IT propagates into a forward current, we have
 $k< k_0, E_n< E_{n0}$ and all modal amplitudes of
 $\mathcal {U}_n, \mathcal {V}_n, \mathcal {W}_n, \mathcal {P}_n$ and
 $\mathcal {B}_n$ becoming smaller than the reference values (cf. all panels of figure 9). This means that the modal wavelength is stretched, and all modal amplitudes are decaying. For a given following current velocity
 $U$, these modulation effects are enhanced by larger value of
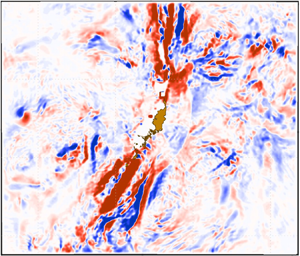
 $|\,f/\omega _0|$, i.e. larger rotational effect. This refraction effect is observed in our realistic MAB simulation (§3.2). Figure 10 shows a snapshot of mode-4 ITs, where one can see that the ITs are stretched, with longer wavelength and reduced amplitude, as they travel into the following current.
Values of  $k/k_0$ (Ł, blue),
 $E_n/E_{n0}$ (
 ${---}$, red) for varying
 $\gamma$ at (a)
 $|\,f/\omega _0|=0.1$, (c)
 $|\,f/\omega _0|=0.6$, (e)
 $|\,f/\omega _0|=0.9$ and (g)
 $|\,f/\omega _0|=0.98$. Values of
 $|\mathcal {U}_n|/|\mathcal {U}_{n0}|$ (
 , red),
 $|\mathcal {V}_n|/|\mathcal {V}_{n0}|$ (
 , yellow),
 $|\mathcal {W}_n|/|\mathcal {W}_{n0}|$ (
 , blue),
 $|\mathcal {P}_n|/|\mathcal {P}_{n0}|$ (
 , red),
 $|\mathcal {B}_n|/|\mathcal {B}_{n0}|$ (
 , green) for varying
 $\gamma$ at (b)
 $|\,f/\omega _0|=0.1$, (d)
 $|\,f/\omega _0|=0.6$, ( f)
 $|\,f/\omega _0|=0.9$ and (h)
 $|\,f/\omega _0|=0.98$.

The  $M_2$-frequency meridional component of the mode-4 IT at an arbitrary phase, overlaid with vectors of the surface background (62 h averaged) velocity, showing the increase of the wavelength due to the following Gulf Stream, as highlighted by the black box.

For  $\gamma <0$ (but not negative enough to trigger the singularity in (4.15)), i.e. IT propagates into an opposing current, we obtain
 $k>k_0$ (cf. figure 9a,c,e,g), meaning that the modal wavelength is shortened. The modal amplitudes of
 $\mathcal {W}_n, \mathcal {P}_n$ and
 $\mathcal {B}_n$ are amplified and
 $\mathcal {V}_n$ is suppressed (cf. figure 9(b,d, f,h). The modulations of
 $E_n$ and
 $\mathcal {U}_n$ are more complicated. It can be shown that there exists a threshold value of
 $|\,f/\omega _0| = \mathcal {F}^* \approx 0.958$, below which
 $E_n/E_{n0}$ and
 $|\mathcal {U}_n|/|\mathcal {U}_{n0}|$ increase monotonically with the increase of the opposing speed (cf. figure 9(a–f). For
 $|\,f/\omega _0| > \mathcal {F}^*$ (near-inertial waves), an anomaly occurs:
 $E_n/E_{n0}$ and
 $|\mathcal {U}_n|/|\mathcal {U}_{n0}|$ first decrease and then increase with the increase of the opposing velocity (cf. figure 9(g–h). The physical reason for this phenomenon can be elucidated using (4.8). As the modal IT propagates into the opposing current, the group velocity increases due to the refraction effect (cf. (4.7a,b)), which has the tendency to reduce
 $E_n$. For sufficiently large
 $|\,f/\omega _0|$ and small
 $|\gamma |$, this reduction of
 $E_n$ can exceed the amplification of
 $E_n$ due to both the increase of the opposing current velocity and the work done by radiation stress. This results in the decrease of
 $E_n$ in the opposing current, reflected by the decrease of the modal amplitude of
 $\mathcal {U}_n$. For
 $\omega _0$ at semidiurnal tidal frequency, the value of inertial frequency with
 $|\,f/\omega _0| = \mathcal {F}^*$ corresponds to the latitude of
 $67.4^\circ$ on Earth. These salient behaviours of ITs are distinct from those of the surface waves analysed in Longuet-Higgins & Stewart (Reference Longuet-Higgins and Stewart1961).
For  $\gamma$ sufficiently negative, i.e. sufficiently large current opposing the IT, the solution of (4.15) can be singular, which indicates wave focusing. This occurs when
 $\gamma A + c_{p0}/c_p =0$, which can be solved to obtain the critical value of
 $\gamma ^*=-\sqrt {1/A}$. For
 $\gamma \leq \gamma ^*$, the opposing velocity can exceed the local modal group velocity of the IT, and the amplification of the modal energy becomes theoretically infinite due to energy accumulation. In practice, the modes of the IT are expected to break before this point is reached. Values of
 $\gamma ^*$ for different values of
 $|\,f/\omega _0|$ are plotted in figure 11, showing that the magnitude of the critical opposing velocity decreases as
 $|\,f/\omega _0|$ increases. For near-inertial waves with
 $f$ approaching
 $\omega _0$, the critical opposing velocity approaches zero. For
 $f$ close to zero, the modal velocity satisfies
 $c_g=c_p=c_n=c_{p0}$, and the magnitude of the critical opposing velocity reaches
 $c_{p0}$.
Values of  $\gamma ^*$ for different values of
 $|\,f/\omega _0|$.

While figures 9 and 11 apply to each mode of the IT separately, when combined, they describe the propagation of an IT that is a sum of vertical modes. For a given value of  $f$ and thus
 $\gamma ^*$, since higher modes have smaller phase velocity
 $c_{p0}$, the critical opposing velocity to trigger wave focusing is smaller for higher modes than for lower modes. As the IT propagates into an opposing current, higher modes tend to break at smaller opposing velocity. Therefore, the opposing flow can block the higher modes, and allow the lower modes to pass through (this is in principle similar to the blockage effect of surface waves described in Shyu & Phillips Reference Shyu and Phillips1990). This analysis is consistent with the observation of long-distance propagation of low-mode IT in the ocean, although the IT dynamics in the general case is incomparably more complicated.
5. Conclusions
We generalized the CTE to describe the modal evolution of ITs in a heterogeneous ocean background with dynamic mean flow and density fields, and spatially varying topography. The new terms we derived account for the three-way interactions of ITs with co-existent features in these three background fields. The new terms are evaluated using simulations of ocean PEs in a series of idealized cases and two realistic data-assimilative cases in the MAB and Palau Island regions. We analyse the modal energy budget of the mode-1 IT using the generalized CTE, quantifying the effects of the advection of mode-1 energy by the mean flow, the energy exchange between mode-1 and the variable background fields due to shear and buoyancy productions and the modal conversion due to the heterogeneous ocean background. In the latter, the new three-way interaction terms can locally account for 10 %–30 % of the total mode-1 conversion. In the MAB, higher values occur during periods of stronger tides, and in the Gulf Stream, we find that the three-way interaction terms can locally account for over 50 % of the total energy conversion. In regions of stronger mean flow (Gulf Stream, NECC and island-scale eddies), the advection of mode-1 energy by the mean flow can locally account for 50 % of the divergence in the mode-1 energy flux. In these regions, the exchange of energy between the variable background and mode-1 IT by shear and buoyancy productions is also significant. On the sloping MAB shelf, the shear production, buoyancy production and topographic conversions are of similar importance and are the main contributors to the divergence of the mode-1 energy flux.
For the interaction of ITs with a large-scale barotropic current, we show that the generalized CTE can be reduced to the principle of conservation of modal wave action. Using WKB analysis, we obtain the analytical solution of the modulation of a modal IT by a collinear current. For the modal IT propagating from a quiescent field into a following current, the wavelength increases and modal energy decreases. These refraction effects are shown to be enhanced by a larger ratio of inertial and tidal frequencies  $|\,f/\omega _0|$. For the modal IT propagating into an opposing current, the wavelength decreases, and the modulation of modal energy amplitude depends on the parameter
 $f/\omega _0$. It is shown that for
 $|\,f/\omega _0| < \mathcal {F}^* \approx 0.958$, the modal energy increases with the increase of the opposing current velocity. For
 $|\,f/\omega _0| > \mathcal {F}^*$, the modal energy decreases for small opposing velocity and increases for larger opposing velocity. This dependence on
 $f/\omega _0$ is physically explained by its effect in increasing the group velocity of the modal IT in the opposing current, and the relative importance of this effect in the budget of modal energy. The critical opposing current velocity, which triggers the wave focusing, is obtained as a function of
 $f/\omega _0$ and mode number. For ITs composed of multiple vertical modes, the higher modes are subject to smaller critical opposing velocity, and they are thus first blocked by an opposing current as the ITs propagate in the ocean.
Acknowledgements
We thank the members of our MSEAS group for useful discussions. We thank our colleagues in FLEAT, SW06 and AWACS-06 for their collaboration. We thank the HYCOM team for their ocean fields as well as NCEP (NAM) and FNMOC (NVGEM) for their atmospheric forecasts.
Funding
We are grateful to the Office of Naval Research for support under grants N00014-15-12626 (FLEAT), N00014-11-1-0701 (MURI-IODA) and N00014-19-1-2693 (IN-BDA), and to the National Science Foundation for support under grant OCE-1061160 (ShelfIT), each to the Massachusetts Institute of Technology.
Declaration of interest
The authors report no conflict of interest.
Appendix A. Set-up for realistic simulations
We employed MSEAS (Haley & Lermusiaux Reference Haley and Lermusiaux2010; Haley et al. Reference Haley, Agarwal and Lermusiaux2015) for our ocean simulations. MSEAS is used to study and quantify tidal-to-mesoscale processes over regional domains with complex geometries and varied interactions. Modelling capabilities include implicit two-way nesting/tiling for multiscale hydrostatic PE dynamics with a nonlinear free surface (Haley & Lermusiaux Reference Haley and Lermusiaux2010) and a high-order finite element code on unstructured grids for non-hydrostatic processes (Ueckermann & Lermusiaux Reference Ueckermann and Lermusiaux2010, Reference Ueckermann and Lermusiaux2016). The MSEAS subsystems that are used in the present work include: initialization schemes (Haley et al. Reference Haley, Agarwal and Lermusiaux2015), nested data-assimilative tidal prediction and inversion (Logutov & Lermusiaux Reference Logutov and Lermusiaux2008); fast-marching coastal objective analysis (Agarwal & Lermusiaux Reference Agarwal and Lermusiaux2011); subgrid-scale models (e.g. Lermusiaux Reference Lermusiaux2001, Reference Lermusiaux2006); and advanced data assimilation (Lermusiaux Reference Lermusiaux1999, Reference Lermusiaux2007). The MSEAS software has been validated for fundamental research and for realistic simulations in varied regions of the world's ocean (Leslie et al. Reference Leslie, Robinson, Haley, Logutov, Moreno, Lermusiaux and Coelho2008; Onken et al. Reference Onken, Álvarez, Fernández, Vizoso, Basterretxea, Tintoré, Haley and Nacini2008; Haley et al. Reference Haley2009; Gangopadhyay et al. Reference Gangopadhyay, Lermusiaux, Rosenfeld, Robinson, Calado, Kim, Leslie and Haley2011; Ramp et al. Reference Ramp, Lermusiaux, Shulman, Chao, Wolf and Bahr2011; Colin et al. Reference Colin2013; Lermusiaux et al. Reference Lermusiaux2017; Subramani et al. Reference Subramani, Lermusiaux, Haley, Mirabito, Jana, Kulkarni, Girard, Wickman, Edwards and Smith2017; Kulkarni et al. Reference Kulkarni2018; Gupta et al. Reference Gupta, Haley, Subramani and Lermusiaux2019; Lermusiaux et al. Reference Lermusiaux2019), including monitoring (Lermusiaux, Haley & Yilmaz Reference Lermusiaux, Haley and Yilmaz2007), naval exercises including real-time acoustic-ocean predictions (Xu et al. Reference Xu, Lermusiaux, Haley, Leslie and Logutov2008) and environmental management (Cossarini, Lermusiaux & Solidoro Reference Cossarini, Lermusiaux and Solidoro2009).
A.1. Middle Atlantic Bight
For the MAB, we configured the MSEAS-PE in a two-way nested mode with a 3 km resolution large domain spanning  $520\ \textrm {km} \times 450\ \textrm {km}$ and a 1 km resolution small domain spanning
 $170\ \textrm {km} \times 155\ \textrm {km}$. Both domains are oriented such that one axis is roughly parallel to the eastern seaboard of the USA and both employ 100 terrain-following vertical levels optimized for the background
 $T/S$ structure of the slope/shelf region. Results in this paper are presented on the larger (3 km) domain. Initial conditions were computed from analyses of combined synoptic in situ data (SW06 data from gliders, conductivity–temperature–depth profiles (CTD), etc. and National Marine Fisheries Service (NMFS; National Marine Fisheries Service (2019) CTD survey data) and historical data (World Ocean Database, NMFS CTDs, Gulf Stream feature analyses, etc.). Temperature and salinity based feature models (Lermusiaux Reference Lermusiaux1999; Gangopadhyay et al. Reference Gangopadhyay, Robinson, Haley, Leslie, Lozano, Bisagni and Yu2003) were utilized to model the shelf/slope front and the Gulf Stream. Additional transport feature models were employed to improve the Gulf Stream, slope recirculation gyre and shelfbreak front. The synoptic in situ data and satellite sea surface temperature were also assimilated. Surface forcing was provided by combining the 6 km WRF (Rutgers Center for Ocean Observing Leadership 2020) and
 $1^\circ$ NOGAPS (National Oceanic and Atmospheric Administration 2020) atmospheric fluxes. Tidal forcing was obtained from the high resolution TPXO8-Atlas tides (Egbert & Erofeeva Reference Egbert and Erofeeva2002, Reference Egbert and Erofeeva2013) adjusted for our higher resolution bathymetry and coastlines (Logutov & Lermusiaux Reference Logutov and Lermusiaux2008).
A.2. Palau Island region
For the Palau Island region, we configured the MSEAS-PE with a  $1/225^\circ$ resolution grid covering are region of
 $420\ \textrm {km} \times 360\ \textrm {km}$ using 70 terrain-following vertical levels optimized for the background T/S structure of the western Pacific. We downscaled our initial and boundary conditions from the
 $1/12^\circ$ HYCOM analyses (Cummings & Smedstad Reference Cummings and Smedstad2013) employing our optimization for higher resolution bathymetry and coastlines (Haley et al. Reference Haley, Agarwal and Lermusiaux2015). The surface forcing was obtained from the
 $1/4^\circ$ Global Forecast System atmospheric fluxes ((2019) NCEP). Tidal forcing was obtained from the high resolution TPXO8-Atlas tides (Egbert & Erofeeva Reference Egbert and Erofeeva2002, Reference Egbert and Erofeeva2013) adjusted for our higher resolution bathymetry and coastlines and our specific quadratic bottom drag (Logutov & Lermusiaux Reference Logutov and Lermusiaux2008).
A.3. Extracting background and IT fields for balance terms
To compute CTE momentum, pressure and energy balance terms derived in § 2 and shown in § 3, a 62 h time window (about five periods of the  $M_2$ tide) is selected and the hourly velocity, temperature, salinity and surface pressure fields for that time window are extracted from the MSEAS-PE output. The three-dimensional pressure is obtained from the sum of the surface pressure and the hydrostatic pressure computed from temperature and salinity. A Fourier transform is applied to the velocities and pressure. The background fields are obtained from the Fourier mean and the fast tidal fields from the semi-diurnal component. These Fourier transformed fields are then projected onto the local vertical modes obtained by solving (2.8) using Chebyshev polynomials.
Appendix B. Dimensional analysis of the generalized modal energy CTE
In order to estimate the impact of the various parameters on the contributions to the modal energy CTE, we perform a dimensional analysis. We introduce separate length scales for velocity, pressure and density:  $L_u, h_u, L_p, h_p, L_\rho$ and
 $h_\rho$. We denote non-dimensional variables with a hat. For the background flow, we introduce the horizontal (
 $\tilde {U}$) and vertical (
 $\tilde {W}$) velocity scales, the background pressure scale (
 $\tilde {P}$), the background time scale (
 $\tau$), the background buoyancy (
 $\tilde {B}$) and the background buoyancy frequency (
 $\tilde {N}$). For the tidal flow, we introduce the horizontal (
 $\tilde {u}$) and vertical (
 $\tilde {w}$) velocity scales, the tidal pressure scale (
 $\tilde {p}$) and the tidal time scale (
 $T\ll \tau$). Using continuity in the standard way and the definition of
 $N^2$ ((2.5)), we obtain,
 \begin{equation} W = \left(\frac{h_u}{L_u}\right) \tilde{U} W^* ,\quad w = \left(\frac{h_u}{L_u}\right) \tilde{u} w^* , \quad B = h_\rho \tilde{N}^2 B^*. \end{equation}
Since we projected onto vertical modes in the dimensional space, we introduce scalings for both the vertical modes,  $\tilde {\phi }$ and
 $\tilde {\varPhi }$. Using (2.10b) and (2.9) yields
 \begin{equation} \phi_n = \frac{\phi^*_n}{\sqrt{h}},\quad \varPhi_n = \sqrt{h} \varPhi^*_n, \end{equation}
where the specific  $h$ depends on which variable is being expanded. We then introduce these scaling into (2.7) to obtain
 \begin{equation} \boldsymbol{u}_n = \sqrt{h_u} \tilde{u} \boldsymbol{u}^*_n ,\quad p_n = \sqrt{h_p} \tilde{p} p^*_n ,\quad w_n = \frac{\sqrt{h_u} \tilde{u}}{L_u} w^*_n . \end{equation}
Finally, we introduce all these scalings and relations into (2.12), (2.13), (2.15)–(2.18), resulting in the following expressions for the rate of change of the modal energy density:
 \begin{equation} \frac{\partial E_n}{\partial t} = \frac{\rho_0 h_u \tilde{u}^2}{T} \frac{\partial }{\partial t^*} \left[ \frac{1}{2} \langle |\boldsymbol{u}^*_n|^2 \rangle + \frac{1}{2} \left(\frac{\tilde{p}}{\rho_0\tilde{u}\tilde{c}}\right)^2 \left(\frac{h_p}{h_u}\right) \frac{\langle {p^*_n}^2\rangle} {{c^*_n}^2} \right] , \end{equation}
the divergence of the modal energy flux,
 \begin{equation} \boldsymbol{\nabla} \boldsymbol{\cdot} F_n = \frac{\rho_0 h_u \tilde{u}^2}{T} \left(\frac{h_p}{h_u}\right)^{{1/2}} \left(\frac{\tilde{p}T}{\rho_0\tilde{u}\sqrt{L_p L_u}}\right) \left[ \nabla^* \boldsymbol{\cdot} \langle {p^*}_n \boldsymbol{u}^*_n \rangle \right] , \end{equation}
the advection of modal energy by the mean flow,
 \begin{align} A_n &={-} \frac{\rho_0 h_u \tilde{u}^2}{T} \sum_{m=0}^{\infty} \left(\frac{\tilde{U} T}{L_u}\right) \left[ \langle\boldsymbol{U}^*_{nm}\boldsymbol{\cdot}\nabla^*\boldsymbol{u}^*_m \boldsymbol{\cdot}\boldsymbol{u}^*_n \rangle - \left(\frac{h_u\tilde{N}}{\tilde{c}}\right)^2 W^*_{nm}\langle \boldsymbol{u}^*_m \boldsymbol{\cdot} \boldsymbol{u}^*_n \rangle \right.\nonumber\\ &\quad + \left.\left(\frac{\tilde{p}}{\rho_0\tilde{u}\tilde{c}}\right)^2 \left(\frac{h_p\tilde{N}}{\tilde{c}}\right)^2 \frac{1}{{c^*_n}^2} \left(\left(\frac{L_u h_p}{L_p h_u}\right) \langle\boldsymbol{U}^{p*}_{nm} \boldsymbol{\cdot} \nabla^* p^*_m p^*_n\rangle + W^{p*}_{nm} \langle \,p^*_m p^*_n \rangle\right) \right], \end{align}
the rate of energy exchange between the tidal flow and the varying background mean flow and buoyancy fields,
 \begin{align} R_n &={-} \frac{\rho_0 h_u \tilde{u}^2}{T} \sum_{m=0}^{\infty} \left[ \left(\frac{\tilde{U} T}{L_u}\right) ( \langle \boldsymbol{u}^*_m \boldsymbol{\cdot} \boldsymbol{\mathcal{U}}^{g*}_{nm}\boldsymbol{\cdot} \boldsymbol{u}^*_n \rangle - \langle (\nabla^*\boldsymbol{\cdot}\boldsymbol{u}^*_m) \boldsymbol{u}^*_n \rangle \boldsymbol{\cdot} \boldsymbol{U}^{z*}_{nm} ) \right.\nonumber\\ &\quad - \left. \left(\frac{h_p}{h_u}\right) \left(\frac{h_p h_\rho \tilde{N}^2}{\tilde{c}^2}\right) \left(\frac{\tilde{p}T}{\rho_0 L_\rho \tilde{u}}\right) \frac{\langle \,p^*_n\boldsymbol{u}^*_m \rangle}{{c^*_n}^2} \boldsymbol{\cdot} \boldsymbol{B}^*_{nm} \right] , \end{align}
and the modal conversion due to the heterogeneous ocean background, including mean flow and horizontally varying buoyancy and topography,
 \begin{align} TC_n &={-} \frac{\rho_0 h_u \tilde{u}^2}{T} \sum_{m=0}^{\infty} \left[ \left(\frac{\tilde{p} T}{\rho_0 L_p \tilde{u}}\right) \left(\frac{h_p}{h_u}\right)^{{1/2}} \left(\langle \,p^*_m\boldsymbol{u}^*_n \rangle \boldsymbol{\cdot} \boldsymbol{T}^*_{mn} - \langle \,p^*_n \boldsymbol{u}^*_m \rangle \boldsymbol{\cdot} \boldsymbol{T}^*_{nm}\right)\right. \nonumber\\ &\quad + \underbrace{\left(\frac{\tilde{U} T}{L_u}\right) C^*_{nm} \langle \boldsymbol{u}^*_m \boldsymbol{\cdot} \boldsymbol{u}^*_n \rangle + \left(\frac{\tilde{U} T}{L_p}\right) \left(\frac{\tilde{p}}{\rho_0 \tilde{u} \tilde{c}}\right)^2 \left(\frac{h_p\tilde{N}}{\tilde{c}}\right)^2 \frac{1}{{c^*_n}^2} C^{p*}_{nm} \langle \,p^*_m p^*_n \rangle}_{\text{new three-way terms}} \nonumber\\ &\quad+ \left.\left(\frac{\tilde{U} T}{L_u}\right) \left\langle \left(\sum_{l=0}^{\infty}\boldsymbol{u}^*_l\boldsymbol{\cdot}\boldsymbol{T}^*_{ml}\right) \boldsymbol{u}^*_n \right\rangle \boldsymbol{\cdot} \boldsymbol{U}^{z*}_{nm} \right] . \end{align}
Several of these non-dimensional groups are related to well-known non-dimensional numbers. The groups  $({\tilde {U} T}/{L_u})$ and
 $({\tilde {U} T}/{L_p})$ can be expressed in terms of the Rossby number,
 $Ro = ({\tilde {U}}/{f L_u})$ as
 $Ro (\,fT)$ and
 $Ro (\,fT) ({L_u}/{L_p})$. In regions where the local tides are more important than Coriolis, these non-dimensional grouping can also be expressed in terms of the Keulegan–Carpenter number ,
 $Kc = ({\tilde {u}}/{\omega L_u})$ (where
 $\omega$ is the tidal frequency), as
 $Kc ({\tilde {U}}/{\tilde {u}})$ and
 $Kc \left(\frac{\tilde{U} L_u}{\tilde{u} L_p}\right)$. The groups
 $({h_u\tilde {N}}/{\tilde {c}})^2, ({h_p\tilde {N}}/{\tilde {c}})^2$ and
 $({h_p h_\rho \tilde {N}^2}/{\tilde {c}^2})$ can all be expressed in terms of the Richardson number,
 $Ri = {| N^2 |}/{\|{\partial \boldsymbol {u}}/{\partial z}\|^2}$ as
 $Ri ({\tilde {U}}/{\tilde {c}})^2$. In general
 $\tilde {U}\ll \tilde {c}$, so the dependence on
 $Ri$ will be somewhat weak. The pressure groups
 $({\tilde {p} T}/{\rho _0 L_p \tilde {u}}), ({\tilde {p}T}/{\rho _0 L_\rho \tilde {u}})$ and
 $({\tilde {p}T}/{\rho _0\tilde {u}\sqrt {L_p L_u}})$ are essentially the balance between the pressure gradient and the local rate of change. We expect these groups to be O(1). The final pressure group
 $({\tilde {p}}/{\rho _0\tilde {u}\tilde {c}})$ can be transformed to
 $({L_p}/{T\tilde {c}})$ by assuming the previous groups are O(1). We expect this last group to be of the order of
 $({\tilde {u}}/{\tilde {c}})$. Since the tidal velocity is generally much smaller than the wave speed, this final pressure group is expected to be much less than 1.
From (B4)–(B8), we first observe that the amplitude of the tides ( $\tilde {u}$) factors out of all the equations. So, although each of the terms grows with the square of
 $\tilde {u}$, the tidal amplitude does not directly change the relative importance of the terms. The next observation is that the contribution of the new three-way terms grows with the magnitude of the background velocity (
 $\tilde {U}$). We also see that the three-way interaction terms grow with decreasing horizontal length scales (
 $L_u, L_p$), e.g. near steeper topography that impacts the background flow. The background flow and the topographic gradient are the main parameters governing the impact of the new three-way interaction terms. Note that, since the background velocity contains the temporal mean of the wave–wave interactions, the background velocity provides an indirect pathway for the tidal amplitude to affect these terms and we can expect that local regions where the mean of the wave–wave interactions is important will also have a larger contribution from the three-way interaction terms. Finally, although one of the new three-way terms grows with the magnitude of the buoyancy frequency (
 $\tilde {N}$), this term is multiplied by the small factor
 $\sim ({\tilde {u}}/{\tilde {c}})$. Other terms that grow with
 $\tilde {N}$ do not have this small factor and would thus grow faster with
 $\tilde {N}$. Hence, we expect that the new three-way terms would then lose ground to these other terms and have a smaller relative contribution.



