Introduction
Vast parts of the lowlands of the northern half of Europe were covered by extensive wetlands prior to significant human impact ongoing since the Middle Ages. However, the European wetlands have been significantly decreased and degraded by human activities and their consequences. This has resulted in the extensive destruction or fragmentation of many wetland habitats with only a few high quality remnants surviving up to now (e.g. Corbet, Reference Corbet1999; Küster, Reference Küster1999; Bernard et al., Reference Bernard, Buczyński and Tończyk2002; Bragg & Lindsay, Reference Bragg and Lindsay2003). Fragmentation can destroy metapopulation structures (Hanski, Reference Hanski1999), and surviving populations are often small and genetically depauperate with concomitant negative implications for conservation (Frankham et al., Reference Frankham, Ballou and Briscoe2002), as observed in many wetland remnants of Central and Eastern Europe (e.g. Bauer, Reference Bauer1988; Pokryszko, Reference Pokryszko2003; Bernard & Wildermuth, Reference Bernard and Wildermuth2005a; Habel et al., Reference Habel, Schmitt, Härdtle, Lütkepohl and Assmann2007).
Highly stenotopic species with very narrow and specific habitat requirements are especially affected by such processes (e.g. Matern et al., Reference Matern, Desender, Drees, Gaublomme, Paill and Assmann2009). The survival of many of these habitat specialists is strongly questioned because of (i) the often high degree of habitat fragmentation, (ii) the mostly small size of the single habitat patches, and (iii) the sometimes reduced habitat quality (e.g. due to negative edge effects) (e.g. Thomas & Morris, Reference Thomas and Morris1994; Pauler-Fürste et al., Reference Pauler-Fürste, Kaule, Settele, Settele, Margules, Poschlod and Henle1996; Thomas et al., Reference Thomas, Bourn, Clarke, Stewart, Simcox, Pearman, Curtis and Goodger2001; WallisDeVries et al., Reference WallisDeVries, Poschlod and Willems2002). In this context, the analysis of the population genetic structure in these species is crucial for the assessment of the evolutionary potential and viability of populations (Frankham et al., Reference Frankham, Ballou and Briscoe2002; Hansson & Westerberg, Reference Hansson and Westerberg2002; Reed & Frankham, Reference Reed and Frankham2003) because genetic bottlenecks can sometimes have detrimental consequences for their fitness, as demonstrated primarily in plant systems (e.g. Oostermeijer et al., Reference Oostermeijer, van Eijck, van Leeuwen and den Nijs1995; Fischer & Matthies, Reference Fischer and Matthies1998; Luijten et al., Reference Luijten, Dierick, Gerard, Oostermeijer, Raijmann and Den Nijs2000), but also in animal examples (e.g. Saccheri et al., Reference Saccheri, Kuussaari, Kankare, Vikman, Fortelius and Hanski1998; Westemeier et al., Reference Westemeier, Brawn, Simpson, Esker, Jansen, Walk, Eric, Kershner, Bouzat and Paige1998; Rowe et al., Reference Rowe, Beebee and Burke1999). To unravel the population genetics of a highly specific and declining wetland species, we studied 14 allozyme loci of the endangered damselfly Nehalennia speciosa (Charpentier, 1840), the smallest European Odonata species, in Polish and Lithuanian populations. This region is a transitional zone in the species distribution between the highly scattered populations (under strong human impact) occurring westwards and southwards and the more continuous range (under more natural conditions) situated eastwards.
Nehalennia speciosa inhabits two main types of habitats: (i) a narrow zone of specific, floating and flooded, transition-mire vegetation (i.e. the vegetation influenced both by lake water and Sphagnum bog water) bordering the open water of small dystrophic/oligotrophic lakes and pools, and (ii) shallow waters within Sphagnum bogs and fens, in small depressions or flooded areas without a larger open water table. This damselfly is a habitat specialist requiring a habitat texture and microclimate provided by a very specific combination of: (i) low depth of water, (ii) abundance of submerged vegetation (Sphagnum, other mosses, Utricularia, parts of helophytes), (iii) emergent ‘lawn-like’, fairly dense formations of strictly defined narrow-leaved plants (mostly selected Carex spp., the most important being C. limosa and C. lasiocarpa) with admixtures of some broad-leaved plants, and (iv) water quality with fairly low pH, and low conductivity, hardness and trophy (Bernard & Wildermuth, Reference Bernard and Wildermuth2005a). N. speciosa is morphologically and ethologically adapted to the described habitats with obtrusive obstacles to flight, a humid microclimate and small spatial compass (Bernard & Wildermuth, Reference Bernard and Wildermuth2005b).
The habitats of N. speciosa are mostly primary (i.e. natural). However, close to the limits of the species' distribution, the proportion of secondary habitats (i.e. formed as a consequence of human activity), especially post-excavation peaty pools, is significant (Bernard & Wildermuth, Reference Bernard and Wildermuth2005a).
The geographic range of N. speciosa extends between 5° and 145°E, from Belgium to Japan, with the latitudinal limits in Europe between 45° and 62°N, between northern Italy, northern Romania and the Crimean Peninsula in the South and southern Sweden and southern Finland in the North. However, significant changes in distribution and population size have occurred in the European part of the species' range (especially close to its distribution limits) during the last century, and the species has become extinct in large areas (Bernard & Wildermuth, Reference Bernard and Wildermuth2005a). Currently, it occurs mainly in eastern Europe, including Estonia, central Latvia, eastern Lithuania, northern and eastern Poland and southern Belarus. In all other regions, it has survived primarily in single or very rare, scattered populations, with the sole exception of the more densely inhabited Bavarian Prealpine Region (Bernard & Wildermuth, Reference Bernard and Wildermuth2005a). N. speciosa is currently considered one of the most endangered Odonata species in Europe (Sahlén et al., Reference Sahlén, Bernard, Cordero Rivera, Ketelaar and Suhling2004), and it qualifies for the category Near Threatened (NT) in the global IUCN Red List (Bernard & Wildermuth, Reference Bernard and Wildermuth2006).
The 11 populations selected for our genetic studies represent different (i) degrees of habitat fragmentation and isolation, (ii) population sizes, (iii) habitat types, and (iv) habitat sizes. The allozyme analysis allows us to address the following questions:
1. Is the habitat structure congruent with the population genetic structure?
2. Are more peripheral populations in the species' distribution (i.e. those from western or southern Poland) genetically more depauperate than more central populations (i.e. those from NE Poland and Lithuania)?
3. Is the genetic structure found in N. speciosa quite simple (i.e. low total numbers of alleles, no large numbers of rare alleles) so that the species might show some genetic adaptation for the survival of isolated relatively small populations (as many other species having such a genetic structure and pattern of distribution)?
4. What is the best conservation strategy for this species in eastern Central Europe?
Material and methods
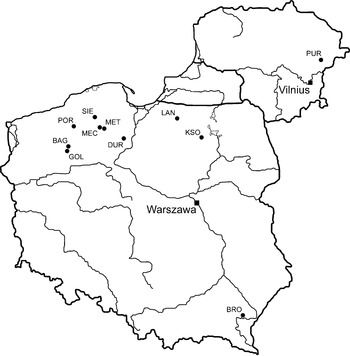
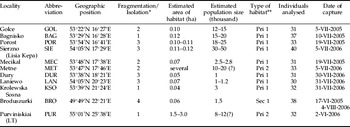
Imagines of N. speciosa were sampled at ten localities in Poland and one site in Lithuania in the summers of 2005 and 2006 (fig. 1, table 1). Thirty to 40 individuals per site were netted and immediately frozen in liquid nitrogen. During these visits, we estimated the surface area of the N. speciosa habitats and determined the individuals' densities by direct counting at many sites per habitat. Based on this area and the respective average population density, we cautiously extrapolated the total number of individuals over the whole flight season (table 1); details can be obtained from the first author. However, the presented total numbers reflect levels of numbers (helpful in comparisons among populations) rather than detailed numbers. Furthermore, we distinguished between two main habitat types (see above) and between primary (natural) and secondary (formed as a consequence of human activity) habitats. Different degrees of habitat fragmentation, described by four classes of population distribution (thoroughly surveyed in the field), were considered: Class 1, populations at a small distance of <3 km suggested metapopulation structure (three replicates); class 2, a single population with other populations at a distance of <15 km, possibly being parts of a former metapopulation, but actually fragmented (three replicates); class 3, isolated population with the closest population at a distance of 25–40 km (four replicates); and class 4, highly isolated population with the closest population at a distance of 90 km (one replicate). Classes 3 and 4 were merged in the analyses as only one replicate was available for the latter class.
Location of the 11 sample sites of Nehalennia speciosa in Poland and Lithuania. For abbreviations of localities, see table 1.

Sampling localities, geographic position of sampling sites, degree of fragmentation and isolation, estimated habitat size and approximate number of Nehalennia speciosa individuals, habitat type, number of sampled individuals and date of capture.

* 1: populations at a small distance of <3 km, suggested metapopulation structure; 2: a single population with other populations at a distance of <15 km, possibly being parts of a former metapopulation, but actually fragmented; 3: isolated population with the closest population at a distance of 25–40 km; 4: highly isolated population with the closest population at a distance of 90 km.
** 1: narrow zone of specific, transition-mire vegetation (see Introduction) bordering the open water table of small dystrophic/oligotrophic lakes and pools; 2: shallow waters within Sphagnum bogs and fens, in small depressions or flooded areas without a larger open water table.
Pri, primary; Sec, secondary.
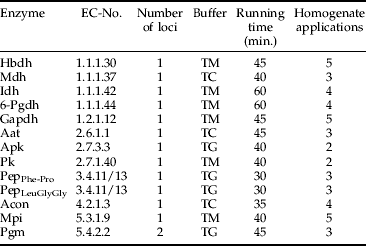
Immediately after taking the individuals out of the liquid nitrogen, we carefully checked them under a stereo microscope and removed parasites (i.e. mites) from their bodies to avoid contamination of enzyme extracts with alien material. The entire abdomen of each individual was homogenised in Pgm-buffer by ultrasound and centrifuged at 17,000 g for 5 min. Electrophoresis was performed using cellulose acetate plates. We analysed 13 enzyme systems representing 14 loci. The electrophoresis conditions are provided in table 2.
Conditions of electrophoresis for different enzymes analysed for Nehalennia speciosa.
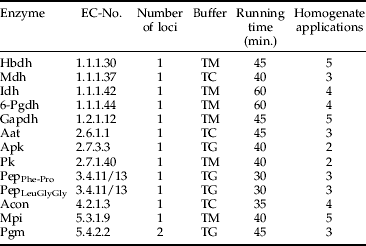
TC, Tris-citrate pH 8.2; TG, Tris-glycine pH 8.5; TM, Tris-maleic acid pH 7.0 (adjusted from TM pH 7.8) (Hebert & Beaton, Reference Hebert and Beaton1993). All buffers were run at 200 V.
The alleles were labelled according to their relative mobility, starting with ‘1’ for the slowest. The allele frequencies and genetic diversity parameters (A, mean number of alleles per locus; H e, expected heterozygosity; H o, observed heterozygosity; P tot, total percentage of polymorphic loci; and P 95, percentage of polymorphic loci with the most common allele not exceeding 95%) were calculated with the package G-Stat (Siegismund, Reference Siegismund1993). We also calculated allelic richness based on 30 individuals (AR) with the use of the program FSTAT 2.9.3 (Goudet, Reference Goudet1995). Hardy-Weinberg equilibrium (Louis & Dempster, Reference Louis and Dempster1987), genetic disequilibrium (Weir, Reference Weir1991), locus by locus F-statistics, pairwise F ST values and AMOVA variance analyses were calculated with the package Arlequin 2.000 (Schneider et al., Reference Schneider, Roessli and Excoffier2000), with F IS representing the genetic variance component among individuals within populations, F ST the genetic variance component among populations, F SC the genetic variance component among populations within groups and F CT the genetic variance component among groups of populations. For the calculation of genetic distances (Nei, Reference Nei1972) and for phenograms based on these distances and pairwise F ST values the package PHYLIP (Felsenstein, Reference Felsenstein1993) was used. We used the neighbour-joining method (Saitou & Nei, Reference Saitou and Nei1987). Bootstrapping with 1000 replications did not result in reasonable values. Mantel tests, for the test of isolation by distance, were calculated with the use of XLSTAT version 2006.3, while correlation analyses and Kruskal-Wallis ANOVAs, for testing of cohesions between (i) habitat parameters and population parameters and (ii) genetic diversity parameters, were performed with the use of STATISTICA.
Results
We analysed a total of 368 individuals from 11 N. speciosa populations (mean per sample: 33.5±3.3 SD). All enzyme loci had banding patterns consistent with known quaternary structures. No deviations from Hardy Weinberg expectations were found, and no general linkage disequilibrium was observed for any pair of loci.
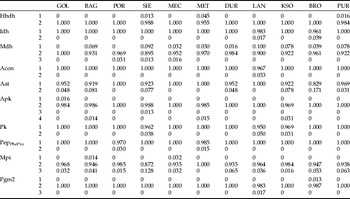
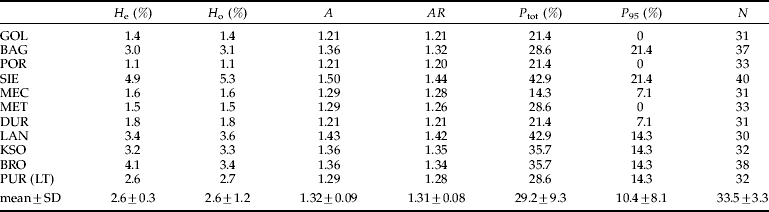
Four loci (6-Pgdh, Gapdh, PepLeuGlyGly, Pgm1) were monomorphic in all populations, whereas the other ten loci had between two and four alleles, i.e. an average of 2.14±1.03 SD per locus (allele frequencies, see table 3). We calculated the following averages for six population genetic parameters: A: 1.32 (±0.09 SD); AR: 1.31 (±0.08 SD); H e: 2.6% (±1.3 SD); H o: 2.6% (±1.2 SD); P tot: 29.2% (±9.3 SD); and P 95: 10.4% (±8.1 SD) (see table 4 for detailed data). A and AR are highly correlated (r 2=0.975; P<0.0001). Neither the size of the habitat nor the size of the population correlated significantly with the genetic diversity of the respective population (correlations: all P>0.30). Furthermore, we did record no influence of the degree of isolation on the diversity (Kruskal Wallis ANOVAs: all P>0.08).
Allele frequencies of ten polymorphic allozyme loci in 11 samples of Nehalennia speciosa from Poland and Lithuania.

For abbreviations of localities, see table 1.
Six parameters of genetic diversity for all populations analysed of Nehalennia speciosa.
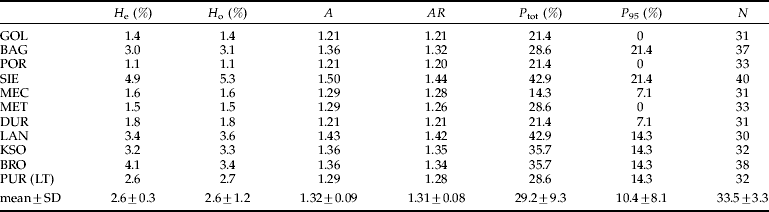
H e, percentage of expected heterozygosity; H o, percentage of observed heterozygosity; A, mean number of alleles per locus; AR, allelic richness on the basis of 30 individuals; P tot, percentage of total polymorphic loci; and P 95, percentage of polymorphic loci with the commonest allele not exceeding 95%; as well as, N, the number of individuals analysed. For abbreviations of localities, see table 1.
We calculated a total genetic variance of 0.1896 (i.e. the variance at all levels: within individuals, among individuals within populations and among populations). Of this variance, 0.0039 was among populations (i.e. F ST: 2.04%, P<0.0001). The variance among individuals within populations (i.e. F IS) was not significant (−0.0030, P=0.70). Pairwise F ST values ranged from 0.0% to 9.9% (mean: 2.3%±2.6 SD). Nei's (Reference Nei1972) genetic distances ranged from 0.0001 to 0.0028 (mean: 0.0009±0.0006 SD). A significant correlation was recorded between geographic and genetic distances (Mantel test: r=0.308, p=0.022), but not between geographic distances and pairwise F ST values (Mantel test: r=0.139, P=0.30). This difference might be due to the different algorithms used for the calculation of genetic distances and pairwise F ST values. Furthermore, the explained variance in the former case (<10%) is relatively low.
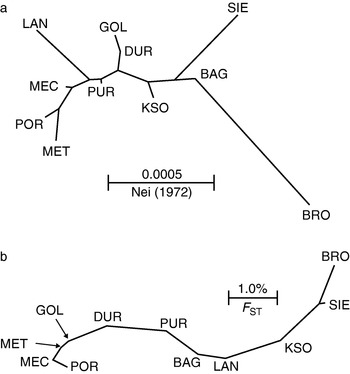
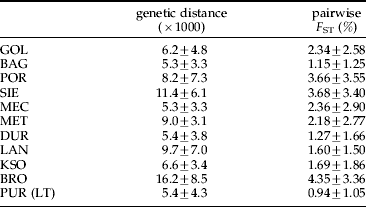
Cluster analyses based on Nei's (Reference Nei1972) genetic distances (fig. 2a) and pairwise F ST values (fig. 2b) revealed similar topologies. In both phenograms, the isolated population from Broduszurki (SE Poland) occupied the most divergent position, whereas the geographically remote sample from Purviniskiai (Lithuania) had a central position in the phenogram. These positions were further supported by the mean genetic differentiation of each population against all other sample populations (table 5). The mean genetic distances and pairwise F ST values of the Broduszurki population against the other populations were the highest values obtained, whereas these values for both parameters ranged among the lowest means obtained for the Purviniskiai population.
Neighbour-joining phenogram based on (a) genetic distances (Nei, Reference Nei1972) and (b) pairwise F ST values of the 11 populations of Nehalennia speciosa from Poland and Lithuania. For abbreviations of localities, see table 1.

Mean genetic distances (Nei, Reference Nei1972) and mean pairwise F ST values of individual samples of Nehalennia speciosa against all other samples.
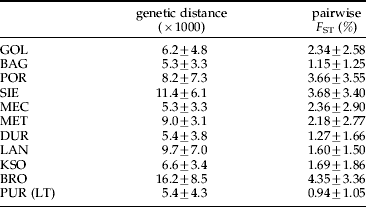
Values are given with their standard deviations. For abbreviations of localities, see table 1.
A hierarchical variance analysis distinguishing among four potential geographic groups of populations (NW Poland: GOL, BAG, POR, SIE, MEC, MET, DUR; NE Poland: LAN, KSO; SE Poland: BRO; Lithuania: PUR; cf. fig. 1) revealed no significant differentiation among these groups (variance: 0.0021, F CT: 1.09%, P=0.17), but a significant differentiation among populations within these groups (variance: 0.0026, F SC: 1.40%, P<0.0001).
Discussion
Genetic diversity and differentiation
The genetic diversity of the analysed populations of N. speciosa is quite low compared with other invertebrates with mostly the same loci analysed (cf. Schmitt & Hewitt, Reference Schmitt and Hewitt2004, and references therein); but, nevertheless, some insect species in which all allozyme loci are monomorphic are known (cf. Graur, Reference Graur1985). In general, genetic poverty, as found in our study, is observed in species with (i) rather restricted distributions, (ii) small population sizes and/or (iii) strongly isolated habitat patches (e.g. Britten et al., Reference Britten, Brussard, Murphy and Austin1994; Debinski, Reference Debinski1994; Descimon, Reference Descimon1995; Marchi et al., Reference Marchi, Addis, Hermosa and Crnjar1996; Gadeberg & Boomsma, Reference Gadeberg and Boomsma1997; Bereczki et al., Reference Bereczki, Pecseny, Peregovits and Varga2005; Haubrich & Schmitt, Reference Haubrich and Schmitt2007; Habel et al., Reference Habel, Zachos, Finger, Meyer, Louy, Assmann and Schmitt2009). Such a low genetic diversity of the populations might be the result of an adaptation process to these specific conditions. As the global distribution of N. speciosa is wide and individual populations frequently large (up to thousands of individuals) (Bernard & Wildermuth, Reference Bernard and Wildermuth2005a), the patchy and non-continuous occurrence of the species' habitats might explain the quite low genetic diversity of the species. However, numerous individual populations are also small (Bernard & Wildermuth, Reference Bernard and Wildermuth2005a), and some currently large populations may originate from rare colonists. Therefore, the combined effect of non-continuous habitats and small (at least initially) populations might be the reason for this genetic pattern. Nevertheless, the initial postglacial colonisation of Poland and Lithuania most probably originated from a genetically poor pool of populations, otherwise the overall and similarly low genetic diversity over all our study area cannot be properly explained. Thus, the observed genetic poverty of N. speciosa populations in eastern Central Europe might represent the typical population genetic constitution for this region.
To date, only few allozyme analyses are available for odonates. Therefore, it is unknown whether low allozyme diversity is a common feature in this insect group. However, allozyme analyses for Coenagrion scitulum (Carchini et al., Reference Carchini, Chiarotti, di Domenico, Mattoccia and Paganotti2001) and Lestes viridis (de Block et al., Reference de Block, Geenen, Jordaens, Backeljau and Stoks2005) showed relatively high genetic diversity of the loci, which include many of the loci also analysed for N. speciosa. Nevertheless, the genetic diversities obtained for N. speciosa are rather low if compared against other insects in general (Graur, Reference Graur1985) or the well-studied group of butterflies in particular (Schmitt et al., Reference Schmitt, Varga and Seitz2005b; Schmitt & Haubrich, Reference Schmitt and Haubrich2008; Schmitt & Besold, Reference Schmitt and Besoldin press).
Genetic diversity patterns are often correlated with different ecological and population dynamic parameters (e.g. Ramirez & Saunders, Reference Ramirez and Saunders1999; Luijten et al., Reference Luijten, Dierick, Gerard, Oostermeijer, Raijmann and Den Nijs2000; Schmitt et al., Reference Schmitt, Cizek and Konvicka2005a; Louy et al., Reference Louy, Habel, Schmitt, Meyer, Assmann and Müller2007). However, in the analysed N. speciosa populations, no influence of the size, structure (i.e. degree of fragmentation/isolation) and type of habitat on the genetic diversities was detected. Therefore, these environmental parameters obviously have had no important impact on the population genetic structure of this species, thus distinguishing N. speciosa from many other habitat specialists.
The rather low differentiation among the N. speciosa populations categorizes all of them into the same evolutionary significant unit (ESU) (cf. Dennis & Schmitt, Reference Dennis, Schmitt, Settele, Shreeve, Konvicka and van Dyckin press). Therefore, one common evolutionary root, not older than the late Würm glaciation or the postglacial period (i.e. not older than 12 to 25 ky), has to be assumed (cf. Schmitt, Reference Schmitt2007). The differentiation among all populations is so weak that they might even represent one single management unit (MU), with the possibility that the strongly isolated southeastern Broduszurki population represents a second one. As isolation by distance explained only about 10% of the variance for genetic distances (Nei, Reference Nei1972) and was not significant for pairwise F ST values, geographic distance has a low or even no impact on the genetic structure in the study area; and the subsequent reduction of gene flow with increasing geographic distances is only marginally or not contributing to the genetic structure of N. speciosa in eastern Central Europe.
The central position in the neighbour-joining tree of the Lithuanian sample (geographically representing the most lateral population in our sampling design) in all analyses performed might be due to (i) the less isolated habitats of this species in Lithuania (Bernard & Wildermuth, Reference Bernard and Wildermuth2005a) and, thus, reduced impact of genetic drift in these more continuous populations and/or (ii) an eastern biogeographical origin of N. speciosa (cf. de Lattin, Reference de Lattin1967). On the other hand, the only somewhat genetically differentiated population is represented by the highly isolated marginal Broduszurki sample from southeastern Poland. Thus, the geographic position of a population, being more central or peripheral in relation to the global distribution, seems to influence the genetic composition of a population only to a limited degree.
Conservation implications
In contrast to numerous other examples (Frankham et al., Reference Frankham, Ballou and Briscoe2002; Hansson & Westerberg, Reference Hansson and Westerberg2002; Reed & Frankham, Reference Reed and Frankham2003; Schmitt & Hewitt, Reference Schmitt and Hewitt2004), the low genetic diversity does not negatively influence the census size of the frequently large local populations of N. speciosa. A similar situation was also observed in the sometimes super-abundant burnet moth species Aglaope infausta (Schmitt & Seitz, Reference Schmitt and Seitz2004). As the population genetic structure is very similar among all populations analysed (i.e. low F ST values and low genetic distances among populations), N. speciosa seems to own a genetic pre-adaptation to survive in almost completely isolated habitat patches for long periods of time. Similar degrees of genetic poverty were also obtained from other insect species living in naturally strongly fragmented landscapes, as e.g. Maculinea butterflies (Gadeberg & Boomsma, Reference Gadeberg and Boomsma1997; Bereczki et al., Reference Bereczki, Pecseny, Peregovits and Varga2005), the butterfly Parnassius apollo vinningensis (Habel et al., Reference Habel, Zachos, Finger, Meyer, Louy, Assmann and Schmitt2009) or the ground beetle Carabus variolosus (Matern et al., Reference Matern, Desender, Drees, Gaublomme, Paill and Assmann2009). However, this low genetic diversity of the species as a whole might correspond with its very low ecological plasticity not allowing the individuals to survive under changing environmental conditions, e.g. due to human impact, extreme weather situations and climate change (Bernard & Wildermuth, Reference Bernard and Wildermuth2005a). This low ecological plasticity and its consequences are mirrored in the European part of N. speciosa distribution where the species has become extinct or is near extinction in many areas, especially in the western and southern parts of its range (Bernard & Wildermuth, Reference Bernard and Wildermuth2005a).
In the light of the ecological and genetic potential of this species, selected conservation measures, i.e. selected habitat-based actions, should get priority. Among them, the full preservation of primary habitats and their immediate surroundings (as buffer forest zones) should be ensured first. The creation and restoration of secondary habitats can play only a supporting role. Conservation efforts should be focused on populations where extinction due to stochastic non-anthropogenic effects is rather unlikely. This orientation arises from the fact that N. speciosa represents one ESU (and only one or two MUs) in eastern Central Europe. Therefore, focusing on vanishing ESUs, being of high importance in many other species, is pointless in N. speciosa. The relative homogeneity also eases reintroductions or supplemental stocking of populations. As N. speciosa is a species with very low dispersal ability (Bernard & Wildermuth, Reference Bernard and Wildermuth2005a), it is likely that a large number of potential habitats have never been reached by the species or that this dragonfly became extinct there and these habitats have never been recolonized. Therefore, if necessary, it might be useful to transplant individuals from very large populations to seemingly optimal habitats of the species to safeguard its survival in eastern Central Europe. The species' genetic structure in these cases will not be an obstacle for such conservation measures. Due to the high genetic homogeneity, populations being donors of individuals do not necessarily have to neighbour potential new sites.
Obviously, the decline of N. speciosa in Central Europe has not been caused by genetic impoverishment of the respective populations. Furthermore, fragmentation and isolation of habitats seem not to represent key factors in the observed decline of the species. These factors might negatively influence populations only in the case of stochastic extinctions due to the reduction or loss of recolonization capacity. Moreover, even the size of the habitats is of minor importance for the survival of the populations. Thus, habitat quality, apparently, is by far the most important factor for the long-term preservation of the species over major parts of Europe and, therefore, needs a strong conservation effort (cf. Bernard & Wildermuth, Reference Bernard and Wildermuth2005a).
Acknowledgements
We thank the Polish Ministry of the Environment for the permission to sample N. speciosa in Poland, the Forschungsfonds of Trier University for the financial support for the allozyme electrophoresis and the Faculty of Biology of Adam Mickiewicz University in Poznan, Poland, for co-financing the field works. We are grateful to Robert Kippen and Steve Cham for language checking and Boguslaw Daraz for drawing a map.