

1. Introduction and Background
Recent years have witnessed increased use in Nordic societies of computer-mediated communication modalities such as instant messaging apps, pseudo-anonymous image boards, or social media platforms such as Facebook and Twitter (NRK 2015, Audience Project 2016, Christensen Reference Christensen2017, Sperstad Reference Sperstad2018). At the same time, local environments in the Nordics have become more bilingual with English and/or multilingual, due to educational policies, the availability of foreign-language media, international mobility, and demographic shifts, among other reasons (Björklund, Björklund & Sjöholm Reference Björklund, Björklund and Sjöholm2013, Linn Reference Linn and Linn2016, OECD 2018). The shift towards increased use of English evident in most domains in Nordic societies (Görlach Reference Görlach2002, Linn Reference Linn and Linn2016) necessitates investigation into its prevalence and extent as well as the contexts in which English will be used rather than a local language, but to date, few or no studies have collected large samples of naturally occurring multilingual language data from the Nordics in order to analyse language choice. In situations in which language shift is underway, gender-based differences are frequently evident (Labov Reference Labov1990, Reference Labov2001; Trudgill Reference Trudgill1998); thus, an analysis of language choice according to gender may shed light on incipient language shift.
In this study, data from the social media platform Twitter is used to analyze language choice, bilingualism with English, and multilingualism in the Nordic countries and territories according to national location and user gender. Language on a social media platform is not necessarily representative of overall patterns of use, and the national languages in the Nordics are not in danger of disappearing, whether in online or in other contexts. Nevertheless, a high degree of linguistic diversity can be demonstrated for Twitter in the Nordics, and bilingualism with English is the norm. In terms of male and female language choice, differences are apparent, particularly with regard to the use of English by presumed native (L1) Nordic speakers.
Work in the sociolinguistic tradition has proposed a link between gender identity and the frequency of use of phonological, lexical, or grammatical features, with females found to make more use of features that index standardness and prestige (e.g. Trudgill Reference Trudgill1974, Reference Trudgill1998; Labov Reference Labov1990, Reference Labov2001; Cheshire Reference Cheshire, Chambers, Trudgill and Schilling-Estes2002). A similar gender-based pattern is evident for some types of language shift: sociolinguistic fieldwork and survey data have been used to show that males and females can have different attitudes to languages in diglossic environments, with females typically showing a more positive orientation towards the more prestigious, supra-local language (Gal Reference Gal1979, Bilaniuk Reference Bilaniuk2003, Lai Reference Lai2007, Smith-Hefner Reference Smith-Hefner2009). To date, there have been relatively few large-scale corpus-linguistic studies in which gender, extent of bi- or multilingualism, and language choice have been analyzed, and none for the Nordic countries. Access to online language use via the APIs (i.e. Application Programming Interfaces – for websites, endpoints from which users can consume data) of social media sites can remedy this deficit. This study investigates online bi- and multilingualism in the Nordic countries by means of a quantitative analysis of Twitter messages. Three principal research questions are posed:
(i) How does the use of national languages, English, and other languages vary according to national context in the Nordics?
(ii) Which languages are more used by males and females?
(iii) To what extent are females and males in the Nordic countries/territories bi- or multilingual on the platform?
It can be demonstrated that the official languages of the region and English play central roles in connecting persons within the Nordic countries and territories on the Twitter platform, but gender-based differences in language preference and bi- or multilingualism are evident. These can be interpreted in light of demographic and sociolinguistic factors.
The paper is organized as follows: In Section 2, some previous work pertaining to the language situation of the Nordic countries (especially in regards to English), language choice and gender, and language diversity, bi- and multilingualism on Twitter is reviewed. In Section 3, a description of the methods used for the collection and filtering of Twitter data is provided: Following an outline of the metadata structure of a tweet, methods for source filtering, location inference, gender inference, and language detection are described. In Section 4, the results are presented: First, aggregate language use by country/territory and gender is considered. Second, the tendency for females and males to use a particular language is quantified using an odds ratio. A subset of the data provides insight into active bilingualism with English by users whose presumed L1 is a Nordic language. Third, the proportion of users who are bi- or multilingual is calculated by country/territory and gender. Section 5 interprets the findings for the Nordic languages and for English in terms of sociolinguistic factors, and for other languages in terms of migration statistics, using data from the Organization for Economic Co-operation and Development (OECD). A moderately strong correlation between gendered migration and gendered language preference is found. In the conclusion (Section 6), some caveats are offered, as well as suggestions for future work.
2. Previous Work
Many inhabitants of the Nordics are essentially bilingual with English, and research into English use in the Nordics has investigated its status as a lingua franca, the extent of its use in various media or communicative contexts, and speakers’ attitudes towards its use, mainly on the basis of survey data (an overview of some of the literature is provided in Linn Reference Linn and Linn2016). For example, in Iceland, the majority of Icelanders are exposed to English every day, while 21% of Icelanders report speaking English daily (Arnbjörnsdóttir Reference Arnbjörnsdóttir, Sigurgeirsson, Ásgeir and Marinósson2011). Younger Icelanders and Faroese have developed a bilingual identity (Jeeves Reference Jeeves2011, Mortensen Reference Mortensen2011). Norwegians are reported to be essentially diglossic (Rindal Reference Rindal2010, Rindal & Piercy Reference Rindal and Piercy2013). By 1999, 47% of Danes reported using English at least once a month, and in 2003, 90% of Danes aged 15–21 reported using English at least once a week (Preisler Reference Preisler1999, Andersen Reference Andersen2004, both cited in Lønsmann Reference Lønsmann2009:1139). For Sweden, Bolton & Meierkord (Reference Bolton and Meierkord2013:93) attest that while Swedish remains the ‘preferred language … in most domains’, English is dominant in academia and business. Similar findings are reported for Finland in the results of an extensive survey of the use of English in the country: English has become ‘a language used in many domains and settings within Finnish society’ (Leppänen et al. Reference Leppänen, Pitkänen-Huhta, Nikula, Kytölä, Törmäkangas, Nissinen, Kääntä, Räisänen, Laitinen, Koskela, Lähdesmäki and Jousmäki2011:16).
Insight into the role of English in the Nordics is provided by the MIN project (Moderne importord i språka i Norden [Modern import words in the languages of the Nordic countries]), a series of qualitative and quantitative studies that investigated the prevalence of (mostly English) loanwords in Nordic languages as well as attitudes of language users (Sandøy Reference Sandøy2003a, b, Vikør Reference Vikør2003, Kristiansen & Sandøy Reference Kristiansen and Sandøy2010). A survey-based study found that compared to Swedes, Danes, and Finns, Icelanders and Norwegians have slightly more negative attitudes towards the ‘influx of English’ and the use of English words in local languages, although higher-status social groups have more positive attitudes towards English in all the Nordic countries (Thøgersen Reference Thøgersen2004, see also Graedler Reference Graedler2014). In terms of attitudes towards the local national languages, western and eastern peripheries of the Nordics (Iceland, the Faroes, Swedish-speaking Finland and Finland) exhibit more linguistic purism, while Norway, Denmark, and Sweden show more openness to integration of foreign-language material (Kristiansen & Sandøy Reference Kristiansen and Sandøy2010).
2.1 Language and gender
Relationships between language use and gender identity have been extensively researched in the fields of sociolinguistics, education, sociology, and computational linguistics. Early studies, for example Lakoff (Reference Lakoff1973), posited a ‘deficit hypothesis’ in which gender differences in language use could be understood as reflecting the different social status of females and males. Some early studies in this tradition were based not on empirically collected data, but researcher intuition. Much research has been conducted upon gender-based differences in language use in the tradition of the classic variationist sociolinguistic paradigm (for an overview, see Cheshire Reference Cheshire, Chambers, Trudgill and Schilling-Estes2002), but research into language choice according to gender has not been as extensive.
Measures of use and attitudes towards local and non-local languages or language varieties have shown gender differences, with females typically more open to non-local languages. Gal (Reference Gal1979) reported higher male bilingualism in a study of a traditionally Hungarian-speaking community in Austria as a result of females having already shifted towards the language with higher prestige in the supra-local national environment (in this context, German). Woolard (Reference Woolard1997) studied social networks and language choice among bilingual (Spanish–Catalan) high school students in Barcelona, and found that females tended to have more homogenous networks than males, and hence lower rates of active bilingualism. Bilaniuk (Reference Bilaniuk2003) found that females in Ukraine exhibited more positive attitudes towards the use of Russian and English compared to males, who exhibited more positive attitudes towards the use of Ukrainian. The finding was interpreted as indexing the languages’ relative usefulness in terms of economic and social advancement. In a similar manner, Smith-Hefner (Reference Smith-Hefner2009) reported young women in Java, Indonesia, to be more likely than young men to use the standardized national Indonesian language rather than Javanese. In a study of attitudes towards local and foreign languages among 1,048 pupils in Hong Kong, Lai (Reference Lai2007) found females to have more positive attitudes towards the supra-local languages Mandarin and English, and males to have more positive attitudes towards the local language Cantonese.
Survey-based research provides some insight into knowledge and use of foreign languages according to gender in the Nordic countries. The Adult Education Survey of the European Union was conducted in 2007, 2011, and 2016 (European Commission 2018). In 2016, survey respondents were asked to report how many foreign languages they knew. The percentage of males and females reporting knowledge of at least one foreign language was similar according to gender in the Nordic countries (Norway males 92.1%, females 92.1%; Denmark males 95.3%, females 96.3%; Sweden males 96.4%, females 96.8%; Finland males 89.4%, females 94.7%). In an additional question, respondents were asked to rate their proficiency in their best-known foreign language. Possible responses were ‘basic’, ‘good’, and ‘proficient’. For males, the percentages of those reporting ‘proficient’ knowledge of the best-known foreign language were 47.6% for Norway, 44.4% for Denmark, 61.8% for Sweden, and 37.4% for Finland. For females, the corresponding percentages were 44.8%, 37.9%, 57.5%, and 31.0%.
In Finland, detailed information about reported knowledge and use of English and other languages is available in Leppänen et al. (Reference Leppänen, Pitkänen-Huhta, Nikula, Kytölä, Törmäkangas, Nissinen, Kääntä, Räisänen, Laitinen, Koskela, Lähdesmäki and Jousmäki2011). Finnish males are more likely than females to consider themselves bi- or multilingual, while Finnish females are more likely to consider themselves monolingual (2011:Table 6a.1; however, the p-values for these differences suggest that they are not significant). Female Finns are more likely than male Finns to consider themselves fluent speakers, writers and readers of English, as well as report being able to understand spoken English without problems (2011:Tables 22a.1, 22b.1, 22c.1, 22d.1). However, males are more likely to report reading various genres of English-language texts, such as newspapers, magazines, comics, professional literature, web pages, manuals, and emails. Females report more reading of fiction and other literature in English (2011:Table 28.1).
2.2 Twitter language and multilingualism
Studies of computer-mediated communication, for example language use on Twitter, have investigated phenomena such as the discourse functions of hashtags (Wikström Reference Wikström2014, Squires Reference Squires, Georgakopoulou and Spilioti2015), lexical innovation (Eisenstein et al. Reference Eisenstein, O’Connor, Smith and Xing2014), African American Vernacular English (Jørgensen, Hovy & Søgaard Reference Jørgensen, Hovy, Søgaard, Xu, Han and Ritter2015), grammatical variation in English-language Twitter from Finland and the other Nordic countries (Coats Reference Coats and Squires2016, Reference Coats, Säily, Hiltunen and McVeigh2017a, b), or the interaction between demographic parameters such as gender with lexical and grammatical features in American English (Bamman, Eisenstein & Schnoebelen Reference Bamman, Eisenstein and Schnoebelen2014).
Gender can usually be identified in a straightforward manner when directly observing speakers or working with survey data in which respondents report their gender, but for much computer-mediated communication data, the self-identified gender of a particular user is not necessarily made explicit. The Twitter platform does not provide a metadata field in which users are asked to specify their gender. In such cases, algorithms may be applied in an attempt to automatically identify author gender (or other identity parameters). Tweets from authors who have been manually annotated for gender can be used to train classifiers (Rao et al. Reference Rao, Yarowsky, Shreevats, Gupta, Carlos, Cortizo, Carrero, Cantador and Rosso2010, Kokkos & Tzouramanis Reference Kokkos and Tzouramanis2014, Volkova et al. Reference Volkova, Bachrach, Armstrong, Sharma, Bonet and Koenig2015). Burger et al. (Reference Burger, Henderson, Kim, Zarrella, Barzilay and Johnson2011) classified user gender on the basis of text from blogs linked in tweet metadata. Gender can also be identified by comparing a Twitter user’s ‘author name’ metadata with name frequencies according to gender in governmental records (Mislove et al. Reference Mislove, Lehmann, Ahn, Onnela, Rosenquist, Nicolov and Shanahan2011) – such an approach is applied in this study. Some recent work has acknowledged social constructionist approaches by noting that while gender can be identified as a binary, category membership based on shared topics may better model the ways in which users represent themselves online (Bamman et al. Reference Bamman, Eisenstein and Schnoebelen2014).
In the context of the study of online language variation and linguistic diversity, many studies have examined individual practices or those of a handful of users, but large-scale approaches are relatively few. As Lee (Reference Lee, Georgakopoulou and Spilioti2016:128) has noted, many studies ‘tend to follow the discourse analytic or interactional sociolinguistic approach’. Examples of Nordic-oriented studies along these lines include Leppänen et al. (Reference Leppänen, Pitkänen-Huhta, Piirainen-Marsh, Nikula and Peuronen2009), Stæhr & Madsen (Reference Stæhr and Madsen2014), or Kytölä & Westinen (Reference Kytölä and Westinen2015).
While few corpus-based studies of multilingual social media have been undertaken using Nordic data, multilingualism on Twitter has been addressed in the research literature. Several studies bear upon the present research in terms of their methodology, primarily in that they analyse patterns in large corpora of Twitter language. Such studies can give insight into the linguistic behavior of groups of users at a macro level, or demonstrate how languages themselves are utilized as resources in multilingual, global contexts. Hong, Convertino & Chi (Reference Hong, Convertino and Chi2010) found different patterns of hashtag, username, and URL use, as well as retweets and responses to others according to language community. They showed that language communities on Twitter differ in their aggregate behavior, with, for example, Korean language users much more likely than Indonesian language users to reply to tweets by others. Ronen et al. (Reference Ronen, Gonçalves, Hu, Vespignani, Pinker and Hidalgo2014) compared the worldwide influence of languages by analyzing networks of bi- and multilingual book translations, Wikipedia author editors, and Twitter users, and found that English plays an important central role. Hale (Reference Hale, Jones and Palanque2014) investigated global multilingual networks on Twitter, including the network associations of retweets and user mentions, and found that while most interaction networks are language-based, and English is the most important single mediating language, other languages collectively represent a larger bridging force. Graham, Hale & Gaffney (Reference Graham, Hale and Gaffney2014) found that for tweets containing GPS metadata collected globally, automatic language detection is not always accurate, and user location as indicated in the user profile does not always correspond to GPS metadata. Eleta & Golbeck (Reference Eleta and Golbeck2014) examined the tweets of 92 multilingual Twitter users and showed that their language choice on Twitter reflects the predominant language of their social networks. While it has been found that users of less represented languages are more likely to switch languages and that English has become the central mediating language, the interaction of multilingualism with gender in a large social media data set has not yet attracted research attention.
Establishing the bi- or multilingualism of a social media user can be difficult: Online, users may make more use of different languages than they do in face-to-face spoken interaction, or they may consume social media content in a second or third language, but not actively author posts in that language. In this study a bi- or multilingual user is defined by setting a quantitative cutoff based on an active-use criterion that is in line with Grosjean’s (Reference Grosjean, K. Bhatia and Ritchie2008:34) broad definition of of a bilingual as someone who ‘uses two (or more) languages (or dialects)’. The criterion is described in Section 4.
3. Data and Method
Twitter provides various endpoints to its APIs. Default access to the Streaming API, which returns tweets as they are broadcast in real time, is 1% of the data stream volume, although commercial partners can gain access to higher data volumes. In order to create a corpus of ‘seed’ data from which Nordic users could be identified, tweets with ‘place’ metadata were collected globally from the default Streaming API from November 2016 to June 2017 using the Python module Tweepy (Roesslein Reference Roesslein2015). Retweets were excluded. The metadata of these tweets (approximately 653 million) were matched with regular expressions for Nordic locations and male and female names (see below). User timelines (up to 3,250 tweets) of matching users were then downloaded from the Twitter REST API in November 2017 for users who could be located within the Nordic countries and assigned gender.
3.1 Filtering and localization
Some tweets are generated automatically by apps or bots that interact with the Twitter APIs (Haustein et al. Reference Haustein, Bowman, Holmberg, Tsou, Sugimoto and Larivière2015). Messages sent by apps and bots, which often include automatically generated text content, were filtered using the ‘source’ metadata field to exclude tweets not sent by the eight following apps: Twitter Web Client, Twitter for iOS, Twitter for iPhone, Twitter for Android, Twitter for Windows Phone, Twitter for Instagram, Tweetbot for iOS, and Tweetbot for iPhone. Tweets with these sources collectively comprised over 87% of the Nordic tweets overall.
Tweet metadata can include three types of location information. Many Twitter users provide their home location in the ‘location’ field within the ‘user’ entity upon registering their profile. The value can be any sequence of Unicode characters, and can be changed at any time. Tweets composed on GPS-enabled devices such as smartphones can contain ‘geo’ metadata: latitude–longitude coordinates corresponding to the exact location of the device when the tweet was broadcast. In order to broadcast exact location with tweets, a user must activate this option. The third type of location metadata is the ‘place’ field. When composing a tweet, a user can optionally choose to add a ‘place’ to a tweet by clicking on a button adjacent to the text input window. The button returns a list of place names based on the IP address of the service being used to access Twitter, or the user can select a place from Twitter’s internal place dictionary, which is accessed via text input. ‘Place’ metadata is a type of point-of-interest metadata used by many online services (for more information, see Hochmair et al. Reference Hochmair, Juhász, Cvetojevic, Kiefer, Huang, Van de Weghe and Raubal2018). Twitter ‘place’ metadata contains a place name, a country code and country name, and an array of the four latitude–longitude coordinates which form the boundaries of the box that encloses the place in geographical space.
Relying on a single type of place metadata can pose methodological problems: Relatively few tweets contain the ‘geo’ or ‘place’ metadata (Leetaru et al. Reference Leetaru, Wang, Cao, Padmanabhan and Shook2013, Laylavi, Rajabifard & Kalantari Reference Laylavi, Rajabifard and Kalantari2016), and the values of these metadata fields, when present, may not correspond to a user’s home location, for example because the user is travelling or has tagged a tweet with a ‘place’ to indicate tweet topic, not user location (e.g. ‘There has been an earthquake in Japan’, ‘The Eurovision song contest was in Stockholm’). Users can also select ‘place’ values for humorous or other reasons. Footnote 1 Inducing geolocation using more than one type of location metadata can achieve higher precision compared to relying on the ‘place’ attribute or exact geolocation alone (Schulz et al. Reference Schulz, Hadjakos, Paulheim, Nachtwey, Mühlhäuser and Kiciman2013, Ajao, Hong & Liu Reference Ajao, Hong and Liu2015).
For these reasons, a multi-step method was used to infer user location. First, the location field in the ‘user’ entity of each tweet in the seed data was matched using a dictionary of 1,627 place names in the Nordic nations and territories of Greenland, Iceland, the Faroe Islands, Norway, Denmark, Sweden, Åland, and Finland (available at https://github.com/stcoats/Nordic-Place-Names/). For each country or territory, a list of all the municipalities of the country (e.g. ‘Oslo’, ‘Helsinki’) and sub-country-level units of administration according to ISO 3166 (e.g. ‘Norðoyar’, ‘Skåne’), were combined with the names of the countries/territories in English and the principal Nordic languages. For Finnish places with more than one official language, all official place names for that locality were collected (i.e. in Finnish, Swedish, and Sámi).
Some places in the Nordics have names that can also refer to other places: For example, Alta is the name of a town in Norway, but also a place in Utah, United States. Gran is likewise a place in Norway, but also an element in the name of the Spanish island Gran Canaria. To prevent false positives, such items were modified in the list by specifying the Nordic country or territory in the regex (e.g. Gran was changed to Gran, Norway; Gran, Norge; Gran, Noreg; and Gran, Norja). Tweets producing matches were then identified for author gender. Gendered tweets with consistent ‘location’ and ‘place’ metadata were retained.
3.2 Gender identification
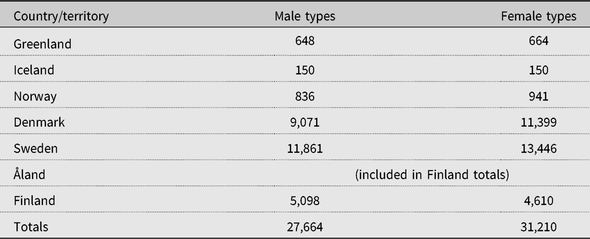
In the next step, the gender of users with a Nordic place location in the ‘user’ metadata was identified on the basis of name frequency information provided by the statistical offices of the Nordic countries (Statistics Greenland 2017; Statistics Iceland 2017; Danmarks Statistik 2015a, b; Statistics Norway 2017a, b; Statistics Sweden 2016; Avoindata.fi. 2017). Name and gender frequency information was obtained for 58,874 given names from Greenland, Norway, Denmark, Sweden, and Finland. For Greenland, the list consisted of all names assigned at least five times in total to male or female newborns in the years 1910–2011. For Iceland, name lists of the most frequent single and double names in 2017, 2016, and 2008 were aggregated. For Norway, the list consisted of all names assigned to male or female newborns at least four times in the years 2008–2017 or 2006–2017, respectively. For Denmark, the list consisted of all names occurring four or more times in the registered population of Denmark as of 1 January 2016. For Sweden, all names occurring at least 10 times in the resident population for each of the years 1999–2015 were available. For Finland, the list consisted of all names occurring at least 10 times in the resident population in September 2017. Due to differences in collecting and publishing name information, the number of names available from each country or territory (summarized in Table 1) is quite variable. For example, there are fewer Icelandic names than Greenlandic names, despite Iceland’s larger population – this is because the Greenland list is more comprehensive, covering 100 years compared to three select years. In addition, the freely available name data from Iceland consists only of the most frequent names – access to more extensive data requires payment. Similarly, there are far fewer Norwegian names than Danish, Swedish, or Finnish names. This is because the Norwegian data considers only names with a minimum frequency among newborns per year, for a ten-year period, while the Danish, Swedish, and Finnish data includes names with a minimum frequency in the entire populations – a rare name may not be assigned to a newborn more than four times a year in Norway, but the sum of all living persons who have a rare name can easily be much more than four.
Summary of name identification data.

For each country, the probability that a name in the records is male or female was calculated by dividing the number of times the name was assigned to one gender by the total number of occurrences of the name in the statistical data. Footnote 2 Names that were female or male with a probability of ≥ .8 were retained in the name set for that country. To create the name lists for the Nordic region, the country name lists were aggregated by gender. Duplicates and names occurring in both male and female lists were removed. In total, this resulted in non-overlapping lists of 17,856 names given to females and 15,406 names given to males. This resource is available at https://github.com/stcoats/Nordic-Name-Data.
For each unique user from the seed data who matched a Nordic user location, the value in the ‘author name’ metadata field was matched against the aggregate Nordic name lists using a case-insensitive regular expression. Footnote 3 Author names that did not match the regex (e.g. ‘Acme Customer Service’ or ‘sverigetjej2018’) were filtered out. For the matches, user timelines (up to 3,250 tweets) were downloaded from the Twitter REST API. In a final geographical filtering step, each user’s tweets were aggregated according to the country of the ‘place’ metadata. Only users whose ‘place’ metadata matched the ‘location’ metadata in the ‘user’ entity at the country level were retained for the analysis. Particularly for the Nordic countries/territories with smaller populations, this filtering step may be necessary in order to counteract the influence of short-term visitors such as tourists in the signal.
3.3 Language determination
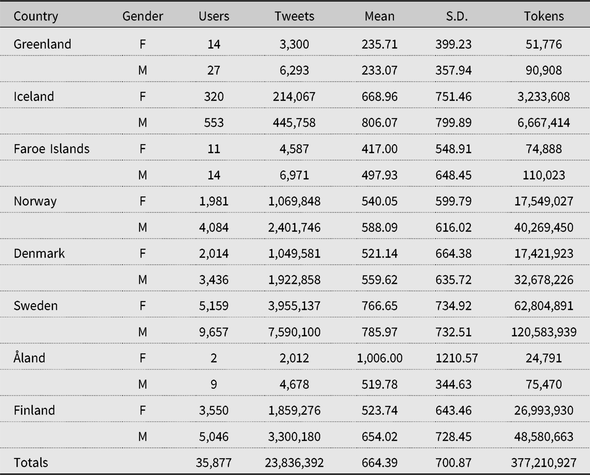
A consideration of bi- and multilingualism on the Twitter platform critically depends on accurate language detection, but automatic methods present difficulties due to short message length, non-standard orthography, and language mixture. Character sequences in URL addresses, usernames, and hashtags, as well as emoji characters, can create problems for automatic language detection algorithms, as they rarely correspond to character sequences in the lexicons of natural languages. Since March 2013 tweets contain automatically detected language metadata in the ‘lang’ metadata (Twitter 2013). Some languages are inaccurately detected with high frequency: For example, the Twitter algorithm labels a large number of messages from Nordic data as having been written in kreyól ayisien, or Haitian Creole, including messages such as Hlaupabòlustelpan ad horfa à Dòru or Oh yes Griezmann I love you?? #FRAGER. (see Zubiaga et al. Reference Zubiaga, Vicente, Gamallo, Pichel, Alegria, Aranberri, Ezeiza and Fresno2016). One method for reducing inaccurate language assignation is to compare the results of two different algorithms – accurate identification is likelier when the algorithms are in agreement (Twitter 2015). For an analysis of language use in Nordic contexts, Twitter’s native language detection algorithm is also unsuitable as it does not detect Faroese or Kalaallisut (Greenlandic), as of late 2017. For these reasons, a multi-step approach was taken: First, tweet texts were stripped of usernames, hashtags, emoji characters, and URL addresses. Language was then detected using an implementation of cld2 (compact language detector 2), an algorithm developed for Google’s Chrome browser (Sites Reference Sites2013, see also Lui & Baldwin Reference Lui, Baldwin, Farzindar, Inkpen, Gamon and Nagarajan2014). Tweets for which Twitter’s algorithm agreed with cld2 were retained; others were discarded. Tweets detected as Faroese or Kalaallisut (Greenlandic) by cld2 were assigned that language. Tweets identified by cld2 as Norwegian Nynorsk were assigned the code for Norwegian. A manual test of a random selection of tweets showed that the method results in highly accurate language detection. Tokenization was undertaken using the NLTK Twitter Tokenizer (Bird, Loper & Klein Reference Bird, Loper and Klein2009), the Jieba tokenizer for Mandarin (Sun Reference Sun2014) and the Tiny Segmenter for Japanese (Hagiwara Reference Hagiwara2014). A summary of the Nordic data collected using the methods described above is shown in Table 2.
Summary statistics.

4. Results
The data were analyzed according to country or territory and gender in terms of overall language use, preference for particular languages, and prevalence of bi- and multilingualism.
4.1 Aggregate language use by country and gender
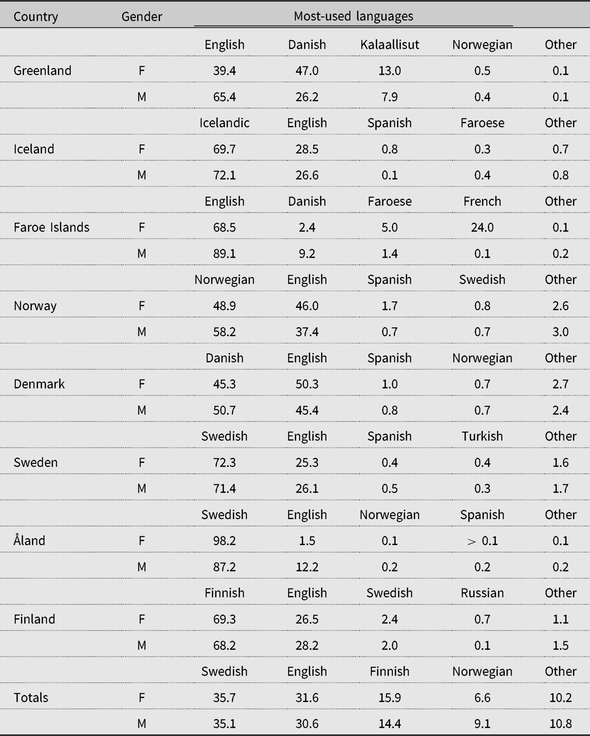
In the first set of results, the proportion of tweets by language was calculated according to country/territory and gender. Aggregate language use according to gender is summarized for the four most-used languages per country/territory in Table 3.
Percentage of tweets in the four most-used languages by country/territory and gender.

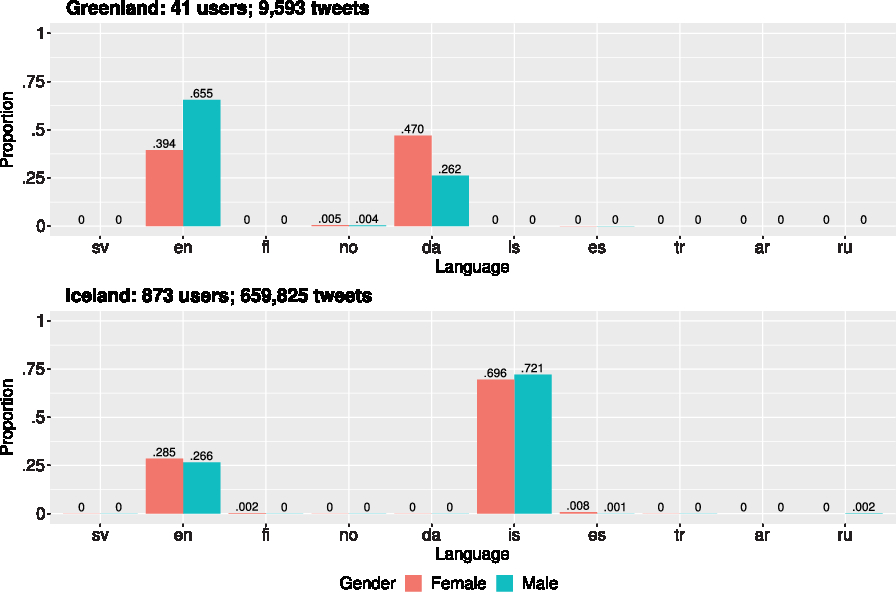
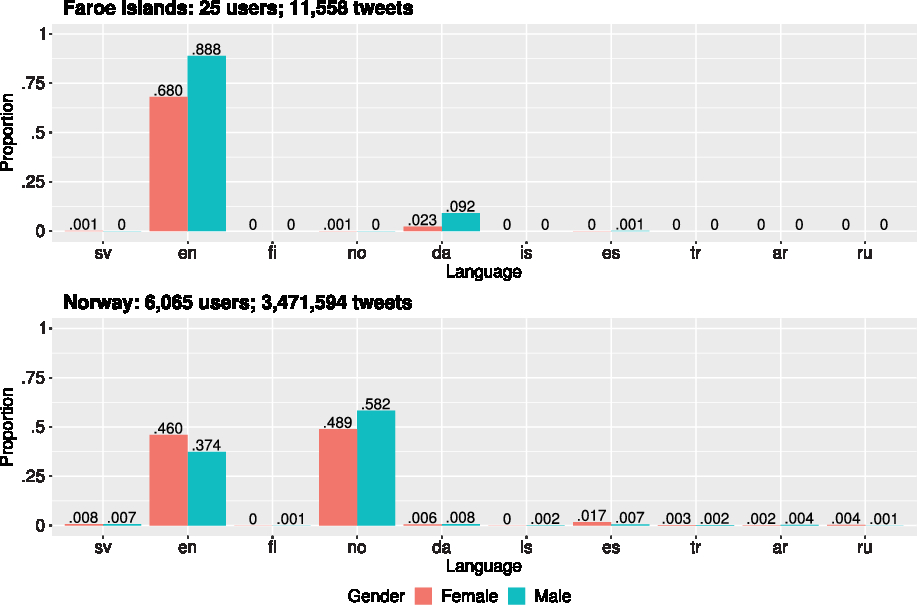
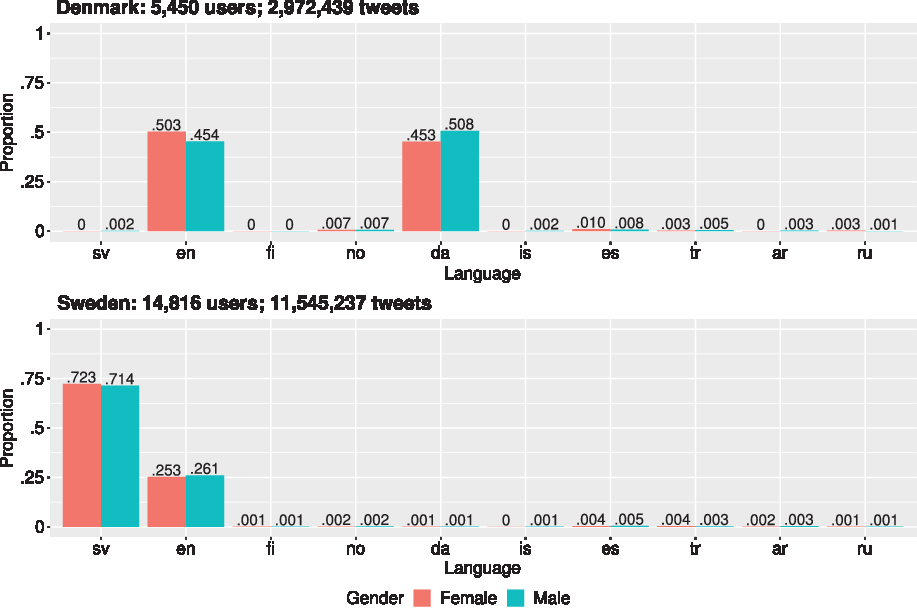
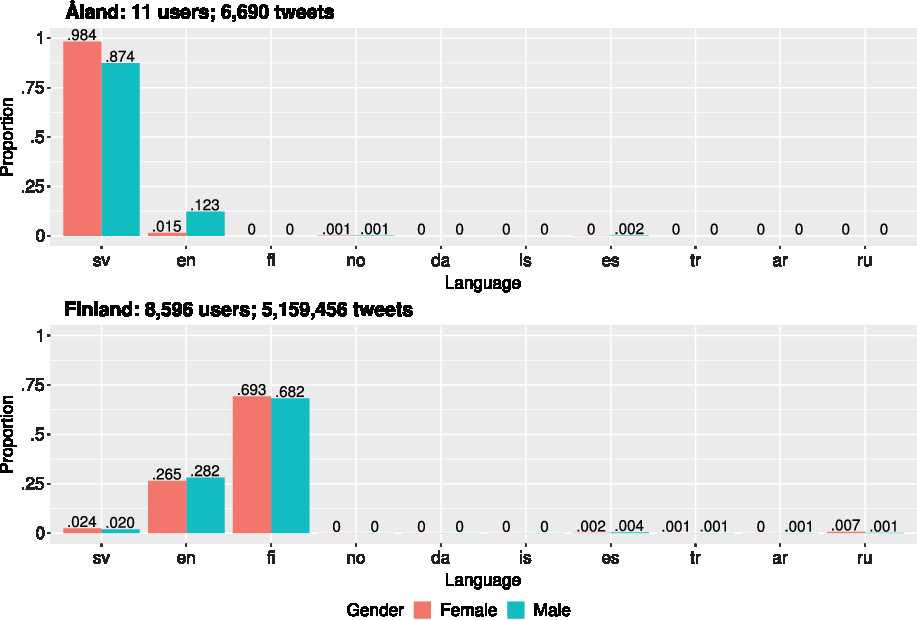
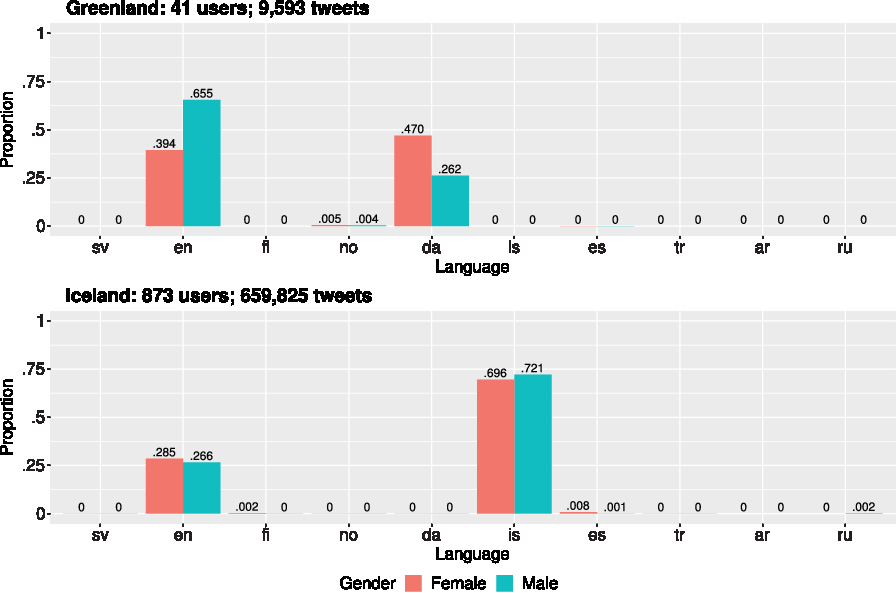
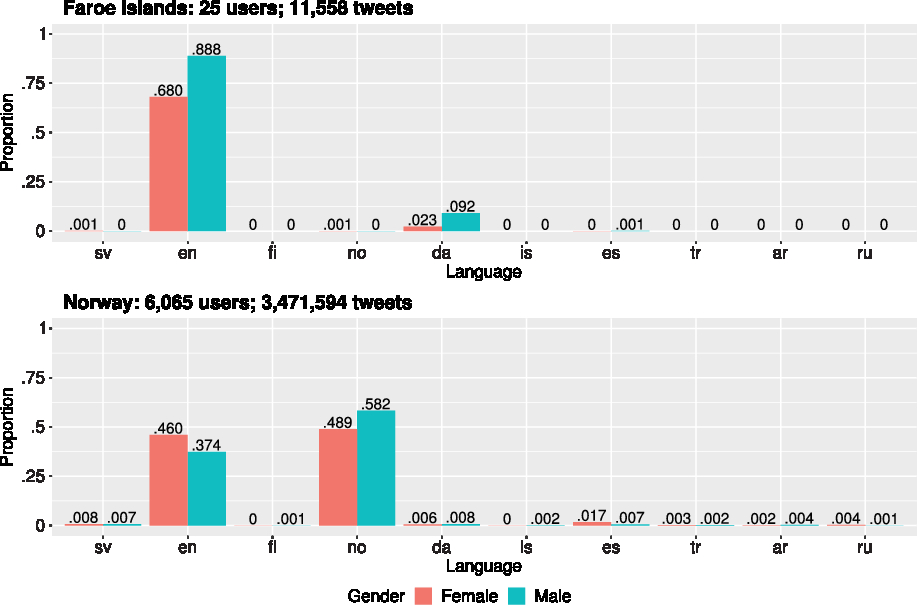
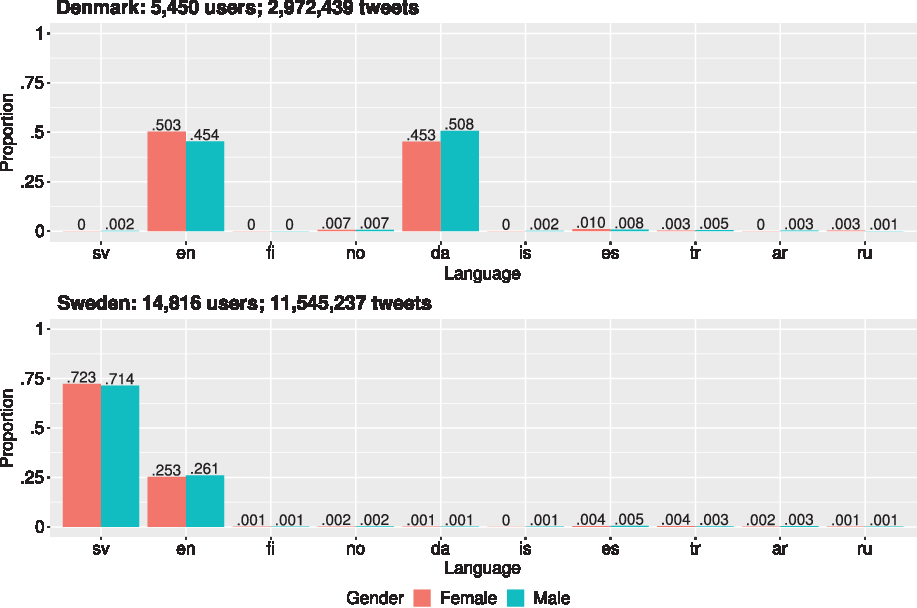
In Figures 1–4, the y-axis shows the proportion of tweets in a language, while the x-axis shows two-character codes for five official languages of the Nordics (Swedish = sv, Finnish = fi, Norwegian = no, Danish = da, Icelandic = is), and for the five additional languages with the highest overall use in the data set (English = en, Spanish = es, Turkish = tr, Arabic = ar, Russian = ru), ordered according to overall frequency in the data for all the countries/territories.
Language use by gender: Greenland and Iceland.
Language use by gender: Faroe Islands and Norway.
Language use by gender: Denmark and Sweden.
Language use by gender: Åland and Finland.
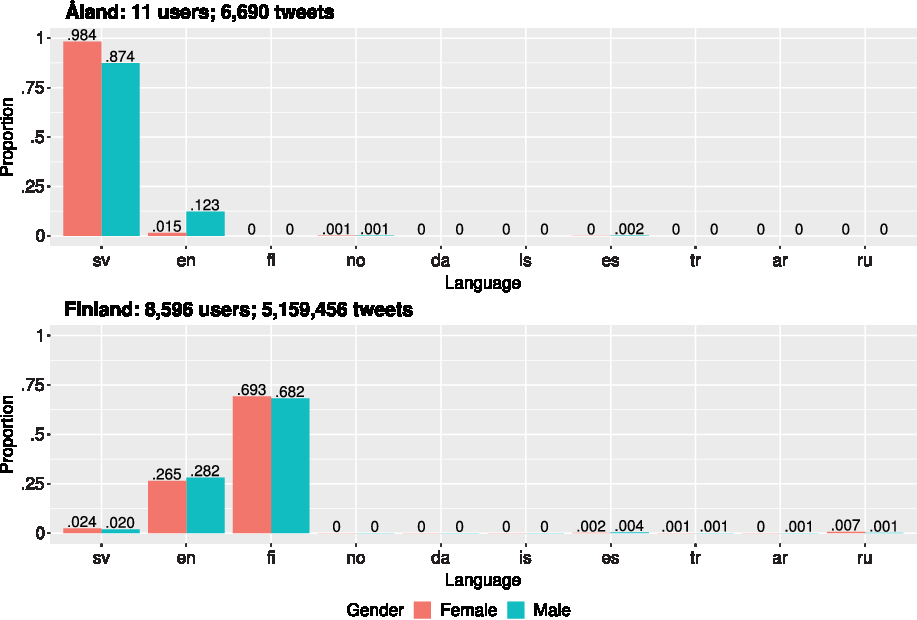
Overall, the official languages of the Nordics and English are the most-used languages. Swedish is the most prevalent language in the data, followed by English, Finnish, and Norwegian. This corresponds to the relative sizes of the user samples: Significantly more users from Sweden were sampled than from the other countries/territories.
Countries/territories with official languages that have only a small population of users, i.e. Greenland and the Faroe Islands, tend to use much more English (or in Greenland, also Danish) than official languages: In these samples, the local official language is used in 10% of tweets or less, while English is much more widely used. The high rate of use of French among Faroes females is due to one user (a French exchange student) with a large number of tweets. In Norway Norwegian is used slightly more than English, while in Denmark Danish and English are used at approximately the same rate. In Iceland, Sweden and Finland, Twitter users are more likely to write in their local languages: the proportion of tweets in Icelandic, Swedish, and Finnish for these countries ranges from .69 to .72.
4.2 Quantifying language preference by country and gender
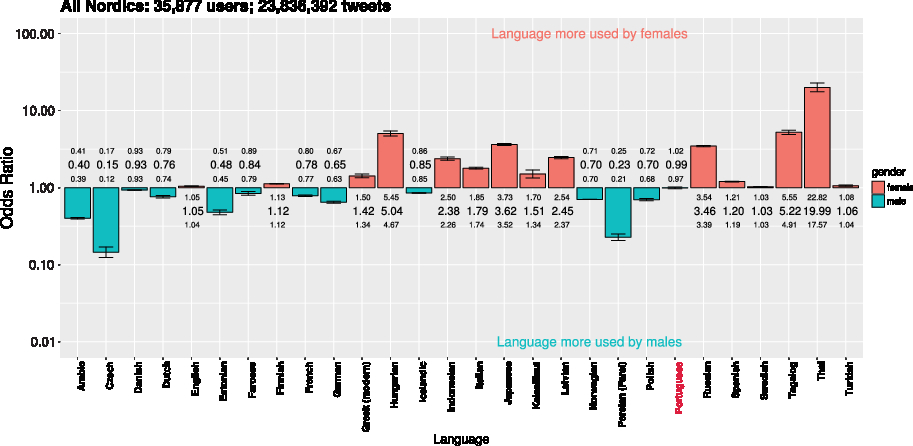
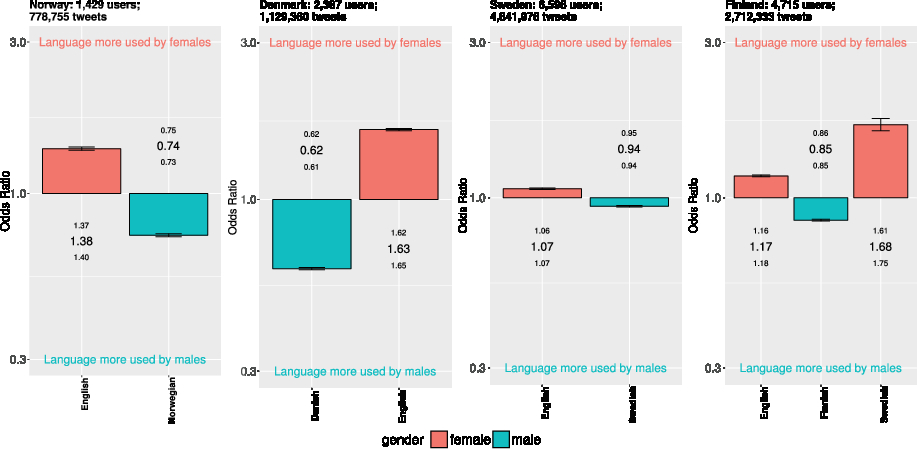
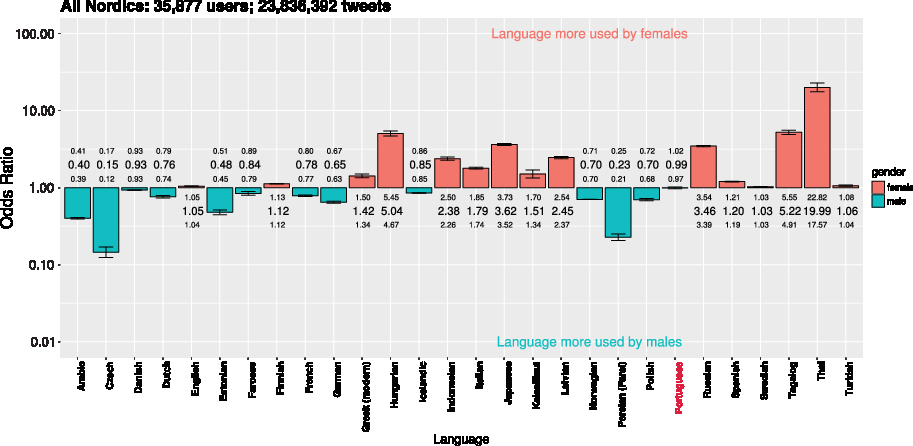
In the second set of results, gender-based preference for using a particular language was quantified by calculating the female–male odds ratio for the proportion of tweets in that language. Odds ratio values greater than 1 indicate a language is more likely to be used by females, while values less than one show male preference. Results are shown on a logarithmic scale in Figures 5 and 6, with 95% confidence intervals calculated using Fisher’s exact test. In the figures (which can be seen in color in the online version of this paper), orange-colored bars indicate an odds ratio > 1 and blue bars < 1. The numerical values immediately above or below the bars along the x-axis indicate the odds ratio (in larger typeface) and the upper and lower bounds of the 95% confidence interval (in smaller typeface). Confidence intervals that do not contain the value of 1 correspond to significance at p = .05; these are indicated by the language name in black type along the x-axis, while red typeface indicates no significant association. The bars and confidence intervals are not shown on the plots if they fall outside the plot range of 0.01 to 100.
Odds ratios female–male for 26 most common languages, all Nordics.
4.2.1 All users in the Nordics
Aggregating the data for all the Nordic countries/territories, the female–male odds ratios are summarized in Figure 5.
In the aggregated data, the statistically significant ‘male’ languages, in order of their overrepresentation among male users, are Persian, Arabic, Estonian, German, Polish, Norwegian, Dutch, French, Faroese, Icelandic, and Danish. The ‘female’ languages are Tagalog, Hungarian, Japanese, Russian, Latvian, Indonesian, Italian, Kalaallisut, Greek, Spanish, Finnish, Turkish, English, and Swedish. The discussion in Section 5 below proposes an interpretation of these results in light of migration statistics and sociolinguistic patterns.
For less widely-used languages in the data, the obtained odds ratio values may reflect language use by relatively few individuals with a large variance in the number of tweets sampled, and hence be unrepresentative of the populations sampled. In addition, as the data represents use of a particular language both by presumed L1 users (i.e. of a Nordic language for most of the sample) and by non-L1 users (e.g. of English for much of the sample), drawing inferences from patterns in the data is complicated by the lack of information about the linguistic identities of the individual users sampled. In the following section, therefore, only English and the principal national language(s) and users who are presumed L1 users of a Nordic language are considered.
4.2.2 Presumed L1 Nordic language users
Two additional filtering steps were undertaken in order to analyze language choice by presumed L1 Nordic-language users. In addition to information about the automatically-detected language of the text, the data of a single tweet also contains a field identifying the language in which the Twitter platform is presented to the user (i.e. the language of tabs, buttons, notices, drop-down menus, etc.). The language can be selected by the user; the default setting is that of the service used to access Twitter (e.g. the browser). In a first filtering step, users were selected for whom this field (‘user:lang’) matched the principal language of the country. Only Norway-, Denmark-, Sweden-, and Finland-based users were filtered, as the Twitter interface is not available in Kalaallisut/Greenlandic or Faroese, and just two of the 1,249 sampled users from Iceland had selected ‘Icelandic’ as the language of their Twitter interface. In a second step, users from each country were matched by name with smaller lists of the 1,000 most frequent male or female name types from that specific country (i.e. not with the aggregate list of 17,856 female and 15,406 male Nordic names). Footnote 4 Applying these two filtering steps resulted in a smaller sample of 15,127 users (5,849 females and 9,278 males) who are, presumably, more likely to be L1 users of the principal language of the country in which they are located and more likely to have been born or reside there, compared to the larger sample.
As noted above, except for English and the principal national languages (and Swedish for Finland), less widely-used languages are not evenly dispersed in the sample. For example, the odds ratio value in Figure 5 shows greater female than male use of Hungarian, but only a small fraction of users in the sample are responsible for tweets in Hungarian (0.5% of females and 0.7% of males). The resulting odds ratio reflects the influence of a single Sweden-based female user who broadcast several thousand Hungarian-language tweets.
The tendency for an attribute to be equally spread within a population, dispersion, can be quantified with (among other measures), Julliand’s D, which normalizes the coefficient of variation to a value between zero and one: smaller values indicate an item is not evenly distributed across categories, while higher values indicate that an item is evenly distributed (Gries Reference Gries, Gries, Wulff and Davies2010). For each of the larger Nordic countries, D values greater than .9 were found only for English and for the national language(s). For this reason, the focus in the following is on use of the principal national language(s) and English in the larger Nordic countries of Norway, Denmark, Sweden and Finland.
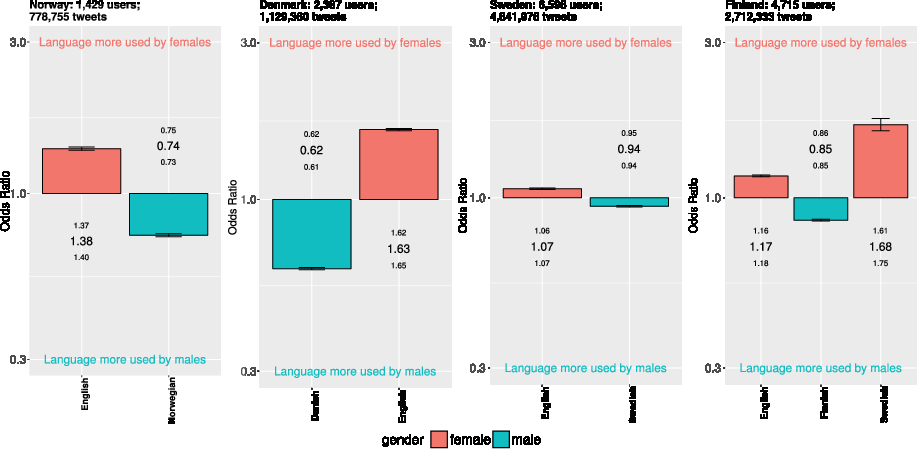
Figure 6 shows the female–male odds ratios for English and the principal national language for the four larger Nordic countries. In each country, English is more likely to be used by females, whereas the principal national language is more likely to be used by males. In Finland, Swedish is more likely to be used by females. For English, the effect size is largest amongst the presumed L1 Danish users – females are 63% more likely than males to author a tweet in English. A large effect size is also found for Norway users (38%), but less pronounced for Finland (17%) and Sweden (7%). For the national languages, male L1 Danish users are 61% more likely than females to author a tweet in Danish (1/0.62). For Norwegian, the effect size is 35%, for Swedish 6%, and for Finnish 17%. In Finland, female presumed L1 Finnish users are 68% more likely than male users to post a tweet in Swedish.
Odds ratios female–male for English and principal national language(s), presumed L1 speakers of the main national language.
4.3 Extent of bi- and multilingualism by country and gender
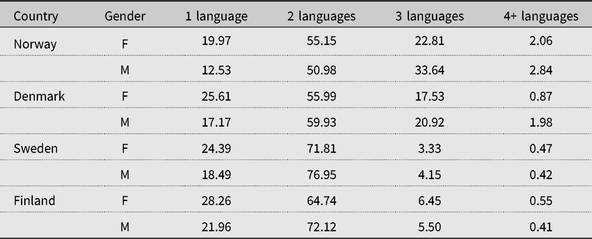
In the third set of results, active bi- and multilingualism on Twitter were quantified by country and gender for the presumed L1 Nordic speakers. To counter the possibility of inaccurate language detection, users were determined to have command of a language if they authored at least 10 tweets in that language. By this criterion, approximately 74% of female and 81% of male L1 Nordic-language users were bi- or multilingual. The breakdown by country and gender is shown in Table 4.
Percentage bi- and multilingualism by country/territory and gender.

Unsurprisingly, considering the global nature of social media and the educational attainment level of people in Nordic countries, the majority of users from the Nordics qualify as bi- or multilingual on the Twitter platform. Users from Norway and Denmark were more likely to write in three or more languages on Twitter, compared to Finland- and Sweden-based users. However, this may simply reflect the fact that because Danish and Norwegian (Bokmål) are quite similar in orthography, more than 10 tweets are likely to have been detected in both languages for many users. To test this, Danish and Norwegian were collapsed into a single language; the proportions of bi- or multilinguals from Denmark and Norway were reduced by approximately 2% for both males and females, but otherwise the multilingualism distribution as seen in Table 4 was not greatly affected. Finland’s slight edge in Twitter multilingualism over Sweden probably reflects the status of Swedish as an official language in Finland and the fact that a sizeable number of persons in Finland are trilingual in Finnish, Swedish, and English. The higher rate of multilingualism for females in Finland supports this interpretation, given that in Finland, Swedish is more likely to be used by females than by males (Figure 6).
5. Discussion
Language attitudes towards the use of English in the Nordics, as measured in 2002 by the MIN project, correspond to patterns of use in the Twitter data, at least in some respects. For example, Danes and Norwegians hold more positive attitudes towards the use of English as a workplace language compared to Finns, Swedes, Finland Swedes, Faroese, or Icelanders (Vikør Reference Vikør2003:50). For the five larger Nordic countries/territories, Danish and Norwegian users in this study have the highest percentages of tweets in English. On the other hand, the percentage of survey respondents reporting frequent use of English in the previous week was highest in Iceland, followed by Sweden, Denmark, Finland, Norway, the Swedish-majority portion of Finland, and the Faroes (Vikør Reference Vikør2003:46).
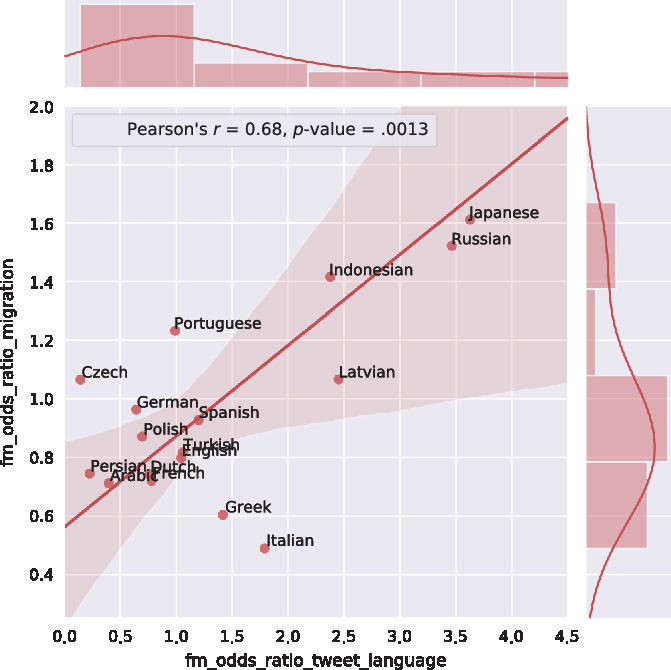
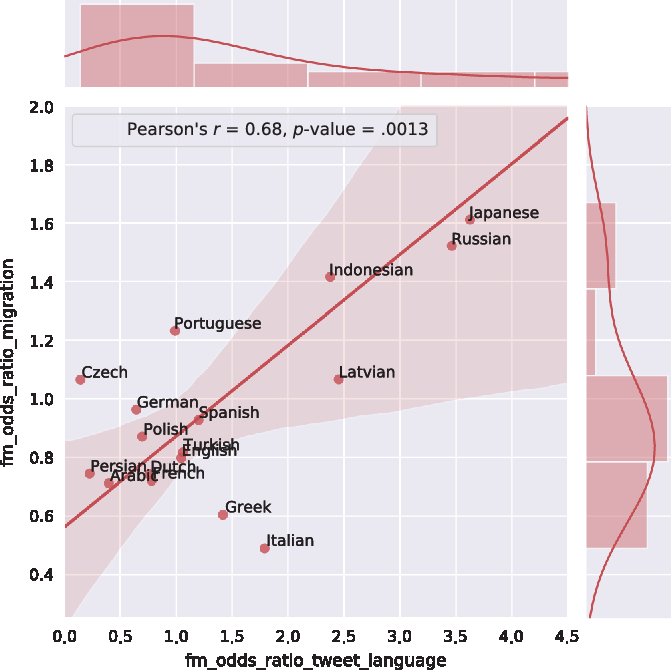
For many of the languages in this data, the demographics of immigration may in part explain female–male discrepancies: OECD statistics for migration to the Nordics by gender and country of origin for the years 2000–2016 are largely congruent with the female–male language balance. For example, the number of female migrants to the Nordics from the Philippines (658,410) outstrips the number of male migrants to the Nordics (176,168) in the years 2000–2016 by a factor of 3.73 to 1 (OECD 2018). Similar female overrepresentation is true for migration from many of the countries whose main languages are also more ‘female’ in the Twitter data set, such as Japan (1.61 to 1 female/male migration ratio), the Russophone countries of Russia, Belarus and Ukraine (1.52 to 1), Indonesia (1.42 to 1), or Latvia (1.07 to 1).
Likewise for the languages more used by males: The female–male migrant ratio to the Nordics from countries of the Arab world Footnote 5 is 0.71 to 1. For countries that use Dutch (Netherlands and Belgium) the ratio is 0.74 to 1, for Poland 0.87 to 1, for Iran and Afghanistan 0.74 to 1, and for Greece 0.6 to 1. The ratio for the German-speaking countries of Germany, Austria, and Switzerland is also slightly male (0.96 to 1). French is ‘male’ in the Twitter data, and migration to the Nordics from Francophone countries Footnote 6 is also more male, with a ratio of 0.72 to 1. On the other hand, Spanish is more used by females in the Twitter data, while migration from Hispanophone Footnote 7 countries to the Nordics has been slightly more male from 2000–2016, with a ratio of 0.93 to 1.
Despite some outliers in the data, the Pearson product–moment correlation between the female–male odds ratio for non-Nordic languages in the Twitter data and the OECD female–male migration ratio from the principal countries in which the language has official status is moderately strong at 0.68 (p = .0013). In Figure 7, on the y-axis, values greater than one indicate more female than male migrants to the Nordics from the country/countries in which the language has official status. On the x-axis, values greater than one indicate that the language is more likely to be used by females in the Twitter data in this study. The correlation between gendered language use and migration suggests not only that migrants to the Nordics are using their L1 on Twitter, but further strengthens previous findings demonstrating that social media signals can be interpreted as a proxy for global movement and migration patterns (Hawelka et al. Reference Hawelka, Sitko, Beinat, Sobolevsky, Kazakopoulos and Ratti2014).
OECD female–male migration ratio vs. Twitter female–male language use ratio.
For the larger Nordic societies of Norway, Denmark, Sweden, and Finland, the principal national languages are more likely to be used by males and English by females. Male preference for local languages compared to females may be the result of gender differences in orientation towards extra-local norms, where females, particularly those who are better-educated, are quicker to adopt prestigious language features or language use patterns from outside the local communities (Gal Reference Gal1979; Labov Reference Labov1990, Reference Labov2001; Cheshire Reference Cheshire, Chambers, Trudgill and Schilling-Estes2002; Bilaniuk Reference Bilaniuk2003; Lai Reference Lai2007; Smith-Hefner Reference Smith-Hefner2009). Male use of local languages, as opposed to English, may represent allegiance to local identities during a period of increasing globalization and practical language shift, in some domains and types of interaction, away from the Nordic languages and towards English.
In line with findings from some previous studies and surveys (Gal Reference Gal1979, Woolard Reference Woolard1997, Leppänen et al. Reference Leppänen, Pitkänen-Huhta, Nikula, Kytölä, Törmäkangas, Nissinen, Kääntä, Räisänen, Laitinen, Koskela, Lähdesmäki and Jousmäki2011, European Commission 2018), males are found to exhibit higher overall rates of bi- and multilingualism in the Twitter data. In the sociolinguistics literature it has been noted that higher male bi- or multilingualism can reflect a gender-based disparity in rates of participation in work environments in which bilingualism is the norm (Labov 2001:274). More detailed information about the identities of the users who comprise the data sample would be necessary in order to test this hypothesis. In this data, higher male bi- and multilingualism may be a result of some females being more likely to tweet in English rather than in a local language.
6. Summary and Conclusion
In this study a large corpus of Twitter communication authored by users from the Nordic countries and territories was analyzed in terms of country/territory, gender, and language choice. Users were located within the Nordics and identified for gender using list-based approaches.
In the first set of results, it was demonstrated that while the main Nordic languages are widely used by Nordic-based persons on Twitter, English use is also quite extensive. In the second set of results, gender differences in language use were considered by calculating the female–male odds ratio for 26 most widely-used languages on Twitter for the entire Nordic region. The data suggest that a language’s use by males or females in the Twitter data corresponds approximately to migration rates to the Nordics by persons from places where that language has official status. A third set of results showed that presumed L1 users of Nordic languages, identified on the basis of their language choice for the Twitter interface and their user name, show a consistent gender-based pattern in use of the principal national language and of English: Males use the former more, whereas females use more English. In addition, males exhibit slightly higher rates of bi- and multilingualism.
Gender differences in language use have been seen as evidence for language shift in progress in some sociolinguistic studies, with bilingual females typically leading the change by making more use of the language or language variety perceived to have higher prestige or offer more opportunities for social advancement. In Nordic contexts (as well as in other geographical contexts) using English on Twitter may be seen as a means for connecting with a prestigious globalized culture, rather than a local culture with more limited prestige. The data suggest that females in the Nordic societies are leading a shift towards English on the Twitter platform.
While the procedures used in this study give insight into differential language use on Twitter in the Nordics according to location and gender, some methodological improvements are possible. As has been noted above, the sample sizes for Greenland, the Faroes, and Åland are too small to give reliable results. Inducing author gender based on name frequencies from the Nordic statistical offices restricts the data to names written using the Latin alphabet and derived glyphs: Twitter users from the Nordics with ‘author name’ metadata written in Cyrillic, Asian, or Arabic (among other scripts), were not matched. This group, however, represents a small proportion of the overall number of Nordic Twitter users.
More information about the demographic parameters of Nordic-based Twitter users would allow a more nuanced interpretation of the findings pertaining to gendered differences in use of the Nordic languages and English. Of particular interest would be the manner in which demographic parameters such as age, educational level, occupation or language attitudes pattern with language choice and extent of bilingualism. While some information about these parameters could be gleaned from Twitter metadata (for example by scraping the ‘user’ metadata for age- or work-related terms), a crowd-sourced survey method is also conceivable. For example, Nordic-based Twitter users willing to provide demographic details (which would be anonymized) could be solicited on the Twitter platform itself; confidence intervals for the relationship between a particular demographic trait and language use would depend on the number of survey responses. Finally, more detailed information about the migrant populations in Nordic countries could shed light on the observed patterns of gendered language choice that do not seem to correspond to migration patterns, for example for Spanish.
Widespread global use of social media platforms has made studies of language use possible on a scale that previously was not logistically feasible. For the Nordics – prosperous and innovative societies on the cusp of many types of global change – understanding the changing ways in which languages are used online necessitates a data-intensive approach, an approach that allows consideration of the complex interaction between parameters of personal identity such as gender and the broad currents of language evolution.
Acknowledgements
The author would like to thank three anonymous reviewers and the editors of the NJL for useful suggestions, and Finland’s Center for Scientific Computing (csc.fi) for providing computational resources and data storage facilities.