

INTRODUCTION
Gut type and modes of intestinal morphology have been used for the categorization of fish in relation to feeding (Al-Hussaini, Reference Al-Hussaini1947; De Groot, Reference De Groot1971; Zihler, Reference Zihler1982). Furthermore, it has been shown that for a given body length, gut length (GL) of herbivorous fish is larger than that of omnivores, and that of omnivores larger than that of carnivorous species (e.g. Kapoor et al., Reference Kapoor, Smit and Verighina1975; Kramer & Bryant, Reference Kramer and Bryant1995a, Reference Kramer and Bryantb; Karachle & Stergiou, Reference Karachle and Stergiou2010). The same pattern is also true for other vertebrates (e.g. reptiles: O'Grady et al., Reference O'Grady, Morando, Avila and Dearing2005; birds: e.g. Ricklefs, Reference Ricklefs1996; mammals: e.g. Chivers & Hladik, Reference Chivers and Hladik1980).
Increase of GL during ontogeny, as well as the influence of phylogeny, have been documented for both freshwater and marine fish (e.g. Zihler, Reference Zihler1982; Ribble & Smith, Reference Ribble and Smith1983; Kramer & Bryant, Reference Kramer and Bryant1995a, Reference Kramer and Bryantb; Elliott & Bellwood, Reference Elliott and Bellwood2003; German & Horn, Reference German and Horn2006; Wagner et al., Reference Wagner, McIntyre, Buels, Gilbert and Michel2009). The relationship between GL and total body length (TL) is allometric: GL = a TLb (Kramer & Bryant, Reference Kramer and Bryant1995a, Reference Kramer and Bryantb). The ontogenetic allometry of GL could be related to the impact of the increasing body size to the absorbing efficiency of the intestine (e.g. Ribble & Smith, Reference Ribble and Smith1983; Kramer & Bryant, Reference Kramer and Bryant1995a). Moreover, the power type of equations (i.e. Y = a Xb) has been suggested as the most appropriate for relating any characteristic with body length (Lleonart et al., Reference Lleonart, Salat and Torres2000).
Information related to gut is found in a relatively small number of publications, and such gut-oriented research is even more limited (Karachle & Stergiou, Reference Karachle, Stergiou, Snoeks, Boden and Musschoot2007, Reference Karachle and Stergiou2010). This information is restricted to mean GL (GLm) or relative GL values (RGL: i.e. the ratio of GL to body length), and even fewer attempts have been made to link GL to body length or weight (Karachle & Stergiou, Reference Karachle, Stergiou, Snoeks, Boden and Musschoot2007, Reference Karachle and Stergiou2010). In addition, thorough studies on the relationship of GL with fractional trophic level (TROPH) are very limited (Karachle & Stergiou, Reference Karachle, Stergiou and Anon2006).
Ecomorphological studies focus only on relating GL to diet (e.g. Motta, Reference Motta1988; Wikramanayake, Reference Wikramanayake1990; Piet, Reference Piet1998; Pouilly et al., Reference Pouilly, Lino, Bretenoux and Rosales2003) and to a lesser extent on its relation to habitat (Gatz, Reference Gatz1979; Winemiller, Reference Winemiller1991). Information on the effect of habitat and gut type on GL is even scarcer. Indeed, despite the role that habitat plays, through the effect it has on body form, on the structure of the intestine (e.g. Verigina, Reference Verigina1991), there has been no attempt to relate it with GL. The same is also true for gut type.
The aim of the present study was to describe the gut type and estimate the values of intestinal indices (i.e. GLm, RGL, and intestinal weight–length (IWL)) of 58 species, which were caught in the Aegean Sea, Greece. Finally, the relationships between GL with TL were established and the hypothesis that GL increases allometrically with body length (as suggested by Kramer & Bryant (Reference Kramer and Bryant1995a)) was tested.
MATERIALS AND METHODS
Samples were collected in the North Aegean Sea, on a seasonal basis from June 2001 to January 2006, using professional fishing vessels (i.e. purse seiners, trawlers and small-scale gill-netters). A total of 60 samples were obtained (14 from purse seiners, 25 from trawlers and 21 from gill-netters), 18 spring samples and 14 samples per summer, autumn and winter, respectively. All specimens caught were preserved in 10% formalin. In the laboratory they were measured for total length (TL) to the nearest 0.1 mm and total body weight (W) to the nearest 0.1 g. The gut type per species was described, using a modified combination of different gut shapes as those provided by Al-Hussaini (Reference Al-Hussaini1947), De Groot (Reference De Groot1971) and Zihler (Reference Zihler1982), according to the following six categories: (a) convoluted; (b) short, with spiral valve; (c) straight; (d) Z-shaped; (e) looped Z-shaped; and (f) Z-shaped, with multiple loops. Following, when possible, gut was removed, uncoiled and its length (GL) was measured to the nearest 0.1 mm. For species with a stomach (53 out of the 58 species examined), measurements were from pylorus to anus, whereas for stomach-less species (5 out of the 58 species examined) the measurement was from oesophagus to anus.
Relative gut length (RGL = GL/TL), and intestinal weight length:

were estimated. Then, species were grouped according to their feeding habits. For this, two different types of trophic groups were used. The first one referred to the trophic groups identified by Karachle & Stergiou (Reference Karachle and Stergiou2008): (i) Group A: two species with preference to benthic Mollusca; (ii) Group B: eight species, with preference to Polychaeta; (iii) Group C: 19 species, with preference to Crustacea; and (iv) Group D: 47 species with preference to fish. The second one was the trophic groups identified by Stergiou & Karpouzi (Reference Stergiou and Karpouzi2002) for the Mediterranean, i.e. (a) pure herbivores (H; 2.0< TROPH <2.1); (b) omnivores with preference for plants (OV; 2.1< TROPH <2.9); (c) omnivores with preference for animals (OA; 2.9< TROPH <3.7); (d) carnivores with preference for decapods/fish (CD; 3.7< TROPH <4.0); and (e) carnivores with preference for fish/cephalopods (CC; 4.0< TROPH <4.5). Following on, the mean GL, RGL and IWL values of these groups were checked for normality (with few exceptions (6 out of the 19 cases), all were normally distributed: values of skewness and kurtosis within the −2 to +2 range; Zar, Reference Zar1999) and were compared, using analysis of variance (ANOVA) and Fischer's least significant difference (LSD) test.
The relationships between GL and TL were established using the power type of regression (GL = a TLb; Kramer & Bryant, Reference Kramer and Bryant1995a, Reference Kramer and Bryantb; Lleonart et al., Reference Lleonart, Salat and Torres2000) and consequently b was tested for difference from 1 using the t-test (Zar, Reference Zar1999). In order to check whether the small sample size affected the model of the relationship, comparison of the median sample size values of those species that the power type was valid and of all the remaining species was performed (values not normally distributed: skewness and kurtosis were outside the −2 to +2 range) the Mann–Whitney test was used (Zar, Reference Zar1999). The same analysis was performed using the absolute difference between the maximum body length of the species as presented in the present study and the maximum body length reported in FishBase (www.fishbase.com Froese & Pauly, Reference Froese and Pauly2010), in order to check the effect of maximum body size examined for the type of the relationship.
All regressions were plotted together for the detection of possible species' groupings. In order to identify patterns of changes of GL with TL, species' data were compiled together based on: (a) groups by Karachle & Stergiou (Reference Karachle and Stergiou2008); (b) functional trophic groups for the Mediterranean (Stergiou & Karpouzi, Reference Stergiou and Karpouzi2002); (c) habitat (data from FishBase; Froese & Pauly Reference Froese and Pauly2010); and (d) gut type as identified in the present study. The regressions per group in each of these compilations were plotted together and potential patterns were explored.
RESULTS
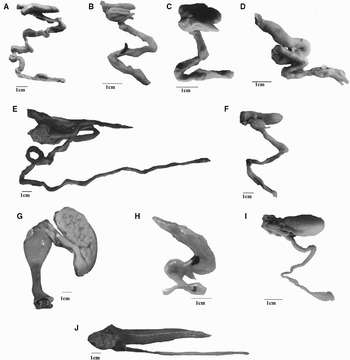
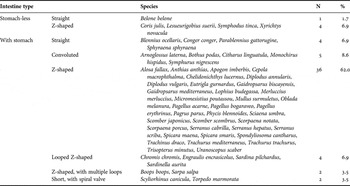
Overall, 58 species (4206 individuals) were studied (Appendix). The number of individuals ranged from four for Parablennius gattorugine to 593 for Sardina pilchardus, with 23 species represented by more than 50 individuals (Appendix). From the examined species, five were stomach-less (i.e. Belone belone, Coris julis, Lesueurigobius suerii, Symphodus tinca and Xyrichtys novacula) whereas the remaining 53 had a well developed stomach. Six different types of intestine were identified, with the Z-shaped intestine being the most frequent one (40 species; 68.9%; Table 1; Figure 1).
Digestive system of fish with different feeding habits and intestine types, North Aegean Sea, June 2001–January 2006. (A) Herbivore: Sarpa salpa; (B, C & E) omnivores with preference for animal material: Diplodus annularis, Spondyliosoma cantharus and Sardinella aurita, respectively; (D) omnivore with preference for animal material, stomach-less: Symphodus tinca; (F) carnivore with preference to Crustacea and fish: Scorpaena porcus; and (G–J) carnivores with preference for fish and Decapoda: Torpedo marmorata, Citharus linguatula, Uranoscopus scaber and Sphyraena sphyraena, respectively. Intestine: (A) Z-shaped with multiple loops; (B, C, D, F & I) Z-shaped; (E) looped Z-shaped intestine; (G) short with spiral valves; (H) convoluted; (J) straight.

Intestine types for 58 fish from the North Aegean Sea, Greece, June 2001–January 2006. Types of gut modified from Al-Hussaini (Reference Al-Hussaini1947), De Groot (Reference De Groot1971) and Zihler (Reference Zihler1982).

N, number of species.
As far as mean GL, RGL and IWL values (GLm, RGLm and IWLm, respectively) are concerned, Sarpa salpa showed the highest values (30.07 ± 1.59, 2.04 ± 0.109 and 8.46 ± 0.41, respectively), whereas the lowest ones were recorded for Symphurus nigrescens (3.02 ± 0.36), Cepola macrophthalma (0.24 ± 0.008) and Torpedo marmorata (1.01 ± 0.01), respectively (Appendix).
The GLm, RGLm, IWLm and TROPH of the three main groups (i.e. excluding Group A) identified by Karachle & Stergiou (Reference Karachle and Stergiou2008) differed significantly (ANOVA: F = 84.93, 211.81, 343.95, and 26.70, respectively; for all cases P < 0.001) (Table 2). Fisher's LSD indicated that the GLm, RGLm and IWLm changed as follows: Group B > Group C > Group D. In contrast, the mean TROPH changed in the opposite direction: Group B < Group C < Group D (Table 2). Accordingly, and based on the trophic groups identified by Stergiou & Karpouzi (Reference Stergiou and Karpouzi2002), the GLm, RGLm and IWLm differed significantly (ANOVA: F = 222.81, 600.70, and 701.20, respectively; for all cases P < 0.001) (Table 3). Fisher's LSD indicated that the GLm changed in the following direction: Group H > Group OA = Group CD > Group CC, whereas the mean RGL and IWL changed as follows: Group H > Group OA > Group CD > Group CC (Table 3).
Mean values of gut length (GL), relative gut length (RGL), intestinal weight–length (IWL) (Zihler, Reference Zihler1982), and fractional trophic levels (TROPH) and their corresponding standard error (SE), of the trophic groups identified by Karachle & Stergiou (Reference Karachle and Stergiou2008).

A, species with preference for benthic Mollusca; B, species with preference for Polychaeta; C, species with preference for Crustacea; D, species with preference for fish; Ni, number of individuals; Ns, number of species; LSD, results of Fischer's least significant difference, with different letters indicating that there was a difference.
Mean values of gut length (GL), relative gut length (RGL), and intestinal weight–length (IWL) (Zihler Reference Zihler1982), and their corresponding standard error (SE), of the trophic groups as identified by Stergiou & Karpouzi (Reference Stergiou and Karpouzi2002).

H, herbivores (2.0< fractional trophic level (TROPH) <2.1); OA, omnivores with preference for animal material (2.9< TROPH <3.7), CD, carnivores with preference for decapods and fish (3.7< TROPH <4.0); CC, carnivores with preference for fish and cephalopods (4.0< TROPH <4.6); Ni, number of individuals; Ns, number of species; LSD, results of Fischer's least significant difference, with different letters indicating that there was a difference.
The relationships between GL and TL are given in Table 4. In 52 species GL and TL were strongly related (P < 0.05) and only in six species (i.e. Chromis chromis, Coris julis, Merluccius merluccius, Monochirus hispidus, Sarpa salpa and Sciaena umbra) out of the 58 species the relationship was not significant (P > 0.05). In 27 out of the 52 species (51.9%), the b value of the relationship was statistically different from 1 (t-test: P < 0.10) indicating the allometric relationship of GL and TL. From those 27 species, only in Cepola macrophthalma and Gaidropsarus biscayensis the relationship was negatively allometric (Table 4). For the remaining 25 species (48.1%) the power expression of the relationship was not valid (t-test: P > 0.10), based on R 2 values (Ribble & Smith, Reference Ribble and Smith1983), the relationship was power in 12 species (48%), linear (GL = a + bTL) in 8 species (32%), exponential (GL = a ebTL) in 4 species (16%) and logarithmic (GL = a + b logTL) only in Boops boops (4%) (Table 4). The median sample size of the species showing power type of relationship (39 species) was higher than those that did not exhibit a power type relationship (13 species), although this difference was not significant (Mann–Whitney test: U = 189.5, P = 0.180). Conversely, there was a significant difference (Mann–Whitney test: U = 350.5, P < 0.05) between the median absolute difference between maximum body length per species of the specimens examined here and that from FishBase, with species where the power type model was valid exhibiting higher median value.
Relationships between gut length (GL) and total body length (TL) for 58 fish from the North Aegean Sea, Greece, June 2001–January 2006.

N, number of individuals; SEb, standard error of slope b; R 2, coefficient of determination. X indicates that b ≠ 1. ToR, type of relationship; E, exponential type; L, logarithmic type; Li, linear type; P, power type.
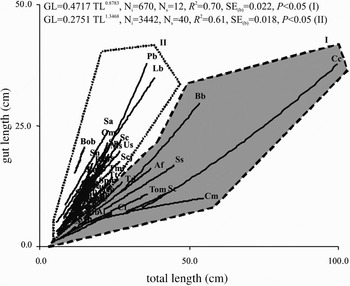
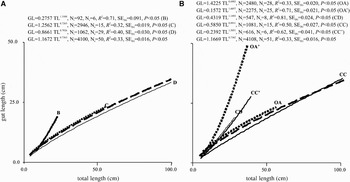
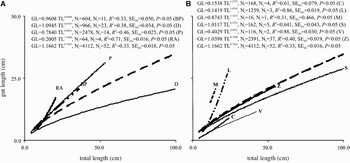
When the GL–TL regressions of the 52 species were plotted together (Figure 2) two distinct groups could be identified visually, based on the trends of the individual regression lines. Group I comprised 12 species, including all species with elongated body (i.e. Belone belone, Cepola macrophthalma, Conger conger, Scyliorhinus canicula and Sphyraena sphyraena), Torpedo marmorata, and the majority of the flatfish (excluding Bothus podas). Group II included all the remaining 40 species, mainly species with a streamlined body. The general regressions of the two groups (i.e. considering all the individuals of all species per group) differed significantly (ANCOVA: F: 2490.49; P < 0.01). When species' data were compiled together according to groups by Karachle & Stergiou (Reference Karachle and Stergiou2008) (Figure 3A), GL for the same TL was larger for omnivores than for carnivores. When the same was done based on the trophic groups of Stergiou & Karpouzi (Reference Stergiou and Karpouzi2002), such a pattern was only observed when the species of Group I were not taken into account (Figure 3B). With respect to habitat (Figure 4A) GL for the same TL was larger in reef-associated species, followed by pelagic, benthopelagic and demersal species. Finally, the more loops and foldings the gut possessed, the faster GL increased with TL (Figure 4B).
Regressions between total body length (TL, in cm) and gut length (GL, in cm) for 52 fish species from the North Aegean Sea, Greece, June 2001–January 2006. Equations are given in Table 4. Aa, Anthias anthias; Af, Alosa fallax; Ai, Apogon imberbis; Al, Arnoglossus laterna; Bb, Belone belone; Bo, Blennius ocellaris; Bob, Boops boops; Bp, Bothus podas; Cc, Conger conger; Chl, Chelidonichthys lucernus; Cl, Citharus linguatula; Cm, Cepola macrophthalma; Da, Diplodus annularis; Dv, Diplodus vulgaris; Ee, Engraulis encrasicolus; Eg, Eutrigla gurnardus; Gb, Gaidropsarus biscayensis; Gm, Gaidropsarus mediterraneus; Lb, Lophius budegassa; Ls, Lesueurigobius suerii; Mp, Micromesistius poutassou; Ms, Mullus surmuletus; Om, Oblada melanura; Paa, Pagellus acarne; Pab, Pagellus bogaraveo; Pae, Pagellus erythrinus; Pb, Phycis blennoides; Pg, Parablennius gattorugine; Pp, Pagrus pagrus; Sa, Sardinella aurita; Sap, Sardina pilchardus; Scj, Scomber japonicas; Sc, Scyliorhinus canicula; Scs, Scomber scombrus; Sec, Serranus cabrilla; Seh, Serranus hepatus; Ses, Serranus scriba; Sn, Scorpaena notate; Sp, Scorpaena porcus; Spc, Spondyliosoma cantharus; Spm, Spicara maena; Sps, Spicara smaris; Ss, Sphyraena sphyraena; St, Symphodus tinca; Syn, Symphurus nigrescens; Td, Trachinus draco; Tm, Trachurus mediterraneus; Tmi, Trisopterus minutes; Tom, Torpedo marmorata; Tt, Trachurus trachurus; Us, Uranoscopus scaber; Xn, Xyrichtys novacula. For Groups I and II see text. Ni, number of individuals; Ns, number of species; SE(b), standard error of slope b.

Regressions of groups of species between total body length (TL, in cm) and gut length (GL, in cm) for 52 fish species from the North Aegean Sea, Greece, June 2001–January 2006. Based on groups (A) by Karachle & Stergiou (Reference Karachle and Stergiou2008), and (B) functional trophic groups by Stergiou & Karpouzi (Reference Stergiou and Karpouzi2002). Ni, number of individuals; Ns, number of species; SE(b), standard error of slope b; B, C and D, groups as identified by Karachle & Stergiou (Reference Karachle and Stergiou2008); OA, omnivores with preference for animal material; OA', omnivores with preference for animal material, excluding species of Group I; CD, carnivores with preference for decapods and fish; CC, carnivores with preference for fish and cephalopods; CC', carnivores with preference for fish and cephalopods, excluding species of Group I. For Group I see text.

Regressions of groups of species between total body length (TL, in cm) and gut length (GL, in cm) for 52 fish species from the North Aegean Sea, Greece, June 2001–January 2006. Groupings according to (A) habitat (data from FishBase; www.fishbase.com Froese & Pauly, Reference Froese and Pauly2010), and (B) gut type as identified in the present study. Ni, number of individuals; Ns, number of species; SE(b), standard error of slope b. BP, benthopelagic; C, convoluted; D, demersal; L, Z-shaped looped; M, Z-shaped with multiple loops; P, pelagic; RA, reef-associated; S, straight; V, short with spiral valve; Z, Z-shaped. For Group I see text.

DISCUSSION
In this study, gut was examined for 58 species from the Aegean Sea, 32 of which were represented by a rather small number of individuals (N < 30), because most of these species are generally rare in the study area. Additionally, uncoiling the digestive tract and extracting an intact gut, suitable for length measurements, is a rather difficult and not always successful procedure. Hence, despite the original number of individuals per species examined was higher, the resulted number of gut measurements did not exceed the generally accepted threshold for statistical analyses of 30 (for 16 out of 32 species with N < 30). Nevertheless, information provided even by small-sized samples is of great importance, given the fact that such information exists only for five out of the 32 species represented by small number of individuals (i.e. Bothus podas, Pagellus erythrinus, Pagrus pagrus, Sarpa salpa and Serranus cabrilla) (Karachle & Stergiou, Reference Karachle and Stergiou2010). Moreover, the majority of information related to gut is restricted to a small number of individuals (in 534 (83.2%) out of the 642 cases reported in literature, N was smaller than 50, ranging from 1 (58 cases) to 49 (1 case); mean ± SD = 14.24 ± 12.09, median = 10; Karachle & Stergiou, Reference Karachle and Stergiou2010).
As far as intestinal indices (GL, RGL and IWL) are concerned, all comparisons made (i.e. between trophic groups as identified by Karachle & Stergiou (Reference Karachle and Stergiou2008) and by Stergiou & Karpouzi (Reference Stergiou and Karpouzi2002)), confirmed that GLm changes in relation to feeding in the following direction: carnivores < omnivores < herbivores (e.g. Kapoor et al., Reference Kapoor, Smit and Verighina1975; Ribble & Smith, Reference Ribble and Smith1983; Kramer & Bryant, Reference Kramer and Bryant1995b; Karachle & Stergiou, Reference Karachle and Stergiou2010).
Various authors (e.g. Al-Hussaini, Reference Al-Hussaini1947; Kramer & Bryant, Reference Kramer and Bryant1995b; Ward-Campbell et al., Reference Ward-Campbell, Beamish and Kongchaiya2005) have proposed in the past classifications of species to a feeding/trophic category according to their RGL, and divergences from the ranges set by these classifications have been attributed to ‘unusual biological phenomena’ (Cleveland & Montgomery, Reference Cleveland and Montgomery2003). These classifications were not confirmed by the results of the present study, since there was a great overlap between RGL values, when trophic groups proposed by Stergiou & Karpouzi (Reference Stergiou and Karpouzi2002) and by Karachle & Stergiou (Reference Karachle and Stergiou2008) were used. Despite the fact that, based on the results, RGL and IWL seem to be better indicators than GL (Tables 3 & 4), none of the indices examined here can be used for assigning a species into a trophic category or a functional trophic group. The results of the present study are in accordance with those of Karachle & Stergiou (Reference Karachle and Stergiou2010), who suggest, by comparing 454 datasets of RGL and 170 datasets of IWL, that these indices are inadequate for the accurate classification of a species in a trophic group. Their findings, combined with those presented here, reinforce the weakness of these indices to fully describe the feeding habits of a species. Therefore, in spite of their usefulness in describing the general feeding preferences of a species, such indices are untrustworthy and should be cautiously used when comparing species of different diets (Cleveland & Montgomery, Reference Cleveland and Montgomery2003; German & Horn, Reference German and Horn2006).
The shape of the gut in fish displays a great variety. It can be a straight tube, but it can also comprise, to a lesser or greater extent, complicated loops and/or foldings (Al-Hussaini, Reference Al-Hussaini1947). In many cases, such as in Beloniformes and Sygnathiformes, the structure of the intestine is defined not only by the feeding habits, but also from its general body form, which in turn might be related to its habitat (e.g. Verigina, Reference Verigina1991). This assumption is being confirmed by the findings presented here (Appendix). Thus, the gut shape of species with rather elongated body form (e.g. Belone belone, Conger conger) tends to be a straight tube, whereas in flatfish (e.g. Arnoglossus laterna and Citharus linguatula) it is convoluted, as also shown by De Groot (Reference De Groot1971), who examined 133 species of Pleuronectiformes. Finally, in the species with the classic streamlined body shape (e.g. Alosa fallax, Pagellus acarne and Trisopterus minutus) it is Z-shaped. Additionally, the rate that GL increases with TL between different species is also affected by a species' habitat (Figure 4A) and gut shape (Figure 4B).
Gut length for fish with streamlined body increases faster with TL for omnivores than carnivores (Figure 3). This general rule does not apply to species with rather elongated body shape (e.g. Cepola macrophthalma, Conger conger and Sphyraena sphyraena) or body shape other than the streamlined (e.g. flatfish and Torpedo marmorata), all of which form a separate group (Figure 2). Therefore, besides feeding habits that play a key role for the increase of gut length in relation to body length, body shape is also an important factor, influencing intestinal growth (see also Verigina, Reference Verigina1991).
For the same TL, GL was found to be larger in omnivores than carnivores (Figure 3). This trend between trophic groups is probably related to the physiology of digestion, since the intestinal surface required for the absorption of nutrients is directly linked to digestive efficiency (e.g. Wootton, Reference Wootton1998). The latter means that an effective way of increasing digestive efficiency is total intestinal length: longer guts allow food to spend more time in the digestive tract and, therefore, more nutrients to be absorbed (e.g. Wootton, Reference Wootton1998; Pennisi, Reference Pennisi2005). Fish that consume food of high quality (e.g. other fish) can absorb nutrients by possessing guts shorter than their total body length. Conversely, fish that prey on food items that are resistant to digestion (e.g. plant material and crustacean exoskeletons) seem to have a proportionally longer intestine compared to their body length (e.g. Wootton, Reference Wootton1998).
Ribble & Smith (Reference Ribble and Smith1983) and Kramer & Bryant (Reference Kramer and Bryant1995a) proposed that there must be an allometric growth of GL, since isometric intestinal growth would result in reduced capacity of meeting the metabolic demands of any given fish. This hypothesis has been proposed both for freshwater (e.g. Ribble & Smith, Reference Ribble and Smith1983; Kramer & Bryant, Reference Kramer and Bryant1995a) and marine fish species (e.g. Honda, Reference Honda1984; Eggold & Motta, Reference Eggold and Motta1992; Benavides et al., Reference Benavides, Cancino and Ojeda1994), whereas the same has been proposed for gill surface (Pauly, Reference Pauly and Pitcher1994). Based on the above, it is expected that there would be an allometric relationship between GL and TL. In the present study, this was only confirmed for 27 out of the 52 studied herein. Conversely, there was an exponential, linear or logarithmic intestine growth with total body length for a wide variety of species: from small-sized (e.g. Lesueurigobius suerii) to large-sized species (e.g. Lophius budegassa and T. marmorata); from herbivores (Parablennius gattorugine) to carnivores (e.g. Uranoscopus scaber); with streamlined bodies (e.g. Boops boops), to flatfish (e.g. Bothus podas) and with elongated body shape (e.g. Sphyraena sphyraena). These results agree with those that report linear relationships between GL and body length (e.g. Junger et al., Reference Junger, Kotrschal and Goldschmid1989; Pérez-España & Abitia-Cárdenas, Reference Pérez-España and Abitia-Cárdenas1996; Ward-Campbell et al., Reference Ward-Campbell, Beamish and Kongchaiya2005). However, this could be attributed to the smaller sample size of the species, combined with the generally small size of the individuals examined.
Organisms, in order to maintain their efficiency that might be reduced as a result of ontogenetic changes, either fully use the capacity that their current structure provides them with, or/and modify their structural capacity to meet with the new demands (phenotypic plasticity due to changes in form and processes) (Galis et al., Reference Galis, Terlouw and Osse1994). Based on the above, it could be hypothesized that allometric growth of the intestine is not a prerequisite in order for the gut to respond effectively to the increasing demands for nutrients and energy. It can be, therefore, assumed that changes in physiology take place, in order for the gut to perform adequately; a hypothesis that needs further investigation.
Appendix. Intestinal indices for 58 fish from the North Aegean Sea, Greece

N, number of individuals; TL, total body length (in cm); GLm, mean gut length (in cm); RGLm, mean relative gut length; IWLm, intestinal weight–length (Zihler, Reference Zihler1982); TROPH, fractional trophic level (from Karachle & Stergiou, Reference Karachle and Stergiou2008); SE, standard error.