Introduction
Maternal exposure to several factors such as under-nutrition, obesity, diabetes, and various chemical compounds can modify the expression and action of the fetal hypothalamic neuropeptides playing a central role in energy regulation,Reference McMillen and Robinson1 thus predisposing the offspring to develop metabolic syndrome (MetS) during adulthood.Reference McMillen and Robinson1–Reference Şanlı5 Furthermore, development of MetS is associated with the high dietary intake of fructose, a refined carbohydrate that can cause consistent changes in energy metabolism.Reference Taskinen, Packard and Borén6,Reference Mortera, Bains and Gugliucci7
The anti-obesogenic compound alpha-lipoic acid (ALA) is used as a therapeutic agent to relieve MetS-related symptoms.Reference Salehi, Berkay Yılmaz and Antika8–Reference Pershadsingh10 ALA is a natural antioxidant produced by plants, animals, and humans,Reference Salehi, Berkay Yılmaz and Antika8 which modulates the activity of the hypothalamic neurons that regulate food intake.Reference Kim, Park and Namkoong11 ALA can cross the placenta and reach the fetal circulation after maternal intake.Reference Koga, Ishida and Takeda12 In addition, ALA can cross the hematoencephalic barrier in the adult,Reference Kim, Ha and Han13 and very likely in the fetus too, given the high permeability of this barrier in fetal life (it remains open until the third-day postpartum in the ratReference Ugrumov, Saifetyarova and Lavrentieva14).
ALA impacts metabolism by modulating the expression of genes encoding for key enzymes involved in protein synthesis and metabolism of fatty acid, cholesterol, and glucose, among others.Reference Kim, Park and Namkoong11 Thus, if ALA reaches the fetus, it can introduce epigenetic modifications that permanently alter fetal gene expression, thereby affecting the offspring’s phenotype after birth.Reference de Boo and Harding15 Nevertheless, the potential effects of maternal ALA intake on offspring metabolism have not been explored to date.
In a preliminary study,Reference Rabaglino, Esmoriz and Vara-Messler16 we found that the livers of 3-month-old rats whose moms had been fed a diet supplemented with ALA throughout pregnancy, presented reduced fat infiltration, and significantly lower levels of interleukin-6, a cytokine positively correlated with MetS.Reference Monserrat-Mesquida, Quetglas-Llabrés and Capó17 Therefore, we hypothesized that maternal exposure to ALA during the developmental period of the hypothalamic orexigenic neurons in the fetus would modify offspring metabolism permanently and prevent metabolic disorders during adulthood. In the rat, the orexigenic neurons (NPY/AGRP) are present in the arcuate nucleus at 14.5 days of gestation, and their development is completed around 15 days postpartum.Reference McMillen, Adam and Mühlhäusler18 In addition, administration of a 10% fructose solution in the drinking water induces symptoms comparable to those observed in human MetS.Reference Andrade, Andrade and Silva19–Reference Yahia, Hassan and El-Ansary21 The objective of this study was to determine the effect of ALA supplementation in the diet of pregnant Wistar rats between day 14 of gestation to day 20 of lactation on the metabolic profile of three-month-old male offspring after chronic intake of fructose-enriched water.
Materials and methods
Chemicals
Maternal treatment
Dry ALA was purchased from Todo Droga (Córdoba, Argentina), dissolved in ethanol, and homogeneously incorporated into a ground food (GEPSA food, Grupo Pilar S. A., Argentina) at a rate of 4000 mg of ALA per kilogram of food (0.4% wt/wt). This dose was used in the pilot study mentioned above, on which this and a higher dose (0.5% wt/wt) was tested without observing detrimental effects on the animals, and was chosen based on previous reports.Reference Kim, Park and Namkoong11 Food was stored in a dry environment, avoiding exposition to sunlight. Using this procedure, 5 kg of food were prepared on the same day and stored for the whole experiment.
Offspring experiment
Pure Fructose D(-)-Levulosa) was obtained from Anedra S. A. (Buenos Aires, Argentina). Fructose was incorporated into tap water as a 10% w/v and was prepared twice a week when water was replaced in the drinking bottles. Water with the 10% fructose solution was given ad libitum to the corresponding offspring during the experimental period (see below).
Maternal treatment
Nulliparous female Wistar rats of similar age (~6 months) and weight (~250 g) were housed under a 12-h light/dark cycle (lights on at 07:00 AM) and temperature controlled (22°C–24°C) conditions, with food and water ad libitum. At the beginning of this experiment, animals of similar ages and weights were mated at ratio 2:1 (female to male). Every day in the morning, females were examined for the vaginal plug or presence of sperm in the vaginal smears. When either of these was observed, the rat was housed apart, and that day was considered as day 0 of the experiment for that rat. If no signs of mating were detected, the rat was reintroduced in the male cage. The eight female rats used in this experiment were mated between the second and fourth day after contact with the male.
During the first 14 days, dams were fed with ground food ad libitum (GEPSA food, Grupo Pilar S. A., Argentina, energy value: 2780 Kcal/kg). On day 14 of gestation, four randomly chosen rats were fed ad libitum with ground food + ALA (0.4% wt/wt). Feeding with ALA continued until day 20 of lactation. This period of ALA exposure was chosen to match the development of the hypothalamic appetite regulatory network in the rat.Reference McMillen, Adam and Mühlhäusler18 The remaining pregnant rats (Control, n = 4) were kept feeding with ground food ad libitum. Food intake and body weight were measured every 2 or 3 days. There were no significant differences for both parameters between groups.
The first day after the day of parturition, the litter size was reduced to four males and four females. There were no differences in the average litter size between maternal ALA and Control rats (11.5 and 12 pups, respectively), neither in the proportion of male:female pups born (6.5:7, respectively, for both groups). Thus, the offspring to study were 16 males and 16 females born from the maternal rats fed with ALA (ALA group) or from the maternal Control rats (CT group), respectively. Only the offspring males were used to accomplish the objective of the present research. The female offspring were employed for another experiment, aimed to test if early exposure to ALA prevents metabolic changes associated with ovariectomy during their adulthood (data not shown). Weaning was done at 30 days after parturition, and two siblings of the same gender were housed per cage with regular food and water until 3 months of age.
Determination of hepatic ALA concentration in one-month-old offspring
At 1 month of age, randomly selected five males from the rats fed with ALA and five males born from the Control rats were euthanized for tissue collection. Samples were snap-frozen and stored at −80°C. The concentration of ALA in the liver tissue was measured through gas liquid chromatography (GLC). Tissue samples were homogenized in hypotonic Hepes-Mannitol buffer using a Polytron (7 s at setting 7). The homogenate was treated with 10 mM of CaCl2 and centrifuged at 3000 g for 15 min. The supernatant was centrifuged at 48000 g for 30 min, and the pellet was collected in PBS buffer at 20°C overnight and used the following day. Total lipids were extracted from tissues and partitioned according to Folch.Reference Folch, Lees and Sloane Stanley22 The ALA abundance was analyzed using a polyethylene glycol capillary column (30 m × 320 μm id × 0.50 μm) on a GLC (Clarus 500, Perkin Elmer). ALA was identified by comparing its retention time with the authentic standard (analytical standard (DL-6,8-Thioctic acid, Sigma Aldrich)) according to experiments from our laboratoryReference Garcia, Lamarque and Comba23 using a reduced, analytical standard (DL-6,8-Thioctic acid, Sigma Aldrich).
Offspring experiment with fructose treatment
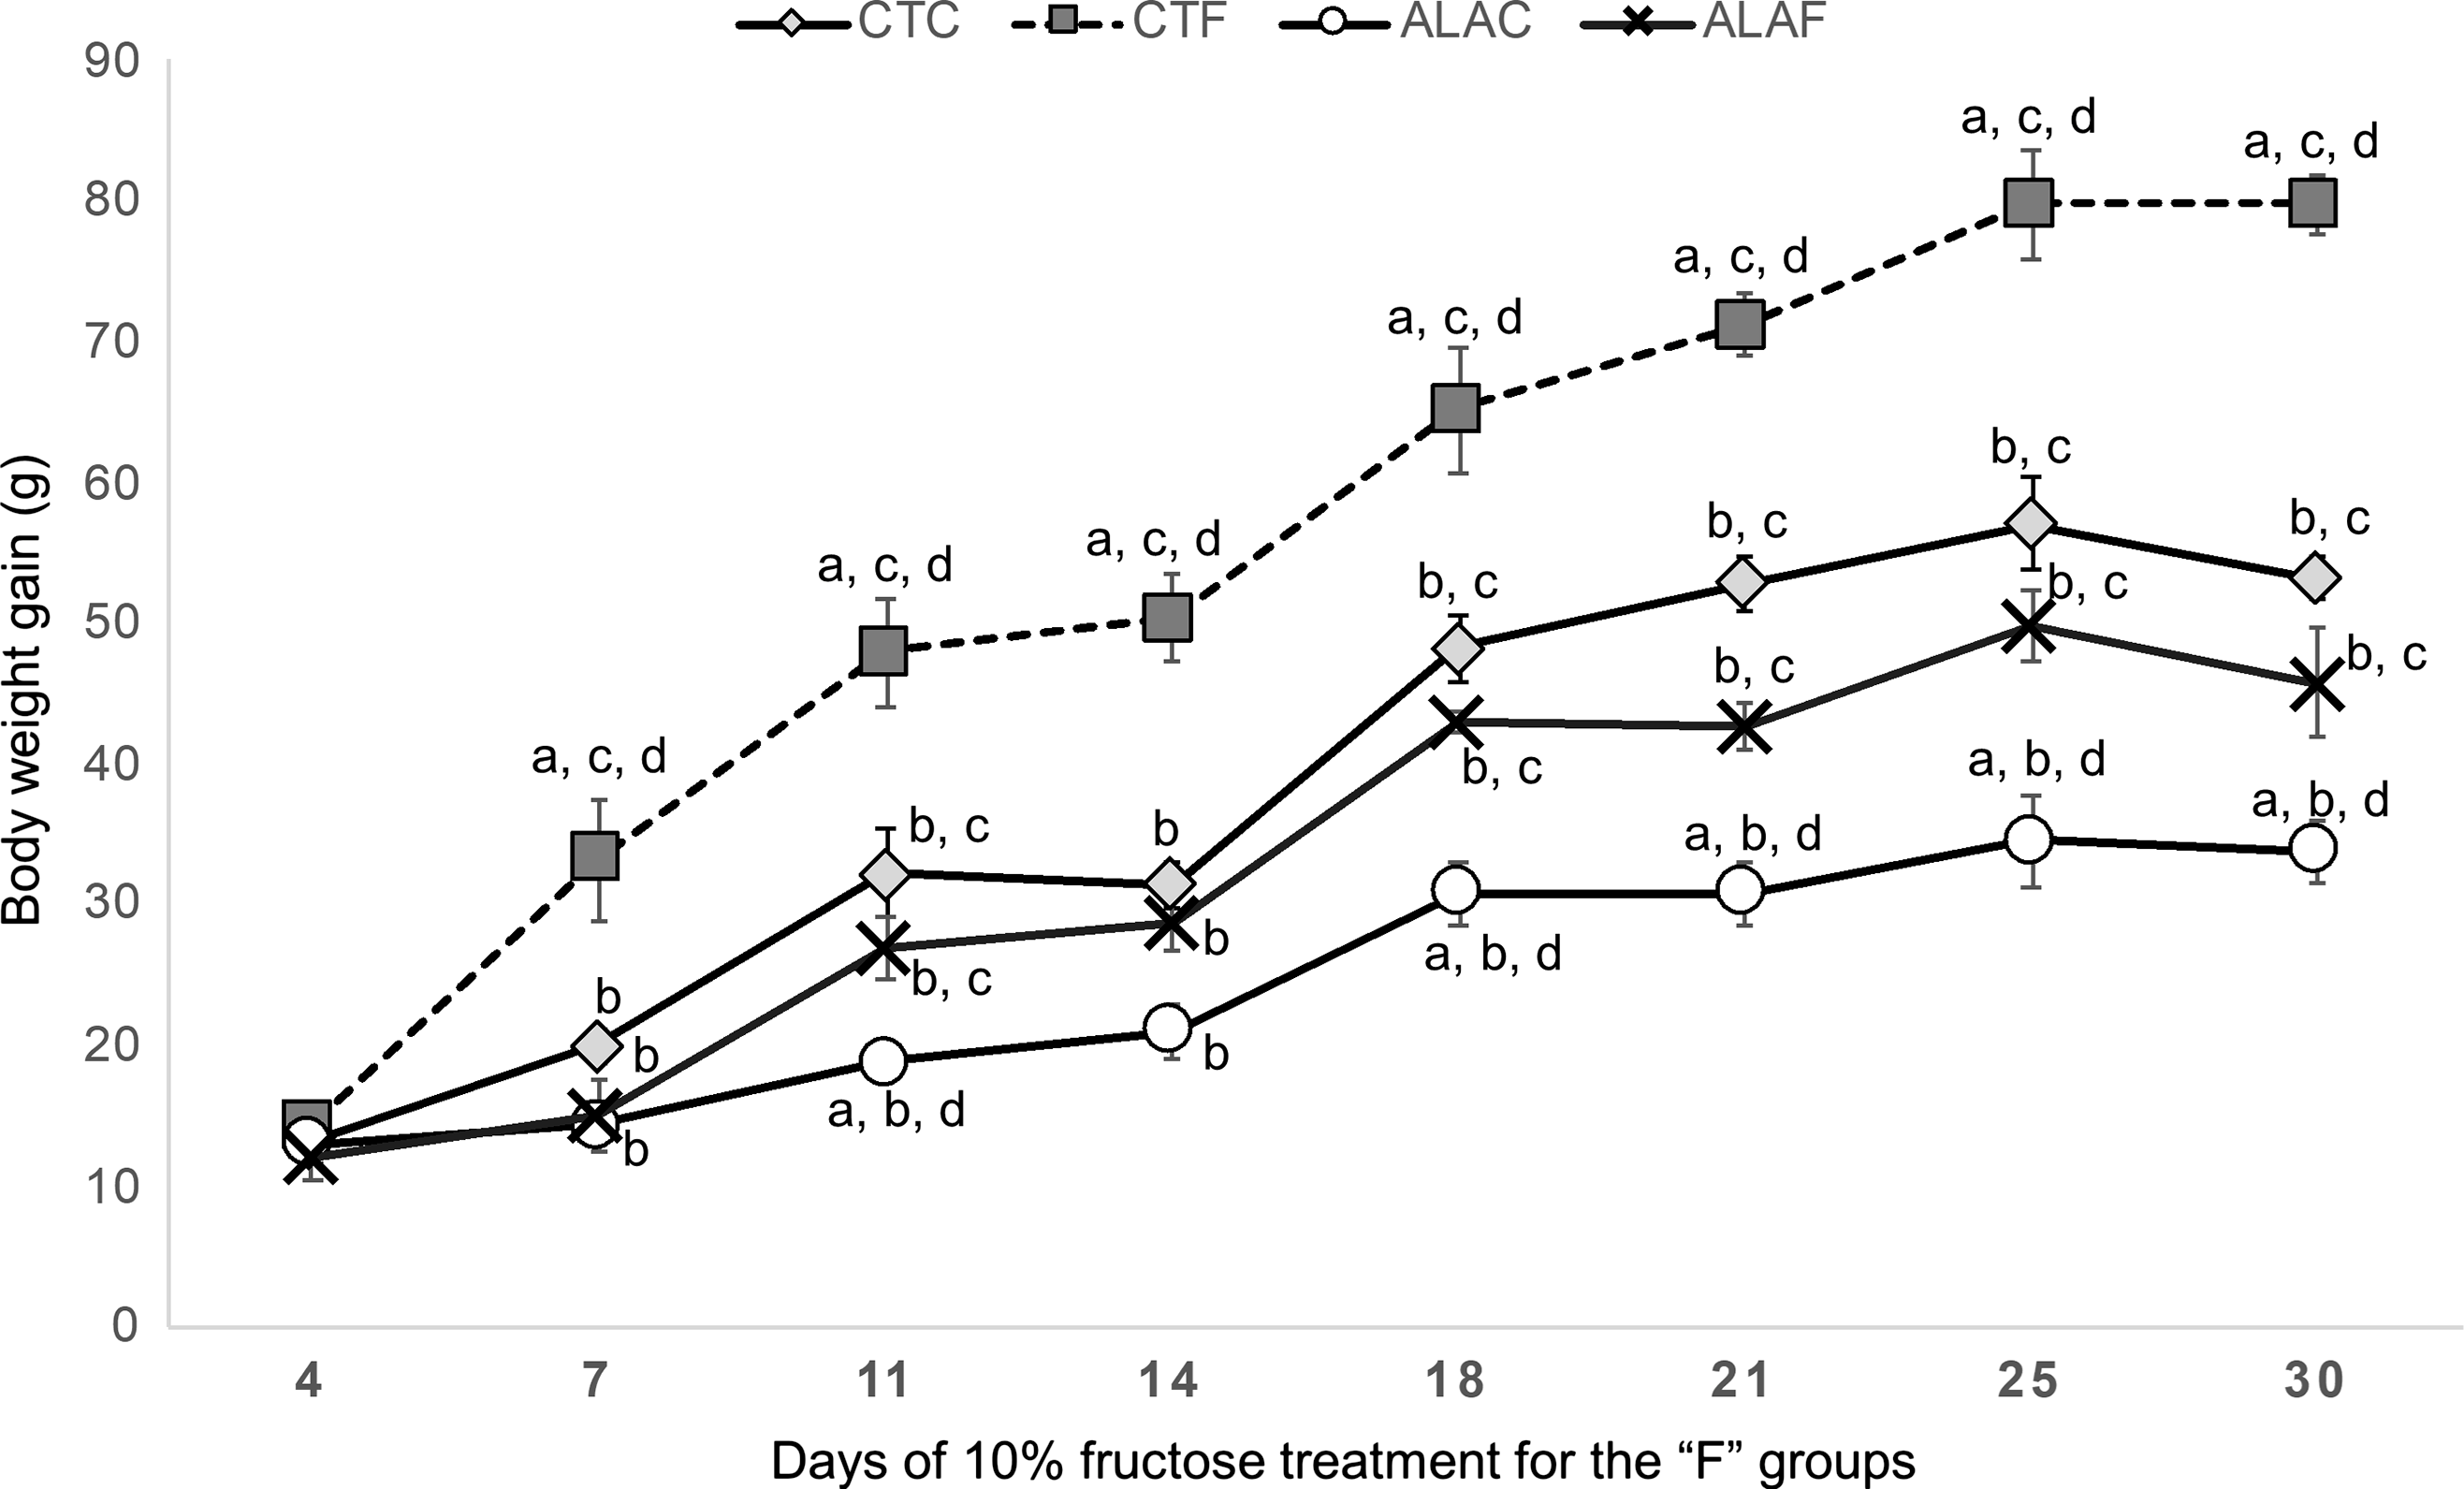
At 3 months of age, the remaining males from each maternal group were randomly assigned to receive 10% fructose solution (F) in the drinking water or continue with tap water as controls (C). Thus, we applied a 2 × 2 experimental design to generate four groups of study, based on the maternal condition and the fructose intake. These groups were males born from CT rats, with tap water (CTC, n = 5) or water with fructose (CTF, n = 5) and males born from ALA rats, with tap water (ALAC, n = 5) or water with fructose (ALAF, n = 5). To minimize the litter effect, one offspring from each CT or ALA rat was included in each group, plus one offspring chosen randomly. Therefore, each group was composed of four animals born from each of the four CT or ALA rats plus one sibling (see Supplementary Fig. 1 for an illustration of the experimental design). Each animal was housed individually and received standard diet. Twice a week and for 30 days, body weight (BW) and water and food intake were measured and recorded. We performed the experiment during this period since feeding 10% fructose solution for 21 days already induces metabolic symptoms in the Wistar male rat,Reference Castro, Massa and Schinella24 but we continued the experiment until the animals reached a “plateau” in BW gain, which was between days 25 and 30 (see Fig. 1).
Progressive body weight gain. The line graph shows the accumulative weight gain every 3 or 4 days during the period on which 10% fructose solution was added to the water of rats born from dams fed with alpha-lipoic acid (ALAF) or control dams (CTF). ALAC and CTC: rats born from dams fed with ALA or control dams, respectively, and drinking tap water. Letters mean significant differences (p < 0.05) between a given group and (a) CTC group, (b) CTF group, (c) ALAC group, and (d) ALAF group.

Samples collection
Once concluded the experimental period, animals were fasted overnight and euthanized by cervical dislocation with guillotine after sedation. Rats were immediately decapitated after euthanasia, separating the head from the backbone cutting cranial to the axis of the vertebrae. Next, the posterior cranial bones were separated using forceps. With a scalpel, we cut the pituitary stalk and optic nerves to release the brain, which was then deposited onto a clean surface. Holding the brain upside down, the hypothalamus was dissected. The body carcass was lay in dorsal recumbency, and the abdominal skin and muscles were incised and reflected to expose the viscera. Liver was immediately removed, weighted, and sampled in three aliquots. These samples were snap-frozen in liquid nitrogen and then stored at −80°C. Intraabdominal white adipose depots (left epididymal, retroperitoneal, and mesenteric pads) were dissected following the description of Johnson and HirschReference Johnson and Hirsch25: Briefly, the left epididymal pad was removed by making a midline incision and pulling it up with a forceps, just distal to the major blood vessel in the base of the pad. The left retroperitoneal pad was dissected as a triangular section extending from a vertex in the inguinal region up the midline and continuing past the kidney. The perirenal fat was included as well (avoiding the brown fat around the large vessel going to the kidney). Finally, the mesenteric pad was dissected starting at the top of the duodenum, and “stripping” the intestine of the fat by pulling gently until the end of the colon. The dissected pads were weighted with a digital scale. Blood samples (~5 mL) were collected from the heart in tubes and centrifuged at 2500 g for 15 min. Serum samples were stored at −20ºC until processed for metabolites concentration determination.
Determination of reactive species oxygen (ROS) in liver
An aliquot of the liver sample for each rat was used to determine levels of ROS. Tissue ROS levels were determined using 2′,7′dichlorofluorescein-diacetate (DCFH-DA) (Sigma-Aldrich, St. Louis, MO, USA) methodReference Chen, Zhong and Xu26 with minor modifications. Liver samples were homogenized with 0.1 M sodium phosphate buffer (pH 7.4) at 4ºC and centrifuged at 1000 g and 4ºC for 10 min. The supernatant was incubated with 10 µM DCFH2DA in a 96 well plate for 30 min at 37ºC in the dark. The fluorescence intensity was determined using a multilabel plate reader GloMax luminescence spectrometer (Promega, USA) at an excitation wavelength of 485 and 535 nm emission. To correct background fluorescence, samples were incubated under the same conditions but without fluorescent dyes. Results were normalized by mg of tissue (fluorescence intensity/mg tissue) and expressed relative to the CTC group.
Determination of the antioxidant capacity of liver
The hepatic antioxidative capacity was assessed trough the glutathione oxidation assay (GSH) and the diammonium 2,2′-azino-bis(3-ethylbenzothiazoline-6-sulfonate (ABTS).
Estimation of Free Sulfhydryl Group (GSH): the total concentration of nonprotein sulfhydryl groups in liver homogenates was determined using Ellman’s reagent (DTNB) according to Sedlak & Lindsay.Reference Sedlak and Lindsay27 Briefly, liver pieces were homogenized (20% w/v) in ice-cold 10 mM phosphate buffer containing 0.15 M KCl (pH 7.4). Then, 850 µL of liver homogenate were added to 180 µL of 28% TCA and centrifuged at 6.000 × g at 4°C for 20 min, and 50 µL of clear supernatant was mixed with 450 µL TCA 5%. Thereafter, 1 mL of 0.4 M Tris-EDTA buffer (pH 8.9) and 50 µL of 0.01 M DTNB were added to the mixture. Absorbance was read within 5 min of the addition of DTNB at 412 nm against a reagent blank with no homogenate.
Measurement of antioxidant capacity by ABTS: this assay was based on the inhibition of the absorbance of the cationic radical of 2,2′-azino-bis-(3-ethylbenzothiazoline-6-sulfonate) (ABTS+), with a characteristic long-wavelength absorption spectrum showing maxima at 660, 734, and 820 nm by tested antioxidant. ABTS•+ radical is generated by reacting 7 mM ABTS water solution with 2.45 mM potassium persulfate in the dark for12–16 h. The antioxidant capacity of liver homogenate was measured as described by Katalinic et al. Reference Katalinic, Modun and Music28 with modifications: ABTS•+ solution was diluted with phosphate buffer saline pH 7.4 (PBS) to obtain an absorbance of 0.70 (±0.02) at 734 nm. After the addition of 1.0 mL of ABTS•+ solution to 10 μL of liver homogenate, or Trolox standard, the reaction mixture was incubated for 40 min at room temperature and then the absorbance measured at 734 nm. A Trolox calibration curve (0–200 μg) was settled, and the results were expressed as μg of Trolox equivalents/mg protein. Each sample was run in duplicate.
Histopathological examination of the liver
Hepatic tissue samples were fixed in 10% neutral formalin, dehydrated, embedded in paraffin, cut into 4 μm sections, and stained with hematoxylin and eosin following routine procedures. Histological evaluation and images’ captures were done with light microscope with a mounted camera (Leica DM500 Optical Microscope, 400 × magnification). For each slide, 10 randomly selected areas were captured. Digital pictures were analyzed with the ImageJ-Fiji software.Reference Schindelin, Arganda-Carreras and Frise29 Two investigators, blinded to the samples’ group information, determined the degree of pathological changes using a semiquantitative scale from 0 to 3, according to the adopted method described by Kačarević et al. Reference Kačarević, Grgić and Šnajder30 Grade 0: healthy liver without fatty infiltrates; Grade 1: minimal hepatocytes damage with small quantities of lipid droplets visible in the field; and Grade 2: moderate fatty infiltrates and more noticeable hepatocytes lesions than grade 1. Grade 3: large fatty infiltrates and significant lesions of the liver parenchyma.
Determination of serum metabolite concentration
Serum concentrations of total cholesterol, triglycerides, glucose, alanine transaminase (ALT), and alkaline phosphatase (ALP) were determined using enzymatic assays with reagents from Roche (Buenos Aires, Argentina) and processed with a Cobas 6000 (c501) analyzer. All serum samples were measured in duplicate for each assay. The triglycerides/glucose index was calculated as the natural logarithm of the product between triglycerides and glucose concentrations divided by two.Reference Guerrero-Romero, Simental-Mendía and González-Ortiz31
Quantitative real-time (qRT)-PCR
Messenger RNA was extracted from the hypothalami and livers using Trizol reagent (Thermo Scientific) according to manufacturer’s protocol. Isolated RNA concentration was determined with Nanodrop, and RNA was stored at −80ºC until cDNA conversion. An aliquot of the extracted RNA was converted to cDNA using M-MLV Reverse Transcriptase (Promega) following the methodology recommended by the manufacturer. The synthesized cDNA was stored at −20°C until qRT-PCR was performed.
The following genes were selected for mRNA measurement by qRT-PCR in the hypothalamus: Agrp (agouti related protein), Npy (neuropeptide Y), and Actb (β-actin), as housekeeping gene. In the liver, the mRNA levels of the following genes were measured: peroxisome proliferator-activated receptor delta (Ppard) and gama (Pparg), fatty acid synthase (Fasn), sterol regulatory element binding transcription factor 1 (Srebf1), and Actb.
Relative expression of selected genes was determined using primers (Invitrogen) and SYBR Green PCR Master Mix (Applied Biosystems). Primers were designed with Primer Express software (Applied Biosystems) from the corresponding Rattus norvergicus mRNA. Primers sequences and accession numbers are reported in Supplementary Table 1. All primer pairs had efficiencies greater than 95%. All samples were run in triplicate for each gene and for Actb. There were no differences in Actb expression among the groups. Relative mRNA expression of each gene was calculated by determining change in threshold cycle (ΔCt) between the mean Ct for each gene and the mean Ct for Actb mRNA from the same sample. The effect of the group on the gene expression was analyzed by ANOVA using the ΔCt values. Data were graphed as the mean fold change in expression in all the groups relative to the CTC group; fold change in each sample was calculated as 2−ΔΔCt, where ΔΔCt is the difference between ΔCt in each sample and the mean ΔCt in the CTC group.
Intake, body composition, and blood metabolites for rats in the four experimental groups. The table shows the values for body weight (BW) parameters, fat tissue, blood metabolites, and energy intake for rats – born from dams supplemented with alpha lipoic acid (ALA) – exposed to 10% fructose solution at 3 months of age (ALAF) or not (ALAC) and rats – born from control dams (CT) – exposed to 10% fructose solution (CTF) or not (CTC). Data are presented as average ± standard deviation. Symbols correspond to significant effects (p < 0.05) due to @maternal ALA intake; #offspring treatment with 10% fructose solution; (*)interaction between both variables. If the interaction was significant (*), groups were compared by the Tukey’s test, determining significant differences (p < 0.05) between a given group and (a) CTC group, (b) CTF group, (c) ALAC group, and (d) ALAF group

1 Ln (triglyceride [mg/dL] × glucose [mg/dL]/2).
2 Feed efficiency ratio = (body weight gain (g/day)/kcal intake/day) × 100.
Statistical analysis
Results from ALA concentration in liver and fructose intake were analyzed by t-test comparing both groups. Results from the BW gain were analyzed as time-repeated measures. Results from the remaining determinations were analyzed by two-way ANOVA, considering for the following fixed effects: maternal treatment (ALA or CT, n = 10 each), offspring experiment (F or C, n = 10 each), and the interactions between these terms (ALAF, ALAC, CTF, and CTC, n = 5 each). Each animal was treated as a random effect. In addition, the interaction term (groups ALAF, ALAC, CTF, and CTC) was initially considered in the covariance structure, to assume that each level of the group effect is associated with a different set of covariance parameters and to model heterogeneity in the covariance parameters. The homogeneity between the parameters was tested by imposing equality constraints. If the null hypothesis was rejected, the group effect (interaction term) was retained in the covariance structure. For the fixed effect terms, a Satterthwaite approximation for the denominator degrees of freedom was employed. When the interaction between both variables was significant (p < 0.05), pairwise comparisons of all group means were performed, and the multiple comparison adjustment for the p-values was done with the Tukey method. The GLIMMIX procedure of SAS (SAS® University Edition) was employed for all the analyses.
The criterion for achieving statistical significance was p < 0.05. Data are shown as mean ± standard deviation.
Results
Maternal ALA intake increases the levels of ALA in the liver tissue of the offspring
Levels of ALA were significantly higher in the one-month-old rats born from the rats fed with ALA compared to rats born from the Control rats (% peak area: 1.78 ± 0.09 vs. 1.52 ± 0. 25, respectively). These results suggest that ALA effectively reached the offspring tissue after maternal intake.
Maternal ALA intake prevents fructose-induced gain in BW and fat deposition in the offspring
These results are shown in Table 1. Both maternal ALA intake and fructose treatment significantly affected daily BW gain and average total BW gain, but the effect of fructose intake depended on whether the offspring was earlier exposed to ALA or not. BW gain was significantly higher in the CTF group and lower in the ALAC group, with no differences between the CTC and ALAF groups. The BW gain from weaning until 3 months of age, when the offspring experiment began, was similar between rats born from the ALA or CT mums (Supplementary Fig. 2). However, differences in BW gain for the CTF group were already significant at 7 days of 10% fructose solution administration and continued to significantly increase for the rest of the experiment (Fig. 1). At necropsy, intraabdominal fat tissue was affected by both maternal ALA intake and fructose treatment, but again, the effect of this last variable depended on the first one. Fat levels were different for each group, being higher in the CTF group, followed by the ALAF, CTC, and ALAC groups. The relationship between adipose tissue and BW was lower for the offspring born from ALA-fed rats (2.03 ± 0.37 vs. 3.18 ± 0.51, ×100 values) and for those not challenged with fructose postnatally (2.31 ± 0.54 vs. 2.91 ± 0.81, ×100 values).
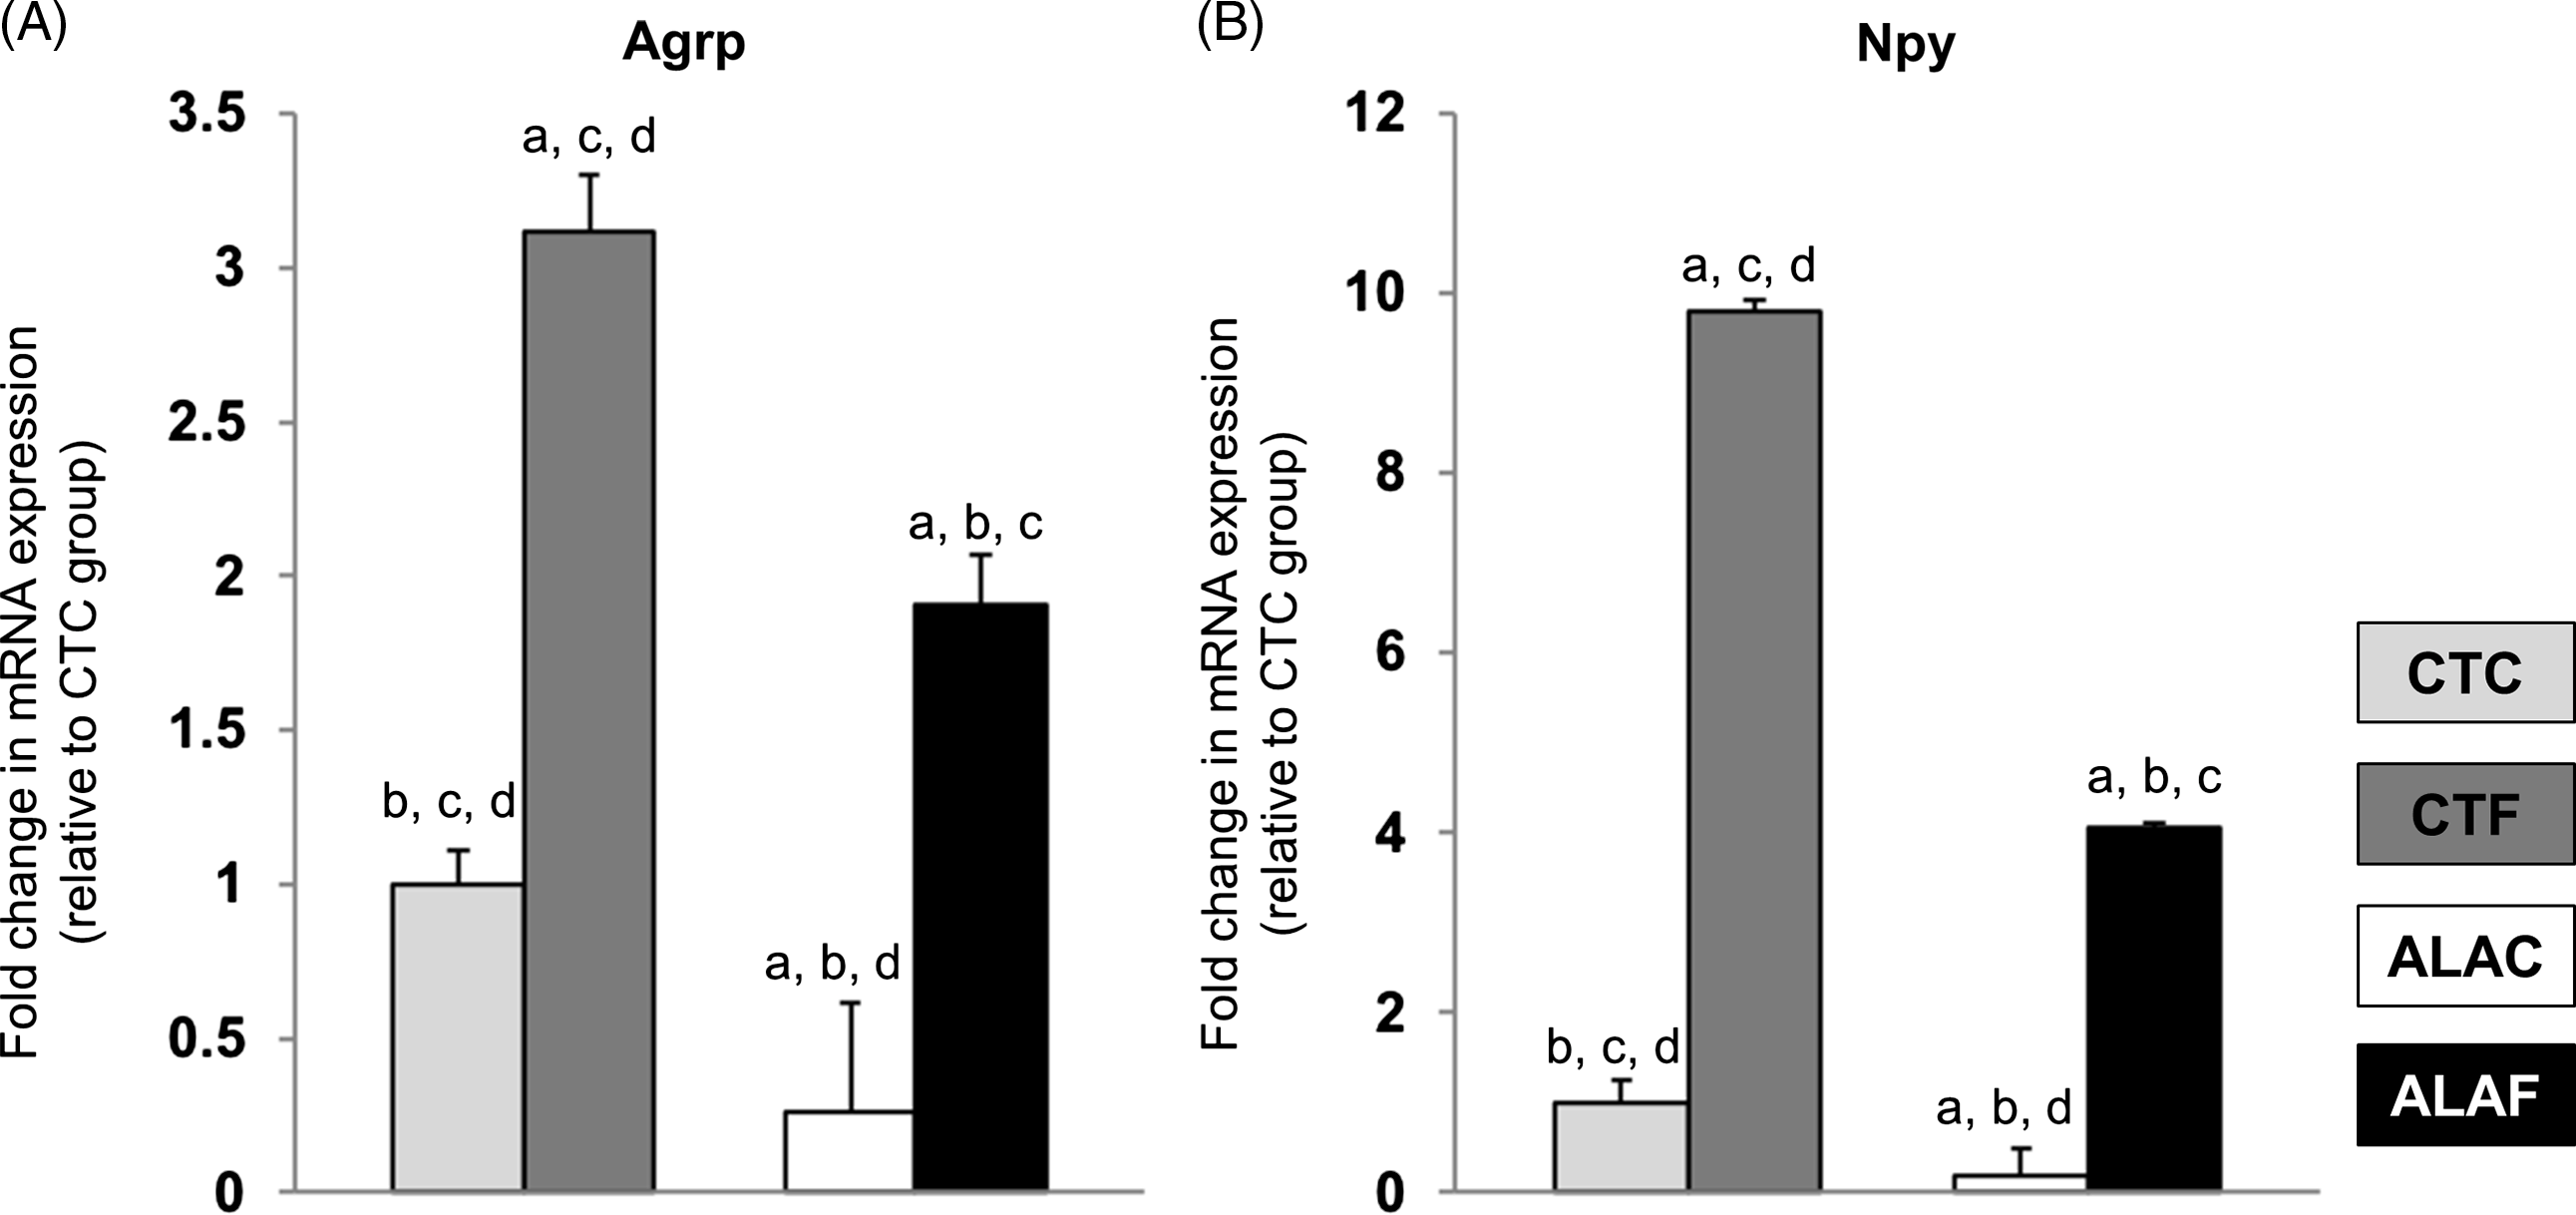
mRNA expression measured by qRT-PCR in the hypothalami of rats after the experimental period. mRNA expression for each group is shown as fold change ± standard deviation with respect to the CTC group for: (A) Agouti-related protein (Agrp) and (B) neuropeptide Y (Npy). CTC: rats born from control dams; CTF: also exposed to fructose postnatally. ALAC: rats born from dams supplemented with alpha lipoic acid; ALAF: also exposed to fructose postnatally. Interactions between main variables (maternal ALA intake and fructose treatment) were significant (p < 0.05) for both genes. Letters mean significant differences (p < 0.05) between a given group and (a) CTC group, (b) CTF group, (c) ALAC group, and (d) ALAF group.

Triglyceride and glucose levels, and the index between both metabolites, were significantly higher in the CTF group compared to the other three groups. For glucose, concentrations in the ALAF group were also higher compared to the CTC group. The interaction between maternal ALA intake and fructose treatment was significant for both metabolites, meaning that the effect of fructose intake on their levels depended on whether the offspring was early exposed to ALA or not. Total lipid level was lower for the offspring born from ALA-fed rats (325.3 ± 27.08 vs. 353.2 ± 29.59 mg/dl) and for those not treated with fructose postnatally (326.9 ± 27.40 vs. 351.6 ± 32.15 mg/dl). There were no significant changes in cholesterol levels.
Although BW gain and fat tissue were higher in the CTF group, the average daily food and fructose intake did not differ between all groups or F groups, respectively, and so the average in Kcal intake per day was not statistically different among groups. However, the feed efficiency ratio (calculated as BW gain (g/day)/kcal intake/day)×100) was lower for the ALA-fed rats (2.04 ± 0.46 vs. 3.13 ± 0.70) and for those not challenged with fructose postnatally (2.18 ± 0.58 vs. 2.99 ± 0.83). Numerically, the relationship was lowest in the ALAC group, meaning that rats in this group required more calories per day to gain 1 g of BW.
Expression levels of the orexigenic neuropeptides Agrp and Npy were affected by both the maternal treatment and fructose intake, but the effect of this last variable depended on the first one. mRNA levels were different in each group, being higher in the CTF group, and followed by the ALAF, CTC, and ALAC groups (Fig. 2).
Maternal ALA intake ameliorates fructose-induced liver metabolic changes
At the end of the experiment, liver weight (Table 2) was lower for the offspring born from ALA-fed rats (9.64 ± 1.09 vs. 10.70 ± 0.67 g, respectively) and for those not treated with fructose postnatally (9.76 ± 0.66 vs. 10.59 ± 1.25 g, respectively). Rats that drank water with a 10% fructose solution showed a less favorable histopathological score in the liver sections and presence of microsteatosis (Fig. 4).
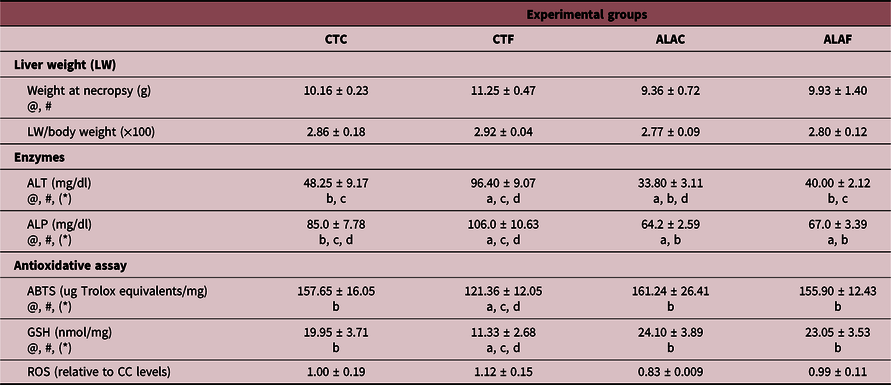
Hepatic parameters for rats in the four experimental groups. The table shows the values for liver weight, blood levels of hepatic enzymes levels, and tissue levels for assays determining liver antioxidative capacity in rats – born from dams supplemented with alpha lipoic acid – exposed to fructose at three months of age (ALAF) or not (ALAC) and rats – born from control dams – exposed to fructose (CTF) or not (CTC). ALT: alanine transaminase. ALP: alkaline phosphatase. ABTS: Diammonium 2, 2′-azino-bis(3-ethylbenzothiazoline-6-sulfonate assay. GSH: glutathione oxidation assay. ROS: reactive species oxygen. Data are presented as average ± standard deviation. Symbols correspond to significant effects (p < 0.05) due to: @maternal ALA intake; #offspring treatment with 10% fructose solution; (*)interaction between both variables. If the interaction was significant (*), groups were compared by the Tukey’s test, determining significant differences (p < 0.05) between a given group and (a) CTC group, (b) CTF group, (c) ALAC group and (d) ALAF group

Seric levels of ALT and ALP, two enzymes negatively correlated with hepatic functionality, were significantly affected by ALA maternal intake and fructose treatment, but this last variable depended on whether the offspring was born from the ALA-fed mums. Levels for both enzymes were higher in the CTF group compared to the other three. In addition, ALT levels were lower in the ALAC group, while for ALP levels were lower in both ALAF and ALAC groups. Fructose intake also affected the oxidative capacity of the liver, but this effect was prevented by maternal ALA intake. Levels of ABTS and GSH were lower in the CTF group compared to the other three, without changes between them. Numerically, relative levels of ROS were higher in the CTF group, but there were no significant effects (Table 2).
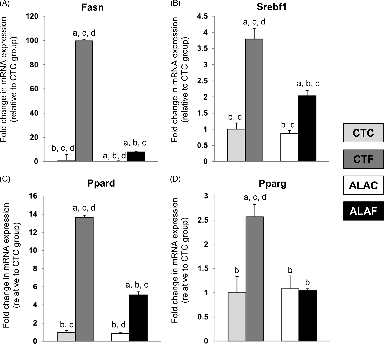
Fig. 3 shows the relative expression levels of genes related to fatty acid synthesis (Fasn), metabolism, and regulation (Srebf1, Ppard, and Pparg). Intake of water with a 10% fructose solution induced a significantly higher expression of Fasn that interestingly was prevented by ALA administration. In addition, levels of Fasn were significantly lower in the ALAC group. A similar trend was observed for Srebf1 and Ppard, although the differences in fold change were not so pronounced as for Fasn, and expression levels in CTC and ALAC groups did not differ. Pparg expression levels were higher in CTF compared to the other three groups, with no differences between these three.
mRNA expression measured by qRT-PCR in the liver of rats after the experimental period. mRNA expression for each group is shown as fold change ± standard deviation with respect to the CTC group for: (A) Fatty acid synthase (Fasn), (B) sterol regulatory element-binding transcription factor 1 (Srebf1), (C) peroxisome proliferator-activated receptor delta (Ppard), and (D) Ppar gamma (Pparg). CTC: rats born from control dams; CTF: also exposed to fructose postnatally. ALAC: rats born from dams supplemented with alpha-lipoic acid; ALAF: also exposed to fructose postnatally. Interactions between main variables (maternal ALA intake and fructose treatment) were significant (p < 0.05) for all genes. Letters mean significant differences (p < 0.05) between a given group and (a) CTC group, (b) CTF group, (c) ALAC group, and (d) ALAF group.

Histopathological liver analysis. (A) Representative images of histopathological liver analysis. Hepatocytes with microvesicular steatosis (arrow), large fat vacuoles (open arrow), and small sinusoidal dilatation of 1 µm in diameter (asterisk) were observed. The nuclei have maintained their central position. Staining: Hematoxilin & Eosin. Magnification 400× (10 µm scale bar). (B) Degree of pathological changes using a semiquantitative scale. Grade 0: healthy liver without fatty infiltrates; Grade 1: minimal hepatocytes damage with small quantities of lipid droplets visible in the field; and Grade 2: moderate fatty infiltrates and more noticeable hepatocytes lesions than grade 1. Both main variables (maternal ALA intake and fructose treatment) affected the corresponding scores (p < 0.05). CTC: rats born from control dams; CTF: also exposed to fructose postnatally. ALAC: rats born from dams supplemented with alpha-lipoic acid; ALAF: also exposed to fructose postnatally. Letters mean significant differences (p < 0.05) between a given group and (a) CTC group, (b) CTF group, (c) ALAC group, and (d) ALAF group.

Discussion
ALA is a potent antioxidant that acts as an essential cofactor of mitochondrial enzymes involved in oxidative metabolismReference Salehi, Berkay Yılmaz and Antika8 and has been used as a dietary supplement to treat obesity and reduce body weight.Reference Kucukgoncu, Zhou and Lucas32–Reference Vajdi and Abbasalizad Farhangi34 However, the effect of ALA treatment appears to be transient, since experimental animals immediately regain body weight after ALA treatment is terminated,Reference Kim, Park and Namkoong11 and potential long-term effects of ALA administration on weight gain have not been elucidated. ALA, acting through the suppression of the AMP-activated protein kinase (AMPK),Reference Kim, Park and Namkoong11 indirectly reduces dietary energy intake and lipogenesis, while it increases energy expenditure,Reference Wang, Li and Guo35 lipolysis, and insulin sensitivity.Reference Castro, Villagarcía and Massa36–Reference Valdecantos, Pérez-Matute and Prieto-Hontoria38 ALA is hydrophobic and can cross biologic membranes reaching the fetal hypothalamus after parenteral administration to a pregnant animal.Reference Koga, Ishida and Takeda12 Thus, ALA could permanently alter the energy regulatory network in the fetus given the developmental plasticity effectReference Zhu, Cao and Li39 and prevent metabolic diseases later in life.
In our work, the period of ALA supplementation to the dams was coincidental with the development of fetal hypothalamic NPY/AGRP neurons, which play a central role in the control of the energy regulatory network.Reference McMillen, Adam and Mühlhäusler18,Reference Loh, Herzog and Shi40 Since ALA can also cross the maternal blood-brain barrier when ingested during pregnancy, it could also enter into the mammary gland and be excreted in the milk. Thus, the newborn may have been also exposed to ALA through breast milk in the postnatal period. Accordingly, we found that the hepatic ALA content was significantly higher in the offspring born from the ALA fed rats compared to the controls. The difference could have been attributed to the accumulation of the external ALA, to a higher endogenous production because of the activation of the enzyme lipoic acid synthase (LASY), or to both effects. In addition, we cannot rule out which period of ALA exposure could have affected the offspring, if not the entire period. These questions were not addressed in the current work but could be resolved in future studies. However, the present study demonstrated that maternal ALA intake administered during the critical developmental period mentioned above modified offspring metabolism such that metabolic dysregulation was less severe during adulthood when challenged with a 10% fructose solution in water.
Some reported effects in animals consuming fructose in drinking water are increased BW, a higher amount of fat tissue, and hypertriglyceridemia, in addition to dyslipidemia, de novo lipogenesis, and insulin resistance.Reference García, Gutiérrez-Lara and Centurión41–Reference Castro, Massa and Arbeláez44 In our study, animals challenged with high fructose in the drinking water during adulthood but exposed to ALA during early life (ALAF group) demonstrated significantly less amount of BW gain and fat tissue and lower concentrations of circulating triglycerides and glucose than animals also treated with a 10% fructose solution in water during adulthood but born from the CT mums (CTF group, Table 1). In addition, the rate of BW gain for rats in the ALAF group during the high fructose challenge was similar to the untreated animals (CTC group, Fig. 1). This effect was not the results of less food intake, because the four experimental animal groups had comparable daily consumption, and the fructose intake for CTF and ALAF groups was also not significantly different. One possible explanation for this effect is that rats exposed in utero and during lactation to ALA had a higher energy expenditure, which is one of the metabolic actions of ALA,Reference Wang, Li and Guo35 but energy expenditure was not objectively measured in the present study.
Although average daily fructose intake did not differ between groups, the mRNA expressions of the orexigenic neuroptides Npy and Agrp were increased in the fructose-consuming groups. However, this magnitude of the increase depended on whether the animals were born from the mums supplemented with ALA, i.e., expression levels were significantly lower in the ALAF compared to the CTF group. The ALAC group (animals exposed to ALA during early life) presented the lowest mRNA levels for both neuropeptides (Fig. 2). Elevation of Npy mRNA levels was observed by Bursac et al. Reference Bursać, Vasiljević and Nestorović45 after feeding male Wistar rats with 60% fructose solution for 9 weeks. These authors showed that high-fructose intake leads to hypothalamic leptin resistance and an overactivation of the NPY system. Unfortunately, we did not measure plasmatic leptin or insulin concentrations in the rats from the present study, and thus we cannot conclude that the fructose-fed animals developed leptin/insulin resistance, as reported elsewhere.Reference García, Gutiérrez-Lara and Centurión41,Reference Castro, Massa and Arbeláez44,Reference Abdelkarem, Fadda and Hassan46–Reference Sadeghi, Beigy and Alizadeh48 Nevertheless, rats in the CTF group presented the highest triglyceride/glucose index, which is highly correlated with insulin resistanceReference Guerrero-Romero, Simental-Mendía and González-Ortiz31 (Table 1). Rats in the ALAF group presented lower glucose and triglyceride levels than rats in the CTF group, again suggesting the protective effect of maternal ALA consumption.
This concept was reinforced by the expression of genes related to lipid and carbohydrate metabolism (Fig. 3). It has been demonstrated that high-fructose intake leads to an increase in the mRNA levels of the Fasn, Srebf1, and Pparg in the adipose tissue in rats.Reference Bursać, Vasiljević and Nestorović45 Pparg is one of the key early regulators of adipogenesis, while Fasn is responsible for the formation of mature adipocytes,Reference Moseti, Regassa and Kim49 and its expression is stimulated by activated Srebf1, which has been previously associated with acceleration of adipogenesis.Reference Moseti, Regassa and Kim49 While the expression of Fasn, Srebf1, Pparg, and Ppard (which also contributes with liver lipogenesisReference Han, Shen and Bittner50) was significantly higher in the liver of rats in the CTF group, ALA administration downregulated expression in the ALAF group, suggesting an early life regulation of the expression of genes related to the hepatic de novo triglyceride synthesis. It is worthy of note that the expression of Fasn was strongly increased in the CTF group (around 592, 99, and 12 fold more than in the ALAC, CTC, and ALAF groups, respectively) and again the ALAC group showed the lowest levels of expression (around sixfold less than the CTC group). Accordingly, liver samples from animals in the CTF and ALAC groups showed the highest and lowest score in the histopathological analysis, respectively. In addition, the presence of microvesicular steatosis, which is highly correlated with fatty liver disease,Reference Tandra, Yeh and Brunt51 was observed in the liver of CTF, but not ALAF group (Fig. 4).
The protective effect of maternal ALA supplementation on liver metabolism in the offspring was also evident by the lower serum concentration of ALT and ALP in the ALA groups and the increased antioxidant capacity of the liver (Table 2). Hepatic oxidative stress triggered by fructose (CTF group) was circumvented by maternal ALA intake (ALAF group). These results were also observed by Castro et al.,Reference Castro, Massa and Schinella24 who applied a 2 × 2 experimental design, feeding Wistar male rats with 10% fructose in the water for 21 days, and/or injecting ALA (35 mg/kg, i.p.) during the five last days of the experiment. In addition, the authors reported comparable results for hepatic expression of Srebf1, Fasn, and Ppard, but not Pparg. Nevertheless, it is important to consider than in the current study, ALA was given to the mother and not directly to the grown animals during the period they were challenged with the 10% fructose solution, supporting the concept of a metabolic programming effect of ALA in the offspring. Whether these beneficial effects of maternal ALA intake operate through epigenetic modifications and/or affecting the activity of AMPK in the hypothalamic and hepatic tissue of the offspring remains to be explored.
This theory could have important implications for human health since ALA intake during pregnancy could potentially help to prevent the development of MetS in the adult offspring. Furthermore, a retrospective study done in pregnant women showed that oral intake of ALA for at least 7 weeks during late gestation (until the end of the 37th gestational week) is safe for both mother and newborn.Reference Parente, Colannino and Picconi52 Of course, the dose of ALA administered to pregnant women in this study was much lower than that for the gravid rats in our experiment. Specifically, the pregnant rats consumed approximately 300 mg/kg BW daily, while the dose in the human study was 600 mg per day or 9.2 mg/kg for a 65 kg person. Even though the ALA dose used in our study was higher, it is possible that the beneficial effects would be observed at lower doses, but this needs to be tested. Nevertheless, the results presented here could open a new chapter in the search for preventive measures of metabolic diseases.
Conclusion
In summary, maternal ALA intake permanently modified fetal/neonatal metabolism such that adult male offspring were protected from the detrimental metabolic effects of continuous intake of fructose, a potent obesogenic stimulus. Further investigation is required to determine the precise mechanism of action of ALA during fetal/neonatal life that leads to its beneficial actions on metabolism.
Acknowledgements
The authors thank technicians Veronica Diaz, Sonia Alza, and Gina Mazzudulli (INICSA), Dr. Cristian Galvan (LACE laboratory), and Dr. Graciela Panzetta-Dutari (UNC).
Supplementary material
For supplementary material referred to in this article, please visit https://doi.org/10.1017/S2040174420001178
Financial Support
This study was partially supported with a grant from CONICET to MBR and DB (PIP 11220150100947).
Conflicts of Interest
None.
Ethical standards
The authors assert that all procedures contributing to this work comply with the ethical standards of the relevant national guides on the care and use of laboratory animals (Medicine School of the Cordoba National University; UNC-RHCS 674/09) and have been approved by the institutional committee (N° 75/18).