BACKGROUND AND MOTIVATION
In the past, high-stakes English tests have privileged traditionally standard varieties of English, such as British English, and more recently, American English. However, with the rise in World Englishes (WE), many scholars have acknowledged the benefits of including traditionally nonstandard varieties of English in international English assessments, while trying to figure out the most responsible and fair way to do so. If done without an empirically supported strategy, it is possible, and even likely, that incorporating native and nonnative varieties of English could result in test bias (Elder & Harding, Reference Elder and Harding2008; Ockey & French, Reference Ockey and French2016; Ockey & Wagner, Reference Ockey and Wagner2018) such as a shared-L1 advantage (Harding, Reference Harding2012).
Because of this, several studies have investigated the effects of nonnative speaker accent on listening comprehension. Major, Fitzmaurice, Bunta, and Balasubramanian (Reference Major, Fitzmaurice, Bunta and Balasubramanian2002) found that both native and nonnative English speakers performed lower on listening comprehension when listening to nonnative English speech. A later study by the same authors examined the effects of using regional, ethnic, international, and Standard American English dialects of English for listening comprehension and found that ESL listeners experienced more difficulty with ethnic and international varieties than with regional or Standard American English (Major, Fitzmaurice, Bunta, & Balasubramanian, Reference Major, Fitzmaurice, Bunta and Balasubramanian2005). Abeywickrama (Reference Abeywickrama2013) discovered that, although the data produced by test takers in TOEFL listening comprehension tasks was not different when the input was delivered by a native or a nonnative English speaker, test takers had an overwhelming preference for American and British speech stimuli. Using differential item functioning, Harding (Reference Harding2012) found evidence of an L1 advantage for Japanese listeners on some items but a more robust advantage across several items for Mandarin listeners. More recently, Kang, Thomson, and Moran’s (Reference Kang, Thomson and Moran2019) study demonstrated that nonnative English listeners performed equally well on listening comprehension when hearing a nonnative English speaker as they did with a native English speaker, provided the nonnative speaker was highly intelligible. Despite these rather mixed results, researchers have made preliminary recommendations to include different English varieties as test stimuli based on their results as long as precautions are taken. Ockey and Wagner (Reference Ockey and Wagner2018) have laid out four possible ways to ethically include nonnative varieties, in part dependent on the purpose of the assessment. However, in these studies regarding comprehension of nonnative English speech, the construct of listener proficiency level has been underresearched and thus undertheorized.
In this study, we refer to listening comprehension and intelligibility. Listening comprehension has been described as a process in which
the listener takes the incoming data, the acoustic signal, and interprets that, using a wide variety of information and knowledge … it is an inferential process, an ongoing process of constructing and modifying an interpretation of what the text is about, based on whatever information seems relevant at the time. (Buck, Reference Buck2001, p. 29)
Listening comprehension is traditionally measured in applied linguistics research by presenting a listener with an (audio-recorded) excerpt of speech and then asking questions regarding the information in the excerpt. For the latter construct, we draw on Derwing and Munro’s (Reference Derwing and Munro2005, p. 385) listener-focused definition: “[t]he extent to which a listener actually understands an utterance.” Although controversial, intelligibility is often operationalized (as we operationalize it here) as the percentage of words correctly transcribed by listeners. Intelligibility is commonly considered a coconstructed phenomenon between speakers and listeners (Seidlhofer, Reference Seidlhofer2004).
PROFICIENCY LEVELS OF HIGH-STAKES, LARGE-SCALE ENGLISH PROFICIENCY TEST TAKERS
Every year, millions of English language learners take high-stakes, large-scale English proficiency tests. These assessments provide a variety of functions: they can serve to make important educational decisions, such as whether a student will graduate (e.g., Nichols, Reference Nichols2016); admit students into institutions of higher education in English speaking countries; and ascertain the proficiency level of English language learners for their occupations, such as pilots and air traffic controllers (Downey, Suziki, & Van Moere, Reference Downey, Suziki and Van Moere2010). Many countries have implemented their own statewide high-stakes English assessments, such as the Common Educational Proficiency Assessment (CEPA) in English, which is administered to Grade 12 students in the United Arab Emirates for placement purposes (Coombe & Davidson, Reference Coombe and Davidson2014). Beyond national boundaries, testing organizations have developed international tests of English that often have gatekeeping purposes.
High-stakes English assessments vary considerably with regard to their purposes, scope (both geographic and linguistic), and target populations. Each of these components must be taken into account in test development. When considering the implications of including nonnative varieties of English into a test, for example, the demographic information of test takers, including their proficiency level, may be a critical factor in the determination of fairness and feasibility.
While test-taker demographics vary for each high-stakes assessment, we will focus here on two of the most well-known international tests of English: the Test of English as a Foreign Language (TOEFL), created by the Educational Testing Service (ETS), and the International English Language Testing System (IELTS), developed by the British Council, IDP Education, and Cambridge English Language Assessment. TOEFL and IELTS are taken by the majority of English language learners who will be residing in an English-speaking country for work or study. Other assessments also serve the same, or similar, purposes (such as the Test of English for International Communication [TOEIC]).
More than 30 million people throughout the world have taken the TOEFL, most as a prerequisite to studying in an English-speaking country (ETS TOEFL, 2018a). A breakdown of test takers, according to the TOEFL website, includes students planning to study at a higher education institution, scholarship and certification candidates, English language learners who wish to track their progress, and students and workers applying for visas. The average English skill level of TOEFL test takers ranges between intermediate and advanced. Specific to this study, Korean test takers’ mean scores in 2017 were reported as 22 (reading), 21 (listening), 20 (speaking), and 21 (writing) for a total of 84 out of a possible 120 (ETS TOEFL, 2018b).
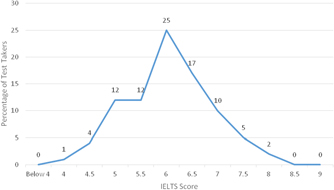
IELTS has seen a rise in test takers, with more than three million having completed the test in the past year (IELTS, 2018a). IELTS uses a nine-band scale to report proficiency level, with a 9 indicating an “expert user” and a 1 indicating a “nonuser” of English (0 means that the test taker did not attempt the test). Mean band scores for 2016 (the most current year of reported data) ranged between 5.9 and 6.3 (with differences for gender and for the academic general training versions of the test); for the listening section, mean bands ranged from 6.1 to 6.5. Thus, the mean test taker is deemed a “competent user.” The description for this label claims that “[t]he test taker has an effective command of the language despite some inaccuracies, inappropriate usage and misunderstandings. They can use and understand fairly complex language, particularly in familiar situations” (IELTS, 2018b). The vast majority of Korean test takers (86%) scored between a 5 and 7 in 2017 (IELTS, 2019; see Figure 1).
Score distribution of Korean IELTS test takers (IELTS, 2019).

As it now stands, the TOEFL iBT (internet-based test) includes native English speaker accents from North America, the United Kingdom, New Zealand, and Australia; “ETS added these accents to better reflect the variety of native English accents [a test taker] may encounter while studying abroad” (ETS TOEFL, 2018a). Similarly, IELTS claims to treat “all test takers with the utmost fairness and respect by actively avoiding cultural bias, and accepting all standard varieties of native speaker English, including North American, British, Australian, and New Zealand English” (IELTS, 2018a). Thus, as high-stakes tests include more varieties of English with an aim to be more ecologically valid, it is imperative to see how particular demographics of test takers could be influenced differently.
LISTENER PROFICIENCY AND LISTENING COMPREHENSION
Research has confirmed that comprehension of speech involves a complex interplay of speaker-, listener-, and context-dependent factors (Schmidgall, Reference Schmidgall2013). A large body of recent research in applied linguistics has studied the effects of listener-dependent factors on comprehension, specifically in interactions in which the interlocutors have different first languages. The three main foci of this research are the effect of (strength of) L1 accent on listening comprehension (Abeywickrama, Reference Abeywickrama2013; Anderson-Hsieh & Koehler, Reference Anderson-Hsieh and Koehler1988; Kang & Moran, Reference Kang, Moran, Ockey and Wagner2018; Ockey & French, Reference Ockey and French2016; Ockey, Papageorgiou, & French, Reference Ockey, Papageorgiou and French2016; Smith & Bisazza, Reference Smith and Bisazza1982), the effect of accent familiarity on listening comprehension (Adank, Evans, Stuart-Smith, & Scott, Reference Adank, Evans, Stuart-Smith and Scott2009; Gass & Varonis, Reference Gass and Varonis1984), and the potential effect of a shared-L1 (also known as an interlanguage speech intelligibility benefit; Harding, Reference Harding2012; Kang, Thomson, & Moran, Reference Kang, Thomson and Moran2018a; Major et al., Reference Major, Fitzmaurice, Bunta and Balasubramanian2002). This research has proliferated in recent years as increased global mobility has caused the need for an updated conceptualization of theoretical frameworks, pedagogical methodologies, and language assessments.
While several factors have been investigated to determine their effects on listener comprehension, listener proficiency level has received a scant amount of attention. There seems to be an assumption that listeners with lower proficiency in the target language will perform worse on tasks of listening comprehension, and indeed, this makes intuitive sense. As yet, though, we are unaware of any research that has specifically used nonnative English speakers’ proficiency level as a variable when determining the influence of accented speech on listening comprehension.
In one study that focused on listening comprehension, Abeywickrama included 110 test takers in her study who represented “typical international students who would attend US universities” (2013, p. 62). The Korean and Brazilian test takers were identified as high intermediate, while the Sri Lankan listeners were considered to be low intermediate level, as judged by their performances on placement tests and the syllabi for their respective ESL classes. However, proficiency level was not a variable in this study; all 110 listeners were combined as one group.
Ockey and French (Reference Ockey and French2016) and Ockey et al. (Reference Ockey, Papageorgiou and French2016) likewise did not control for proficiency level when investigating listening comprehension. Their listener participants included all TOEFL iBT test takers on two consecutive weekends (N = 21,726). Major et al. (Reference Major, Fitzmaurice, Bunta and Balasubramanian2002) recruited 400 speakers: 100 each from the United States, China, Japan, and Colombia. The 100 native English speakers were undergraduate and graduate students, while the 300 nonnative speakers were “selected from potential TOEFL takers” (p. 178). They also did not use proficiency as a variable. In a subsequent study, Major et al. (Reference Major, Fitzmaurice, Bunta and Balasubramanian2005) collected data from 180 potential TOEFL takers who resided in the United States and included several different L1s. In each of these studies, speakers’ L1 accent was the target variable, so there was no need to differentiate listeners by proficiency level.
In fact, little research has exhibited strict control over listeners’ proficiency levels. Some studies draw on well-educated native listeners in the effort to have a participant pool with high proficiency with the assumption that a native speaker is a highly proficient listener. However, this assumption is rarely confirmed through assessment. In Kang, Thomson, & Moran (Reference Kang, Thomson and Moran2018a, Reference Kang, Thomson and Moran2019), it was found that the native English listeners performed significantly worse, in fact, than the highly proficient nonnative speakers on TOEFL simulated listening comprehension tests. This indicates the need for more rigorous listener proficiency assessment in different varieties of accents.
In a study that did assess and control for proficiency, Kang et al.’s (Reference Kang, Thomson and Moran2018a) study accepted only highly proficient listener participants. They argued that a wide range of proficiency levels could add a confounding variable into the analysis; they thus controlled for proficiency (accepting only those with TOEFL iBT scores of 100 or higher) to obtain a less complicated picture of the relationship between intelligibility and comprehension. However, Kang and colleagues noted that, by doing this, they were limiting the generalizability of their findings. Listener proficiency level was controlled for, but was not a variable in, this study.
Kang et al. (Reference Kang, Thomson and Moran2019) also demonstrated that listeners scored as well on listening comprehension with nonnative English speakers as they did with native English speakers, as long as the nonnative speakers were highly intelligible. Accordingly, they tentatively suggested the incorporation of nonnative English varieties into large-scale English assessments. However, upon further reflection, they realized that this conclusion was only valid for highly proficient listeners. It was yet unclear how lower proficiency learners would react to nonnative accented speech, and whether it would affect them disproportionately. Thus, the current study, which is a partial replication of Kang et al. (Reference Kang, Thomson and Moran2018a, Reference Kang, Thomson and Moran2019), applied much of the methodology and materials (albeit in abbreviated format) to a different demographic of listeners. The aim was to ascertain whether speech stimuli including different WE accents would have the same results for lower proficiency listeners as they did for high-proficiency listeners. Based on this previous research, the following question guided our study: To what extent do listeners’ proficiency levels affect their comprehension ratings and ability to accurately transcribe different WE accents?
METHODS
SPEAKERS
Ten speaker participants provided the stimuli for the listening comprehension tasks: one American, one British, two South African (L1 Afrikaans), two Indian (L1 Hindi), two Mexican (L1 Spanish), and two Chinese (L1 Mandarin). These countries were selected because they represented the Inner Circle (American and British), Outer Circle (South African and Indian), and Expanding Circle (Mexican and Chinese), according to Kachru’s (Reference Kachru1992) Concentric Circle Model. Because speakers’ dialects vary greatly within these countries, care was taken to ensure that participants were similar in their geographic origins and linguistic features. In addition, speakers’ education levels were controlled as all of them were university professors with graduate degrees. For the countries with more than one speaker, one represented high comprehensibility and the other represented low comprehensibility as determined by a combination of 8 trained raters and the evaluations of 48 listeners. (For more information on speaker selection Kang et al., Reference Kang, Thomson and Moran2018b.) Using a 7-point Likert scale for comprehensibility ratings (1 = easy to understand and 7 = difficult to understand), high-comprehensibility speakers ranged from 1 to 2, and low-comprehensibility speakers ranged from 4.5 to 5. Thus, six speakers could be categorized as high comprehensibility (the American, British, and one from each of the other L1s) and four as low comprehensibility (one South African, one Indian, one Mexican, and one Chinese). These speakers were selected, screened, and validated as part of a larger project (Kang et al., Reference Kang, Thomson and Moran2018b).
RECORDINGS AND MATERIALS
Speakers recorded two types of tasks: 1 TOEFL listening passage and 90 transcription sentences (from which the research team randomly selected three per speaker to embed into the survey). The sentences were adapted from previous research in first language intelligibility (Munro & Derwing, Reference Munro and Derwing1995; Sakiey & Fry, Reference Sakiey and Fry1979). The TOEFL listening passages were controlled to minimize differences in comprehension scores based on passage. For example, they were all between 500 and 800 words in length, each had six comprehension questions, contained topics appropriate for university students such as planet formation, and featured a “professor’s” monologic speech. The passages also underwent a screening and validation process that resulted in eliminating the most difficult and easiest so that all passages were roughly equivalent in item difficulty and discrimination. See Kang et al. (Reference Kang, Thomson and Moran2018b) for more details on this analysis.
An obvious methodological concern for this study involves how the effects of accent can be parsed out from other aspects of listener proficiency, such as vocabulary knowledge. In other words, assuming we find differences in listener groups’ scores, how can we know that they were caused by phonological accent rather than unfamiliarity with the English terminology present in the listening comprehension passages as well as the questions and answers? Three aspects of the study addressed this issue. First, we included two native English varieties (British and American), which gave us insight into listeners’ baseline comprehension of native English speakers on phonological variation. Initial independent t test analyses confirmed that there was no significant difference in listening comprehension for all listeners (i.e., M = 2.94 for American and M = 3.42 for British) and intelligibility scores (i.e., M = 77.35 for American and M = 75.53 for British) when the listeners heard these two native English varieties: p = .084 and p = .558, respectively. Listeners’ relatively equal rating pattern with the two native varieties led to a conclusion that any significant difference found in the comprehension and intelligibility scores of non-inner-circle varieties could be attributable to phonological accent. Second, we conducted a vocabulary screening test, as described in the following text. Third, we conducted a vocabulary profile on the 10 listening comprehension passages through Compleat Lexical Tutor (Cobb, Reference Cobb2016). This analysis determined that 82.26% of words in the passages were K1 words, meaning that they are included in the 1,000 most frequently used words in English. An additional 4.81% were deemed K2 words (the second thousand most frequently used words), and 3.28% could be found on the Academic Word List. Type-token ratio was .25. Although it by no means guarantees that listeners knew all the words in the passages, this vocabulary profile indicated that the vast majority of the words in the recordings would have been previously encountered by all listener groups. While this analysis of lexical density and sophistication does not fully explain the multifaceted relationship between text features and task features that contributes to listening difficulty, it does provide a solid basis of control of the task stimuli (Révész & Brunfaut, Reference Révész and Brunfaut2013).
Speakers were asked to record the passage and sentences at their own convenience and e-mail them to our research team. They were instructed that they could record their speech files with whichever software they found most comfortable. Most of them recorded on their smart phone devices, which, despite the relative novelty of this technology for recording purposes, produced sound files of surprisingly high quality. They were also told that they could save the file in any format. Once it was received by e-mail (through Google Docs), the speech file was converted to a .wav file (if it was not already in that format) using the program Freemake Audio Converter. Once all the sound files were collected, they were screened for sound quality and volume. To ensure that there was no unnecessary silence or distracted noise in the speech files, the recorded utterances were edited visually and aurally from a waveform display using PRAAT. Speakers whose sound files were poor in quality were asked to rerecord with different recording technology. Sound editing through the software program Audacity facilitated with some sound issues. Once sound files were ready, they were embedded into SurveyGizmo. Three versions of the survey were created with the same stimuli but in different orders to prevent an order effect. Each link was then randomly but equally distributed to the participants.
LISTENERS
Ninety-two listeners participated from several universities in South Korea. South Korean listeners were chosen because they do not share an L1 with any of the speaker groups (which a demographic question on the survey confirmed). The listeners were categorized into three groups based on proficiency level: 32 advanced (TOEIC scores of 805 or higher; above 81st percentile), 30 intermediate (TOEIC scores of between 605 and 800; 61–80th percentile), and 30 beginner (TOEIC scores of 600 or lower; below 60th percentile). Participants’ subscores were also collected, as the current version of TOEIC tests consisted of listening and reading sections only. Their listening test scores ranged from 405 to 495 (81st percentile or higher) for the advanced group, 305 to 400 (61–80th percentile) for the intermediate group, and 300 or lower (below 60th percentile) for the beginner group. Listeners were recruited by campus newsletters. Note that we use the designations beginner, intermediate, and advanced to easily differentiate between the levels. However, these score bands do not necessarily reflect these labels outside of the current study. As part of the demographic information page of the survey, listeners were asked to rate their familiarity with the target varieties of English on a 1–5 Likert-style sliding scale (1 = not familiar at all, 5 = completely familiar), but preliminary analyses showed that familiarity had no effect on listeners’ judgments of comprehensibility nor their ability to accurately transcribe speakers’ words (i.e., linear regression prediction, p > 0.1) with very little variability across the participants. This result is possibly due to the fact that the three listener groups are very homogeneous.
DATA COLLECTION
The recruitment of participants took place rigorously and strictly to ensure the quality of data collection. The study was introduced through the research team or their acquaintances who were university professors in South Korea at the point of the study administration. Participants were told that they must follow the research protocols provided in the guidelines that were translated into Korean. Their behaviors were observed by non-research-team professors who reported their observance of the steps and procedures after the completion of the study. Initially, 213 participants were recruited, but 92 of them remained through the rigor of the data-collection process, including the vocabulary screening test, and therefore were used for the final analysis. That is, the study underwent a 57% participant loss in the process of reassuring the qualification and usability of the dataset.
Once participants agreed to complete the study and their designated testing environment was approved (i.e., a quiet, private space with a laptop or desktop computer and accompanying headphones), they were sent a link with a list of vocabulary words extracted from the TOEFL passages. They were told that among the 85 words provided, 5 selected words appeared in the vocabulary test. They were asked to take an online, multiple-choice vocabulary test that assessed participants’ knowledge of the English words and their Korean translations. Only those who received a full score on the vocabulary screening measure were invited to the next phase of the survey. Listeners completed the survey in a quiet, approved environment using their computers and headphones.
Listeners were asked to perform two tasks: (a) complete a set of comprehension questions associated with 10 listening passages, and (b) provide verbatim transcriptions of a set of 30 sentences. The entire test (including both listening comprehension and intelligibility sections) actually took about 50 minutes to complete even though participants were told initially that it would take 1.5 hours. The first half of the survey consisted of 10 listening passages that were each 3–5 minutes in length. Normal TOEFL procedures were followed; that is, participants listened to each passage, took notes if they desired, and then answered the corresponding comprehension questions. The second half of the survey included 30 statements for transcription drawn from the original 90. Three sentences from each of the 10 speakers were presented in random order, each on a separate survey page. Participants listened to each sentence and transcribed it before advancing to the next page.
At the beginning of the test through the survey link and through the Korean-translated guidelines, participants were informed that they must listen to the listening passages and sentences only once. The test items were set up accordingly. Additionally, participants were told repeatedly by the research team or the recruiting professors that they should listen to each sentence one time only and type exactly what they heard in the text box provided. One point was awarded for each correctly transcribed word; incorrect spellings were not penalized, as long as the intention was clear. These scores were then converted to percentages by dividing the number of correct words by the total number of words in the sentence; they are forthwith called intelligibility scores. Once finished, participants received an honorarium.
DATA ANALYSIS
To ensure maximal interpretability of our results, we conducted several statistical analyses. First, we performed linear regressions to examine the degree to which the proficiency variable can predict the listening comprehension and intelligibility scores. For this regression analysis, participants’ actual TOEIC scores (M = 690.41, range = 325 – 990, SD = 187) were computed as a continuous variable. Next, we conducted ANOVAs for the following combinations of proficiency levels: high-comprehensibility speakers with high-, intermediate-, and low-proficiency listeners, and low-comprehensibility speakers with high-, intermediate-, and low-proficiency listeners. This was done for both the listening comprehension and intelligibility tasks. In each of these, the dependent variables were listeners’ listening comprehension and intelligibility scores, whereas the independent variable consisted of speakers’ L1 (Indian, South African, Mexican, and Chinese). As for the interpretation of effect sizes for ANOVA analysis, we consulted several references (e.g., Cohen, Reference Cohen1988; Miles & Shevlin, Reference Miles and Shevlin2001; Plonsky & Oswald, Reference Plonsky and Oswald2014), and used partial eta-squared (η2): that is, a small effect (η2 < .01), a medium effect (.01 < η2 < .06), and a large effect (η2 > .14). In addition, to control for Type 1 error rates with multiple comparisons performed in this study, we chose the post hoc analysis of Tukey HSD, which manages multiple comparisons in ANOVA that still keeps the experiment-wide error at or below set significance level (e.g., 0.05) with maintaining as much power as possible (Crocker & Algina, Reference Crocker and Algina1986).
RESULTS
LISTENING COMPREHENSION
Listeners’ TOEIC scores were used as a predictor and the listening comprehension scores as a dependent variable for linear regression analyses. Proficiency significantly predicted listeners’ comprehension (Beta = .57, t = 20.21, p = .000, R 2 =.32) when the model included the entire 10 speakers. A similar pattern emerged with listening passages recorded by six highly comprehensible speakers (Beta = .59, t = 16.58, p = .000, R 2 = .35). The pattern did not change radically when only four speakers with low comprehensibility were used in the model (Beta = .54, t = 11.75, p = .000, R 2 = .29) even though R 2 decreased to some extent. Overall, proficiency showed a strong association with listening comprehension.
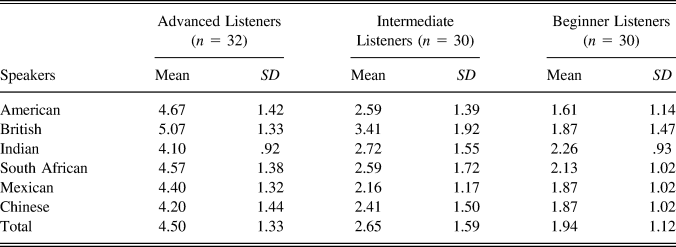
Separate ANOVAs were performed for the two levels of (predetermined) speaker comprehensibility across different speaker varieties as an independent variable. These three ANOVA models were computed independently because each group of listeners was independent and listened to six separate listening passages with different accents. There was no significant difference found when comparing highly comprehensible speakers with advanced listeners with a small effect size (F 5,174 = 2.12, p = .066, η2 = .057). Thus, as long as the speakers were highly comprehensible, the high-proficiency listeners were able to perform equally well on TOEFL listening passages and their subsequent comprehension questions. Likewise, beginner-level listeners also did not show a significant difference across speakers with a small effect size (F 5, 180 = 128, p = .275, η2 = .034). While advanced listeners had scored equally well across speakers, beginner listeners scored poorly for each of the speakers, regardless of English variety. Intermediate-level listeners, however, did show a significant difference across highly comprehensible speakers with a small effect size (F 5,186 = 2.12, p = .044, η2 = .059). Tukey HSD post hoc analyses confirmed that, specifically, intermediate listeners’ comprehension scores were significantly different between British and Mexican speakers (p = .019). They had the most difficulty (i.e., scored lowest) with the Mexican speaker, and scored highest with the British speaker. No other comparisons between speakers were statistically different. Descriptive statistics for each of the listener levels can be seen in Table 1.
Descriptive statistics of listening comprehension scores for high-comprehensibility speakers

Note: American (n = 1), British (n = 1), Indian (n = 2), South African (n = 2), Mexican (n = 2), Chinese (n = 2).
Next, a significant difference was found when advanced level listeners answered comprehension questions for passages spoken by low-intelligibility speakers with a medium effect size (F 3,116 = 4.258, p = .007, η2 = .099). In other words, unlike with the highly comprehensible speakers, advanced listeners exhibited sensitivity toward English varieties when responding to less comprehensible speech. Specifically, they performed best when hearing Chinese and Indian accented speech, but performed worse when the passage was spoken by a Mexican speaker. Post hoc analyses confirmed that there were significant differences in listening comprehension scores for the Indian, Mexican, and Chinese speakers (p < .015): difference between Indian and Mexican (p < .015) and that between Chinese and Mexican (p < .011). (Note that American and British speakers were excluded from analysis because there were no low-intelligibility speakers from those L1s.)
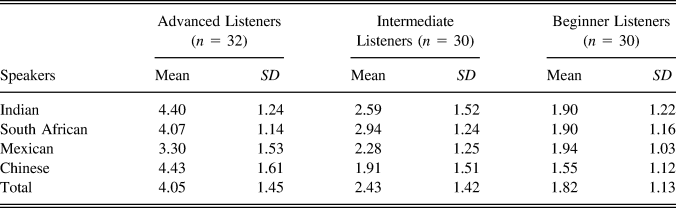
Likewise, intermediate listeners also exhibited significant differences in their comprehension scores on tasks featuring low-intelligibility speakers with a small-to-medium effect size (F 3,124 = 3.217, p = .025, η2 = .072), indicating that they were also sensitive to the variation in speech that L1 influence introduces. Interestingly, intermediate listeners scored best when listening to a South African–read passage, and scored worst when the passage was spoken by a Chinese speaker (see Table 2). A post hoc analysis confirmed a significant difference between the South African– and Chinese-read passages (p = .018). No other comparisons were statistically different. Thus, rankings of comprehension scores by speech variety are not predictable across listener proficiency levels.
Descriptive statistics of listening comprehension scores for low-intelligibility speakers

Note: Indian (n = 2), South African (n = 2), Mexican (n = 2), Chinese (n = 2).
When beginner listeners encountered passages spoken by speakers with low intelligibility, there was no significant difference with a small effect size in comprehension scores (F 3,120 = .808, p = .492, η2 = .02). The scores were low for each of the speakers; no speaker gained more than an average of two questions right out of six possible.
INTELLIGIBILITY
The same methods of analysis mentioned in the preceding text were applied to intelligibility scores. Listeners’ proficiency scores were significantly associated with the intelligibility scores (Beta = .527, t = 18.041, p = .000, R 2 = .277) when the model included all 10 speakers. Regression models for both the high-comprehensibility and low-comprehensibility speakers revealed a similar pattern, that is, proficiency predicting speakers’ intelligibility significantly: (Beta = .526, t = 13.936, p = .000, R 2 = .277) and (Beta = .647, t = 15.591, p = .000, R 2 = .418), respectively.
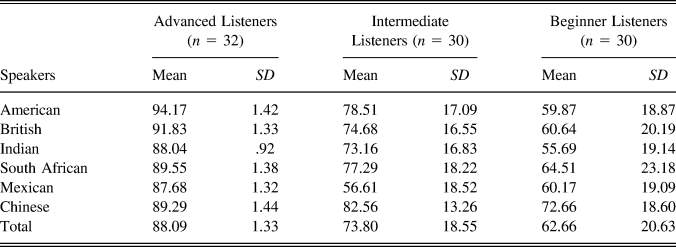
Three separate ANOVAs confirmed the effect of proficiency levels on listeners’ intelligibility scores. When examining highly comprehensible speakers with advanced listeners, there was no significant difference across speakers (F 5,174 = 1.144, p = .338, η2 = .031). In other words, the transcription scores of advanced listeners did not differ across speakers’ accents as long as the speech was highly comprehensible. However, intermediate-level listeners demonstrated a significant difference across highly comprehensible speakers with a large effect size (F 5,186 = 9.20, p = .000, η2 = .198) (see Table 3). According to Tukey HSD post hoc analyses, the significant difference emerged between Mexican speakers and the rest of the speakers (p < .001). Similarly, beginner-level listeners also showed a significant difference across highly comprehensible speakers with a small to mid- effect size (F 5, 180 = 3.179, p = .015, η2 = .078). These beginner listeners’ intelligibility scores were particularly different between Indian and Chinese accents (p = .019), but not the rest of the comparisons.
Descriptive statistics of intelligibility scores for high-comprehensibility speakers

Note: American (n = 1), British (n = 1), Indian (n = 2), South African (n = 2), Mexican (n = 2), Chinese (n = 2).
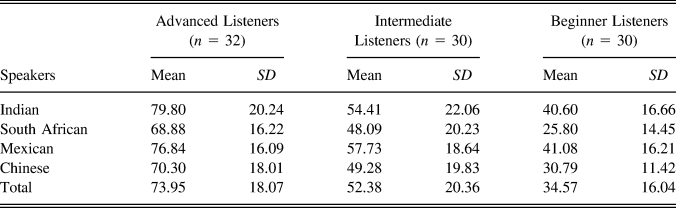
Lastly, intelligibility scores of different proficiency groups of listeners were tested with low intelligibility speakers. Table 4 shows descriptive statistics of intelligibility scores for four low-comprehensibility speakers. No significant difference was found when advanced- and intermediate-level listeners transcribed sentences prepared by the non-British and non-American speakers: (F 3,116 = 2.596, p = .056, η2 = .063) for advanced-level listeners and (F 3,116 = 1.158, p = .197, η2 = .037) for intermediate-level listeners. However, a significant difference with a medium-to-large effect size was found across speaker varieties when beginner listeners were asked to transcribe sentences recorded by low-intelligibility speakers (F3,120 = 7.984, p = .000, η2 = .166). Tukey HSD post hoc analyses indicated that listeners’ intelligibility scores were significantly lower with Chinese and South African accents in comparison to Indian and Mexican accents (.001 < p < .05). That is, the following comparisons especially showed statistical differences: between Indian and South African (p = .001), between Indian and Chinese (p = .05), between Mexican and South African (p = .001), and between Mexican and Chinese (p = .036).
Descriptive statistics of intelligibility scores for low-intelligibility speakers

Note: Indian (n = 2), South African (n = 2), Mexican (n = 2), Chinese (n = 2).
DISCUSSION
LISTENING COMPREHENSION SCORES
The current study examined the extent to which listeners’ proficiency levels could affect their listening comprehension and ratings of intelligibility of different varieties of English. The results of the regression analyses showed that about 28% to 42% of variance in listeners’ listening comprehension and intelligibility scores was attributed to their English proficiency. In addition, when nonnative English accented speakers were tested with low-proficiency learners, their comprehension was not equally high across speakers. This indicates that accent differentially affects listeners of varying proficiency levels.
For the high-comprehensibility speakers, advanced listeners did not score any lower for any of the nonnative English accented varieties than they did for the native English varieties (British and American). These results echoed those found in the previous study (Kang et al., Reference Kang, Thomson and Moran2019), despite the fact that this was a novel group of listeners who did not share an L1 with any of the speakers. In a similar vein, the beginner listeners also did not show a difference, as they performed uniformly low for all speakers. However, the intermediate-proficiency listeners’ scores were significantly different (p = .044) with a small effect size (η2 = .059). This finding runs in contrast with that of Abeywickrama (Reference Abeywickrama2013), who found that her low- and high-intermediate listeners scored equally well when listening to native and nonnative speakers.
For the low-comprehensibility speakers, there were significant differences in their comprehension scores between accented varieties for both the advanced- and intermediate-level listeners. In other words, both advanced- and intermediate-level learners are sensitive to accents when the speaker’s intelligibility is low. However, beginner-level listeners had low scores across the board. Most likely, the task was too difficult for beginner listeners to excel at, regardless of accents. Beginner-level test takers tend to express difficulty with other elements of the task demands (Harding, Reference Harding2011).
Overall, the findings imply that when nonnative speakers of English are employed as listeners, their proficiency levels can be a confounding variable that affects their comprehension of accented speech. In particular, intermediate level listeners may exert more sensitivity to the accent varieties than other proficiency level listeners, regardless of the degree of speaker’s intelligibility.
INTELLIGIBILITY SCORES
The intelligibility performances of advanced and intermediate level listeners were somewhat similar to that of listening comprehension. Thus, for the high-comprehensibility speakers, high-proficiency listeners scored equally well regardless of speaker/speaker’s accent. Note that the intelligibility measure was operationalized through a transcription method, which was considered by listeners to be an easier task than the listening comprehension test. However, the intermediate listeners’ sensitivity to accent caused their scores to be significantly different across speakers, particularly with a Mexican accent that showed a large effect size (p = .000, η2 = .198). Beginner-level listeners also showed a significant difference across speaker groups when they took the transcription task (p = .015, η2 = .078). This finding suggests that when intermediate- to low-level listeners perform on intelligibility tests, they will be sensitive to different varieties of accents. Another possible interpretation of these findings is that high-proficiency, competent listeners might use a different listening strategy (e.g., a top-down approach) to solve a perceptual problem in ways that low-proficiency listeners may not be able to manage (Flowerdew & Miller, Reference Flowerdew and Miller2005). Further research is needed in this area of listening strategies related to accented speech.
For low-comprehensibility speakers, both high- and intermediate-proficiency listeners did not necessarily display sensitivity to nonnative accent. Unlike the listener comprehension portion, beginner-level listeners’ intelligibility scores were significantly different across varieties on the transcription task, meaning that the task was easier when listeners were confronted with some varieties of English (i.e., Indian and Mexican) than it was when hearing other varieties (i.e., Chinese and South African). Overall, this study shows that, as long as speakers are highly intelligible, advanced-level proficiency listeners are not sensitive to type of accent. However, intermediate-level and beginner-level listeners showed some sensitivity.
CONCLUSION
Researchers have expressed concerns about random selection of speakers for listening inputs in high-stakes tests (Elder & Harding, Reference Elder and Harding2008; Ockey & French, Reference Ockey and French2016). Ockey, Papageorgiou, and French (Reference Ockey, Papageorgiou and French2016) found that even very light accents of speakers in listening texts can affect listeners’ comprehension of lectures and argued that careful attention to strength of accent is required when designing listening comprehension tests. However, previous research had shown promise regarding the issue of adding nonnative English varieties to the listening comprehension sections of high-stakes, large-scale English assessments such as the TOEFL or IELTs. For example, Kang et al. (Reference Kang, Thomson and Moran2019) noted how, as long as speakers were tightly controlled to have high intelligibility, listeners would not be adversely influenced by this variable. In other words, incorporating nonnative English varieties could increase ecological validity without adding a source of bias to the test.
Kang et al.’s (Reference Kang, Thomson and Moran2019) study demonstrated that listeners did not show any differences in their listening comprehension scores when they took simulated TOEFL listening tests prepared by highly intelligible speakers. But the authors also noted in their limitations that they had only tested speaker variation on highly proficient listeners who had received scores of 100 or better on the TOEFL. When replicating the experiment with different proficiency learners, as the current study did, the results differed somewhat. This time, although the advanced listeners scored as predicted, with no significant differences in comprehension scores for speaker’s L1 background, this was not the case with intermediate-level listeners. Intermediate listeners were influenced by the presence of English accent variability, scoring more accurately on listening comprehension passages read by a speaker of one accent variety than they did on another. A somewhat similar pattern was followed by listeners’ intelligibility test scores.
These findings shed light on our understanding of accent varieties in the era of globalization. We believe that the WE varieties should be constantly considered in the target language use domain. However, when employing the WE varieties, we need to consider the test takers’ backgrounds along with the degree of those accent varieties. That is, the demographic of TOEFL and IELTs test takers span from beginner to advanced learners with a profile of the “average” test taker reflecting an intermediate or high-intermediate proficiency. It is necessary to investigate how nonnative English accent varieties affect actual high-stakes test takers in listening tests. The current study has demonstrated that listeners of different proficiency levels are affected somewhat disproportionately. As Harding (Reference Harding2012) argues, the listening construct relating to “ability to deal with an accent” (p. 16) should be examined more thoroughly and introspectively so that more resources can be provided to help test takers better understand WE varieties in listening assessment.
Please note that the current finding is too preliminary to draw a prominent conclusion about whether accent varieties should be incorporated in listening assessment. Further research is required with different listening test items along with different intelligibility measures as they can be an additional source of variance. Measuring the intelligibility construct is notoriously difficult and the transcription method has its flaws (Zielinski, Reference Zielinski2008); Munro and Derwing (Reference Munro and Derwing2015) discuss several approaches measuring intelligibility with the disclaimer that none of them is ideal. In this study, we saw the higher degree of shared variance between listener proficiency and speaker intelligibility for the low-comprehensibility speakers, especially when the transcription method was used as a way of measuring intelligibility. This finding suggests that listeners’ background be considered as an important factor when determining someone’s intelligibility. Future research can examine how the intelligibility construct can be better operationalized by nonnative speakers of English. In addition, even though the current study controlled listeners’ familiarity with accents by choosing the listener group not sharing L1s with speakers, the items or topic familiarity have not been tested and verified. Finally, the current study solely focused on the effect of phonological variance on listening comprehension. Other factors such as lexical knowledge can be further investigated. Despite these limitations, the current results have implications for teaching and learning English beyond the context of listening assessment because they help understand the nature of intelligible speech in global communication.