Whey is the main by-product of the cheese industry and it contains 50% of the total solids of milk. The main industrial uses of whey include whey powder and whey protein concentrates (WPC) that are ingredients of a large number of food products. In some countries, cheese whey is used to produce a cheese-like product named differently depending on the country (Pintado et al. Reference Pintado, Macedo and Malcata2001). Ricotta (Italy), Mysost (Norway) and Reiqueijäo (Portugal) are the most well-known products in Europe. In Spain ‘Requesón’ is a cheese-like whey product that is usually produced using fortified sweet or acid whey with milk in different proportions. Cheese whey is generally produced by heating the whey–milk mixture at temperatures between 80 and 100 °C, with or without acidification (Pizzillo et al. Reference Pizzillo, Claps, Cifuni, Fedele and Rubino2005; Di Pierro et al. Reference Di Pierro, Sorrentino, Mariniello, Giosafatto and Porta2011). At 85 °C, serum proteins start to coagulate, owing to unfolding and aggregation, and, at the end of the process, small curd flakes can be recovered on the surface. When cheese whey is obtained without milk, the overall efficiency of the process is very low (between 5 and 6%) and the energy consumption is very high, owing to the low dry matter content of whey (between 6 and 7%) (Kosikowski & Mistry, Reference Kosikowski and Mistry1997; Nudda et al. Reference Nudda, Battacone, Bencini, Pulina, Pulina and Bencini2004), although yields can be increased to 12% by using whey fortified with milk (Weatherup, Reference Weatherup1986). Additionally, the recovery of proteins in the final products is around 30–40%, but it can be increased to 78% with the addition of calcium salts (Mathur & Shahani, Reference Mathur and Shahani1981). The presence of salts, mainly divalent cations, has the effect of promoting aggregation by shielding the negative charges of serum proteins that facilitate aggregation (Salvatore et al. Reference Salvatore, Pes, Falchi, Pagnozzi, Furesi, Fiori, Roggio, Addis and Pirisi2014). Acidification with lactic or citric acid (pH between 5 and 6) leads to an increased yield, as reported by some authors (Mahran et al. Reference Mahran, Hammad, Ahmed, Sayed and Abdel-Aziz1998).
Pre-concentration of cheese whey prior to, or during, heat treatment has also been studied by some authors. Some used condensed whey to produce Ricotta cheese (Streiff et al. Reference Streiff, Nilson, Duthie and Atherton1979). Salvatore et al. (Reference Salvatore, Pes, Falchi, Pagnozzi, Furesi, Fiori, Roggio, Addis and Pirisi2014) ultra-filtered ovine whey six times without acidification, obtaining Ricotta-type cheese with higher moisture and lower fat contents compared with products obtained without concentration. Prudêncio et al. (Reference Prudêncio, Müller, Fritzen-Freire, Amboni and Petrus2014) concentrated sweet whey by nanofiltration (VCR 2) and nanofiltration followed by diafiltration, and they concluded that Ricotta obtained was more elastic, firmer and more compact; however, they did not give extensive information about the cheese yields or saline composition of the concentrates or second cheese whey (SCW).
It has been established that process parameters, such as protein and salt concentrations, heating temperature, pH, and so forth, are important factors affecting the cheese-whey yield, owing to their influence on the aggregation of the main serum proteins β-Lg and α-La (Mangino, Reference Mangino1984).
In the present work, nanofiltration and reverse osmosis have been used to concentrate sweet whey prior to its coagulation using a classic Ricotta cheese procedure. The influence of different concentration ratios were compared with respect to the cheese-whey yield, protein (salt) recovery and final ‘Requesón’ composition, using lactic acid as the acidulant. The composition of SCW obtained from the process was also analysed.
Materials and methods
Whey source
Sweet bovine whey was supplied by a small local cheese company (Los Caserinos, Asturias, Spain). Casein particles were removed by a filter cloth and fat was removed using a continuous centrifuge. The whey was processed immediately to produce traditional ‘Requesón’, with or without pre-concentration with membranes.
Lactic acid 50% (wt/wt) (Purac, Spain) was used as the acidulant during whey and concentrated-whey heating. Tungstic acid, Chloramine T, potassium iodide and sodium thiosulfate (used for lactose analysis) were obtained from Panreac (Spain). The chemicals used for the analysis were of analytical grade.
Membranes and concentration rig
Whey concentration was performed in a nanofiltration/reverse osmosis (NF/OI) pilot plant, which has been described in previous papers (Suárez et al. Reference Suárez, Lobo, Álvarez, Riera and Álvarez2006, Reference Suárez, Lobo, Álvarez, Riera and Álvarez2009). The unit is automated and is equipped with pressure and temperature controls. The rig is designed to work with different spiral-wound modules.
The main characteristics of the NF and OI membranes selected for the concentration step are shown in Table 1. The membranes were selected to obtain different lactose and ash retentions.
Main characteristics of the membranes (information supplied by manufacturers)

Analytical techniques
Fresh whey, NF and reverse osmosis (RO) concentrates, final whey cheeses as well as SCW were analysed in terms of dry matter (DM), protein, fat, ashes and lactose contents. The DM was determined by weighing samples after drying in an oven at 102 °C until a constant weight (±2% error) was achieved. Proteins were quantified using Spanish standard UNE 34-823-83 (Cuartas-Uribe et al. Reference Cuartas-Uribe, Alcaina-Miranda, Soriano-Costa, Mendoza-Roca, Iborra-Clar and Lora-García2009) (±3% error). The ash content was determined by incineration in an oven at 523 °C (±2·5% error). Fats were measured by the standard Gerber method (UNE 34-898-86) (Cuartas-Uribe et al. Reference Cuartas-Uribe, Alcaina-Miranda, Soriano-Costa, Mendoza-Roca, Iborra-Clar and Lora-García2009) (±3% error). The cations Na+ (±1·5% error), Mg2+ (±1·8% error) and Ca2+ (2·1% error) were measured by atomic absorption (Perkin Elmer, model 2100, EEUU) (Suárez et al. Reference Suárez, Lobo, Álvarez, Riera and Álvarez2006). Lactose was measured using the Chloramine T (sodium salt of N-chloro-p-toluenesulfamide) method (FIL-IDF, 1974). Chloride was measuring using a selective electrode (Ionlab, Merck, EEUU) (± 4% error). Phosphates were measured according to the colorimetric method of AOAC (1996) (±3·5% error). Sulphates and chemical oxygen demand (COD) in the concentrates and permeates as well SWC were determined with Spectroquant NOVA 60 and commercial kits. The density of the whey and concentrated whey were measured by means of a portable densitometer Anton Paar mod. DMA35 (Graz, Austria).
Samples were analysed in duplicate and the values shown in the tables and figures are the average of the two measurements. All the data included in the tables and figures show a significance P < 0·05.
Experimental procedure
Whey concentration
Previously, fat and caseins were removed from the whey and it was then concentrated by NF and RO in batches using the same protocol for both operations. Concentration steps were performed at 35 ± 0·5 °C and 20 ± 0·4 bar in the case of NF and at 38 ± 0·5 °C and 35 ± 0·4 bar for RO. The feed flow was 4·0 m3/h in both cases.
Each batch was made with 100 l of pre-filtered and defatted whey, and the concentration step was performed in concentration mode until volume concentration ratios (VCR) of 2, 2·5 and 2·8 were reached for NF and 2 and 3 for RO. A sample of each concentrate was taken for analysis (in duplicate), and the final concentrates were treated immediately to convert them into ‘Requesón’. During the concentration steps, the initial and final permeate flow rate were measured. The membrane rejection to each component (ions and the rest of compounds analysed) was estimated using the equation:
 $$R_i = 1 - \displaystyle{{C_{{\rm pi}}} \over {C_{{\rm ri}}}} $$
where R i is the membrane rejection to the “i” component, whereas C pi and C ri are the concentrations of component “i” in the permeate and the concentrate, respectively.
Membranes were cleaned after each experiment, following the same protocol that was previously published by the authors (Suárez et al. Reference Suárez, Lobo, Álvarez, Riera and Álvarez2006). The cleaning steps were duplicated if the recovery of the original permeate flow rate was lower than 90%.
After the concentration step, the ‘Requesón’ was obtained in the traditional way without any milk addition. Each batch of whey and concentrated whey was heated in a tank (between 33 and 100 l) at temperatures between 85 and 90 °C for 1 h, with smooth stirring and adding lactic acid (50% wt/wt) to obtain a final pH between 4·6 and 4·8. During heating, the curd ascended spontaneously to the surface of the tank and was carefully collected and poured into perforated plastic moulds, each with a capacity of 250 × 10−3 l. ‘Requesón’ was allowed to drain, without pressure, over a period of 5 h. The final sample was weighted and analysed.
Whey obtained from SCW was analysed following the same techniques as the fresh whey and concentrates.
‘Requesón’, protein, salts and lactose yields were determined using the following expression:
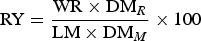 $${\rm RY} = \displaystyle{{{\rm WR} \times {\rm DM}_R} \over {{\rm LM} \times {\rm DM}_M}} \times 100$$
where RY is the ‘Requesón’ yield expressed in %; WR and LM are the mass of ‘Requesón’ obtained after 5 h of draining and the volume of milk or concentrated whey used, respectively, whereas DMR or DMM are the masses of dry matter of ‘Requesón’ and milk or concentrated whey, respectively. Note that the whey-cheese yield is estimated here by taking into account the dry matter and not the final mass of the ‘Requesón’ obtained, owing to the fact that, for these types of products with high moisture contents and weak structures, the weight of the final product is very dependent on the type (pressed or not) and draining time. Thus, the data that are shown in previously published reports exhibit discrepancies.
Yields of the main whey components (protein, lactose, fat and ashes) were estimated according to the following equation:
 $$iY = \displaystyle{{({\rm LM} - {\rm WR}) \times {\rm DM}_R \times X_{{\rm Ri}}} \over {{\rm LM} \times {\rm DM}_M \times X_{{\rm Mi}}}} $$
where iY is the yield of each component analysed (“i” is: protein, fat, ash or lactose), whereas X Ri and X Mi are the percentages of the “i” component in ‘Requesón’ and in milk or concentrated whey, respectively. The densities of the whey, concentrate and permeate whey were previously measured to express final yields in terms of weight.
Results and discussion
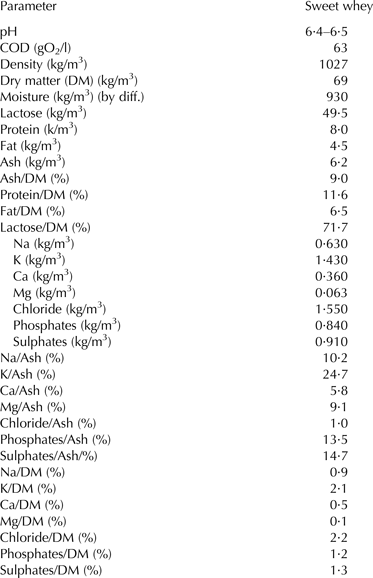
The average compositions of whey to be concentrated by nanofiltration (NF) and reverse osmosis (RO) are shown in Table 2.
Average composition of sweet whey
In this work, the cheese was obtained in the traditional way with calcium chloride addition, which justifies the values of these two ions in the whey. The pH value of the sweet whey varied between 6·2 and 6·4, and the amount of the other compounds analysed corresponded to traditional sweet whey.
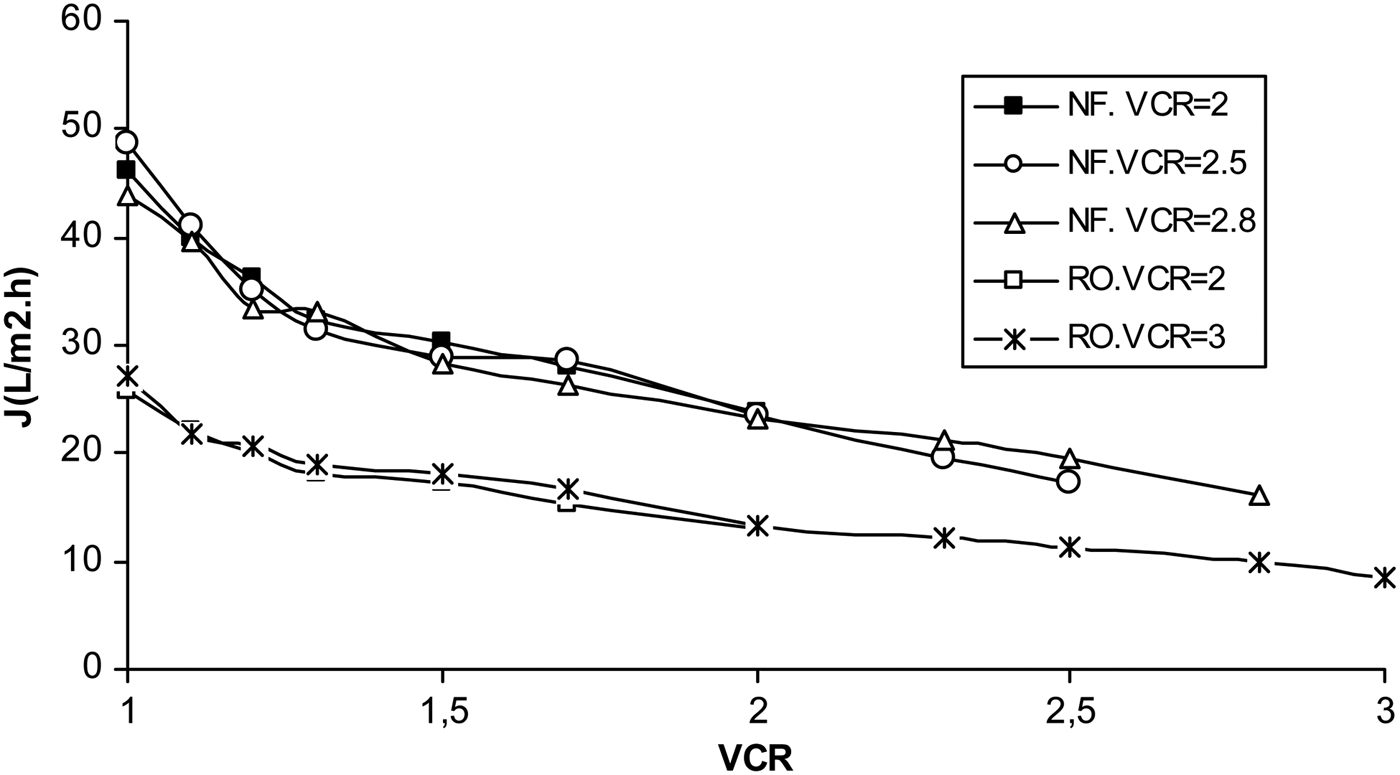
Figure 1 shows the permeate flow rates for the concentration step. The figure shows how the permeate flow rate decreases with the VCR for all experiments. The permeability for the NF process is higher than the values obtained for RO. In both techniques, the reduction in permeability is more acute at the beginning of the filtration, owing to the well-known polarisation concentration phenomena. With respect to the flux decline with VCR, values are slightly higher in case of OI (as an example, the percentage in flux decline is 44 and 54% for NF and OI respectively at VCR of two, and of 62 and 68% at VCR of 2·8.
Permeate flow rate (l/m2h) during the concentration with NF and RO vs. VCR. Feed flow: 4·0 m3/h. NF experiments: 35 ± 0·5 °C; 20 ± 0·4 bar. RO experiments: 38 ± 0·5 °C; 35 ± 0·4 bar.
A comparison of these results with other previously published results is not easy, owing to the different whey origins, way of performing the experiments and different membrane characteristics. Prudêncio et al. (Reference Prudêncio, Müller, Fritzen-Freire, Amboni and Petrus2014) showed lower values of permeability (22 l/m2h at t = 0 and 2 l/m2h at t = 1·8 h) using a NF membrane with 98% rejection to MgSO4, a 150 Da cut-off and a temperature of 24 ± 1 °C; meanwhile, the experiments performed in this work were made with a NF membrane with a 200 Da cut-off and a temperature of 35 ± 0·5 °C. The values of permeate flow rate were also higher than those published by Cuartas-Uribe et al. (Reference Cuartas-Uribe, Alcaina-Miranda, Soriano-Costa, Mendoza-Roca, Iborra-Clar and Lora-García2009) who used similar NF membranes (GE-OSMONICS DS-5 DL, 150–300 Da), but these authors carried out the NF experiments at lower temperatures (16–18 °C). The values were, however, similar to those published by Suárez et al. (Reference Suárez, Lobo, Álvarez, Riera and Álvarez2006) with similar membranes and temperatures.
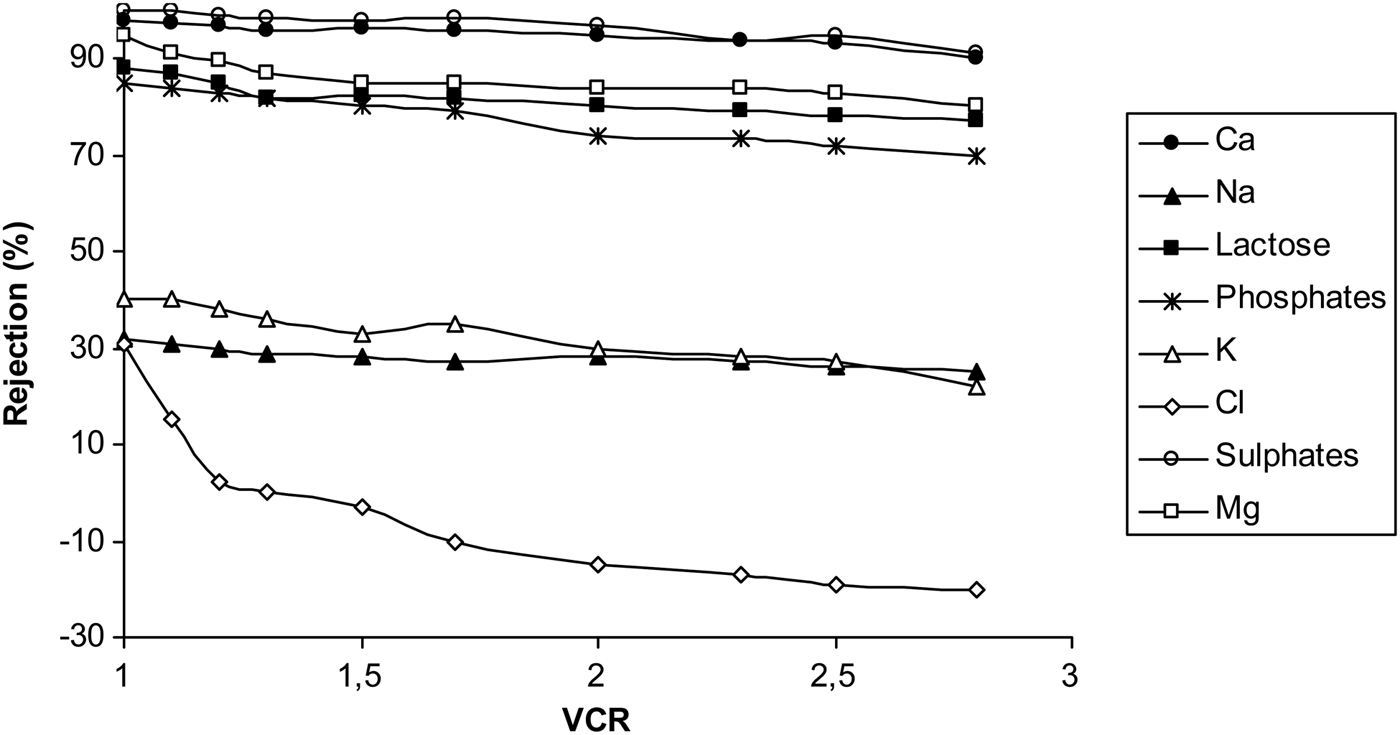
As shown in Fig. 2, the rejection to different salts was plotted vs. the VCR for the nanofiltration step. As can be seen, the rejection of components by the membrane can be divided into three groups. Sulphates and calcium were strongly rejected by the membrane at all VCRs studied (between 100 and 94% for sulphates and 98 and 94% for calcium), whereas magnesium, lactose and phosphates were retained between 95 and 73%, but monovalent ions (K and Na) were less well retained (between 40 and 30%). Finally, chloride rejection showed completely different behaviour, which can be explained with the Donnan effect. In all cases, the membrane rejection decreased with VCR, owing to the effect of the concentration polarisation phenomena on the membrane surface (Cuartas-Uribe et al. Reference Cuartas-Uribe, Alcaina-Miranda, Soriano-Costa, Mendoza-Roca, Iborra-Clar and Lora-García2009). The higher rejection found for divalent ions is one of the characteristics of NF membranes that have been explained in numerous text books and research articles (Schaep et al. Reference Schaep, Van der Bruggen, Vandecasteele and Wilms1998; Mulder, Reference Mulder2000). The negative rejection of the chloride anion is a common behaviour found in the NF of whey or whey-like fluids, where small cations can pass through the membrane and chloride must permeate in order to maintain solution electroneutrality (Gilron et al. Reference Gilron, Gara and Kedem2001; Suárez et al. Reference Suárez, Lobo, Álvarez, Riera and Álvarez2006; Cuartas-Uribe et al. Reference Cuartas-Uribe, Alcaina-Miranda, Soriano-Costa, Mendoza-Roca, Iborra-Clar and Lora-García2009). The rejection of salts and other whey components was almost 100% in the case of RO, which is justified by the higher membrane rejection (99·5% to ClNa).
Salts rejection vs. VCR during NF. Feed flow: 4·0 m3/h. NF experiments: 35 ± 0·5 °C; 20 ± 0·4 bar.
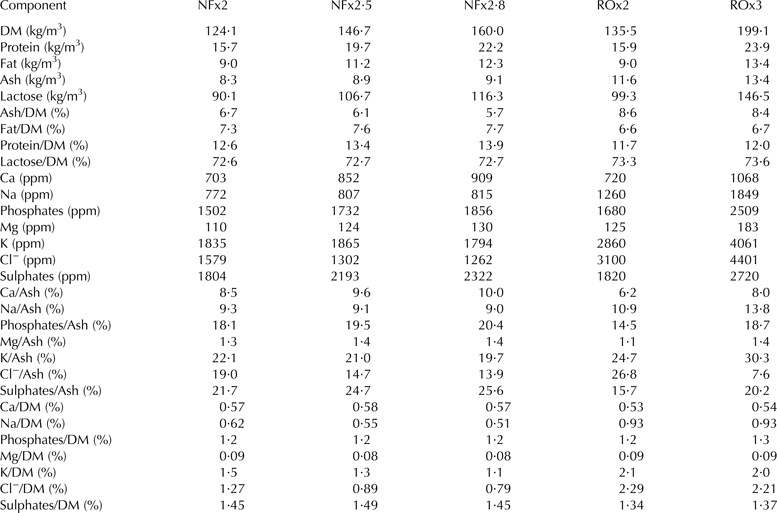
Table 3 shows the composition of concentrates after the NF and RO processes. The concentration of the different compounds in the concentrate streams roughly follows the expression:
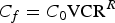 $$C_f = C_0 {\rm VCR}^R $$
in which C f and C 0 are the final and initial concentrations of each compound at each VCR, respectively, and R is the rejection of each component. To use the above equation, it is assumed that R is constant during the concentration step, but, as can be seen in Fig. 2, this rejection decreases during the NF step, which justifies some discrepancies between the values obtained in Table 3 and those predicted by the above equation. During NF concentration, proteins, fat and some salts (i.e. calcium and sulphates) multiplied their concentration in the concentrate stream by the VCR value, and then their ratios remained constant with respect to those existing in the raw whey. In the case of components with R values lower than 1, such as lactose and monovalent ions, the concentration is reduced with the VCR, which allows us to obtained concentrates with different compositions and to obtain ‘Requesón’ after heat treatment and acidification. Meanwhile, ratios of fat/DM, protein/DM and lactose/DM remained almost constant for the concentrates, but the ash/DM ratio was lower in the case of NF concentrates with respect to fresh whey. In the case of chloride ions, the amount (in g/l) was reduced as NF proceeds, owing to the negative rejection of the NF membrane with respect to this ion.
Composition of concentrates obtained with NF and RO at different VCRs
Despite the differences in ratios not seeming to be very remarkable in Table 3, the differences are much more apparent when the net amounts are calculated in the concentrates. Thus, taking Ca2+ as the reference, the increase in the amount of this ion in concentrates after NF × 2, NF × 2·5 and NF × 2·8 was 41, 70 and 82% respectively, and 43·6 and 115% in the cases of RO × 2 and RO × 3, respectively. Similar results can be observed for the other ions that were highly retained by the membranes.
In case of Cl−, the ions were less retained by the NF membrane, and the net amount in the concentrates varied between –28 to –40% with respect the amount present in fresh whey.
Regarding the concentrates obtained by RO, the ratios of all components remained practically the same as in the original whey, as rejections for this technique are close to 100%. The effect of RO is equivalent to an evaporation step.
The average rejection,  $\bar R$, for all whey components was 90% for NF × 2, 85% for NF × 2·5, 82·8% for NF × 2·8, 98·2% for RO × 2 and 96·2% for RO × 3.
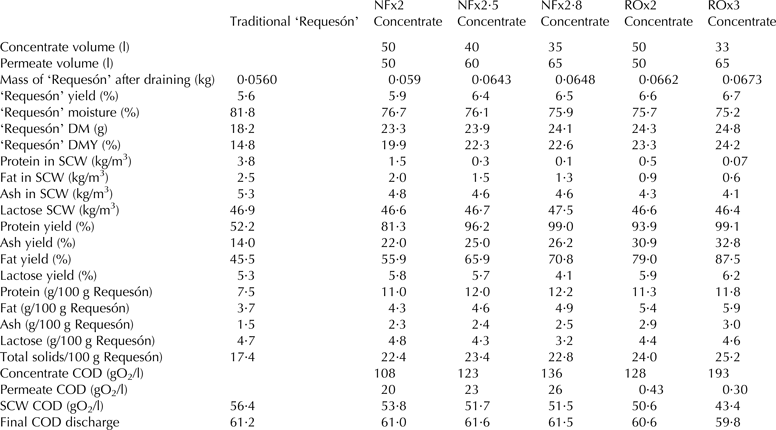
Table 4 shows the main results of the production of ‘Requesón’ in the traditional way (‘Requesón’ column) compared to the results obtained from the different NF and RO concentrates.
‘Requesón’ yields obtained from whey and NF and RO concentrates
Temperature 85–90 °C, 1 h heating, final ‘Requesón’ pH between 4·6–4·8. Basis: 1 l of initial whey
SCW, Second Cheese Whey
The traditional ‘Requesón’ yield was 5·6%, which is similar to the values published by some authors (Nudda et al. Reference Nudda, Battacone, Bencini, Pulina, Pulina and Bencini2004; Salvatore et al. Reference Salvatore, Pes, Falchi, Pagnozzi, Furesi, Fiori, Roggio, Addis and Pirisi2014) for cases in which the cheese whey was obtained without any addition of milk. This low percentage is attributed to the low efficiency of the process in terms of retaining proteins and to the losses of fat and ashes. The whey-cheese yields are higher when milk is mixed with whey in different proportions, owing to the higher concentration of caseins (Carvalho et al. Reference Carvalho, Prazeres and Rivas2013), but the salt concentration seems to have an important role in increasing yields, according to other authors (Mathur & Shahani, Reference Mathur and Shahani1981). However, the yield obtained when membrane pre-concentration was performed was higher. The increases in ‘Requesón’ yields were 5·3 and 19·6% for NF × 2 and RO × 3, respectively. Although whey-cheese yields are difficult to compare with other published data, owing to the different ways of manufacture (temperatures, pH, way of draining), the values obtained in this work were higher than those obtained by Salvatore et al., who used ultrafiltration (UF) as a technique to pre-concentrate whey in order to produce Ricotta cheese from ovine whey. The higher rejection of salts in the cases of NF and RO vs. the lower rejection with UF membranes explains the increase in protein aggregation and, thus, in yield (Mathur & Shahani, 1981).
With regard to the protein yield (percentage of initial protein that was incorporated to the whey cheese) in the final product, the value obtained in the case of traditional ‘Requesón’ was 52·2%. It is difficult to compare this value with others previously published values, owing to the large number of different whey cheeses produced. Pintado et al. (Reference Pintado, Macedo and Malcata2001) referenced percentages between 32·7 and 53·7%, depending on the whey origin, percentage of milk added and conditions of the thermal treatment. Salvatore et al. (Reference Salvatore, Pes, Falchi, Pagnozzi, Furesi, Fiori, Roggio, Addis and Pirisi2014) studied the production of ovine Ricotta-type cheese without acidification and with different additions of milk, and published protein yields between 26·9 and 81·5% when using UF retentates. In the case of ‘Requesón’ obtained from NF and RO concentrates, the protein recovery in the cheese increased significantly (81·3, 96·2, 99·0, 93·9 and 99·1% for NF × 2, NF × 2·5, NF × 2·8, RO × 2 and RO × 3, respectively). For this, the protein concentration analysed in the SWC reduced to 0·1 and 0·07 g/l in the case of NF × 2·8 and RO × 3, respectively, which are 90% less than the values reported by other authors (Nudda et al. Reference Nudda, Battacone, Bencini, Pulina, Pulina and Bencini2004). The high protein recovery obtained in this work is similar to that published in continuous Ricotta processes (Modler & Emmons, Reference Modler and Emmons2001).
On the other hand, it can be seen in Table 4 that the ‘Requesón’ DM content also increased with VCR (from 18·2 g for traditional ‘Requesón’ to 24·1 g for NF × 2·8 and 24·8 g for RO × 3), which implied that the whey-cheese moisture level reduced when it was produced from NF and RO concentrates. This increase in final DM was attributed to the protein retention, as explained before, but also to the increase in ash recovery (from 14% in the case of traditional ‘Requesón’ to 26·2% for NF × 2·8 and 32·8% for RO × 3) and fat recovery (from 45·5% in the case of traditional ‘Requesón’ to 70·8% in the case of NF × 2·8 and 87·5% for RO × 3). High fat recoveries have also been obtained in other whey-cheese productions that use membrane technology as a pre-concentration method; however, information of ash retention has not been found in previously published reports.
The lactose yield showed similar values for all tests performed (between 5·8 % for NF × 2 and 6·2% for RO × 3), and the values were near to those observed for the ‘Requesón’ obtained in the traditional way. Lactose is a soluble compound that is partially retained in the cheese gel structure, but the different initial composition of pre-concentrated whey did not affect their rejection in final ‘Requesón’. No information has been found about lactose retention in whey cheeses.
Ash yield in the final whey cheese increased notably with respect to the classic ‘Requesón’ process (increases of 57·1%, 78·6%, 87·1%, for NFx2, NFx2·5 and NFx2·8 respectively and 114 and 134% for ROx2 and ROx3 respectively).
This higher proportion of ash in the final whey cheese is probably one of the main reasons for the increase in yield and retention of proteins. In particular, Ca+2 and Mg+2 are cations that are highly retained by NF and RO membranes and, for this, their amount in the final concentrate increases with the VCR. As some authors suggest, the presence of divalent cations enhances protein aggregation and, subsequently, the ‘Requesón’ yield increases (Pintado et al. Reference Pintado, Macedo and Malcata2001; Salvatore et al. Reference Salvatore, Pes, Falchi, Pagnozzi, Furesi, Fiori, Roggio, Addis and Pirisi2014).
The final ‘Requesón’ composition is shown in Table 4, expressed as g/100 g product. The traditional ‘Requesón’ protein content was similar to the values published by other authors (6·1–8·7 kg/100 kg of proteins) who obtained cheese whey using whey–milk mixtures; however, the percentage of fat in the final traditional product obtained in this work was much lower (11·0–20·5 kg/100 kg in the bibliography and 3·7/100 kg in this work), owing to the low fat concentration in the fresh whey and the fact that there was no addition of milk (Pintado et al. Reference Pintado, Macedo and Malcata2001; Salvatore et al. Reference Salvatore, Pes, Falchi, Pagnozzi, Furesi, Fiori, Roggio, Addis and Pirisi2014). The percentage of fat in final product increased slightly when the ‘Requesón’ was produced from membrane concentrates (4·3 and 5·9% for NF × 2 and RO × 3, respectively). In this sense, the obtained product can be considered a low-fat whey cheese. On the other hand, whey cheese from pre-concentrated whey showed higher percentages of proteins in the final product (increments of 46·7, 60 and 62·6% for NF × 2, NF × 2·5 and NF × 2·8, respectively and of 50·7 and 57·3% for RO × 2 and RO × 3, respectively), meaning that a higher protein concentration in the pre-concentrated whey leads to increased protein retention. With regard to the ash fraction, the percentage of components in the final product increased (11·9–23·4%) with respect to the traditional process (10·6%).
All of these differences found between the ‘Requesón’ produced with pre-concentrated whey vs. the traditional method lead to products that are more compact, harder and friable, i.e. properties that were detected by non-expert sensory judges. Official panels might be organised in the next stages of the research to evaluate the main organoleptic properties of the obtained products.
COD values of the final concentrates and permeates, after membrane treatments as well as those from the SCW, and final COD discharge (estimated by mass balance) were included in Table 4. It can be seen that COD of NF concentrates increased with VCR, owing to the partial retention of lactose (the most important compound contributing to COD) and almost total protein and fat rejection. The COD of RO concentrates were significantly higher, owing to the 100% rejection of lactose. With regard to the permeates, the COD values for NF represent around 18% of those in the NF concentrates, whereas the permeates from RO showed very low COD values (0·43 and 0·30 for RO × 2 and RO × 3, respectively; COD removal of 99·7%). The possibility of reusing these streams somewhere in the plant can then be considered.
The COD of SCW in the traditional ‘Requesón’ process was similar to that of the fresh whey, but slightly higher compared to the values for the other SCW. The higher values were attributed to the lower lactose retention in the whey cheese. The high solubility of this compound and the low retention in whey cheese justifies these values, as has been mentioned before. There were small differences in this parameter [Lactose Yield (%) line in Table 4], irrespective of how the ‘Requesón’ was produced. On the contrary, the retention of fat and proteins in the whey cheese obtained with the pre-concentration step were higher, and this justifies the slightly higher COD in SCW of traditional ‘Requesón’.
SCW and permeates obtained from the membrane treatments represent the liquid discharges that generate the whey cheese obtained with membrane pre-concentration. With respect to the final COD, there were no significant reductions when a pre-concentration process was used. The low lactose retention in whey cheese makes a significant COD reduction in the final discharge impossible. However, in the case of pre-treatment with RO, an additional interest in the process, from the point of view of COD discharge, is that more polluted streams (SCW) are segregated from others with a low charge (RO permeates), which would permit more efficient wastewater management.
Conclusions
The manufacture of whey cheese by pre-concentration of bovine sweet whey using nanofiltration and reverse osmosis produces higher yields, owing to an increase in protein, fat and ash recovery. The increases in yields vary between 5 and 20%, depending on the technique used (NF or RO) and the VCR obtained. The increase in divalent cations, such as Ca2+ and Mg2+, in the final concentrates enhance the serum protein aggregation, thus increasing yields. The proposed process reduces the protein and fat losses in the second cheese whey, but no significant reduction in final discharge COD was found, owing to the low rejection of lactose (between 4·1 and 6·2%) and to the high amount of it present in effluents. However, the use of RO as a pre-concentration technique can facilitate wastewater management, owing to the possibility of segregating highly polluted streams (SCW) from other (permeates) with low charge.
This work was supported by the company COASA (Asturias, Spain). The whey was supplied by the company Los Caserinos (Asturias, Spain).