During the 1990s, quantitative security studies became an increasingly prominent and sophisticated area of inquiry within our discipline. Just in American Political Science Review, more than 20 articles over the past five years have applied some form of econometric technique to the study of international conflict. In particular, estimators based on the general linear model have been central to the development of extensive literatures on deterrence, the impact of democracy and trade on international conflict, and many other issues. In the March 2000 issue of this Review (Vol. 94, No. l, 21–36) Beck, King, and Zeng (hereafter, BKZ) offered a sweeping critique of these research programs and a bold new direction for future research. They contend that standard parametric procedures are not up to the task of estimating the causes of international conflict because these relationships are “highly non-linear, massively interactive, and heavily context dependent or contingent” (22).1
This represents an assumption about the data-generating process that may or may not be correct.
Consequently, improvements in theory and data are for naught, without a substitute for the inadequate, inflexible models based on the general linear model. As an alternative, BKZ introduce a statistical estimator, commonly called a “neural network,” that can approximate complex relationships without prior assumptions.
The evidence for BKZ's claim is the alleged ability of neural networks to improve forecasts of the onset of militarized disputes. We are, however, less sanguine about the forecasting performance of neural networks compared to more traditional logit models. If the goal is to reject an entire research paradigm, it seems appropriate to use the best model that paradigm has to offer. But we contend that BKZ omitted several variables and transformations of variables that the existing literature has suggested influence the onset of conflict. These omissions badly hamstrung the logit model, which is reliant on theory to specify a model's functional form. Until the performance of a neural network is compared to a logit model that fully embodies “state of the art” theory, we would resist rejecting the parametric approach.
Moreover, we contend that the forecasting performance of neural networks is not as good as it may initially appear. Based on calculations using BKZ's Table 1 and their standards for assessing whether a model predicts a conflict, their neural network correctly forecasted 14 (of a possible 84) disputes in the out-of-sample data compared to zero correct predictions by a logit model. Unfortunately, this success comes at the expense of 14 (of 2,398) nonconflicts predicted incorrectly as wars by the neural network but that were predicted correctly by their logit model. Thus, BKZ's logit model yielded the same number of correct predictions as their neural network. If one argues that we are only interested in successfully predicting war, a model “superior” to either of the above would be to predict war everywhere, all the time. This sort of confusion demonstrates that we need better standards for comparing statistical models. Consequently, in addition to evaluating the promise of nonparametric approaches such as neural networks, our broader goal is to provide a coherent set of standards that will allow researchers to compare different models of conflict. Underlying this research are three principles that we believe should guide such comparisons.
(1) Models should be parsimonious (King, Keohane, and Verba, 1994). Researchers should avoid the inclusion of irrelevant variables unmotivated by theory. All else equal, more complicated models are inferior to simpler models, largely because the inclusion of additional terms or complex functional relationships increases the combinatorics of the parameter space. This wider parameter space makes models harder to interpret and decreases the reliability of one's results. In particular, a wide parameter space raises the threat of overfitting a model to the idiosynchrasies of a particular set of data. Thus when a statistical model supports a theory that has been generated without regard to the data, we have a higher degree of confidence in this relationship than when we “discover” empirical, and possibly random, relationships that were not hypothesized a priori.
(2) For a statistical procedure to be useful in theory testing, it must offer interpretable and testable hypotheses. Without such tests, researchers cannot determine whether the magnitude and direction of the effects of predictors comport with theory. As noted above, parsimony greatly aids in this endeavor, and it is, for example, relatively easy to understand the meaning of logit coefficients. Neural networks, with their reliance upon vast parameter spaces, run the risk of violating this criterion or, at a minimum, making the interpretation of predictors extraordinarily difficult.2
In logit models, the terms are linear in the logit equation, the signs of coefficients are reliable, and the magnitudes of a single coefficient can be examined by setting other variables equal to modal values. This should not be confused with the broader class of nonlinear models represented by neural networks.
(3) The relative merits of competing theories about the data-generating process should be determined by an out-of-sample comparison of model fit. On this point we agree completely with the argument advanced by BKZ and believe that this issue deserves more attention in the discipline at large. Although BKZ's argument that forecasts are necessary is extraordinarily valuable, we believe that their standard for classifying predictions is too narrow. Specifically, BKZ report wars correctly classified without mention of the number of peaceful dyads incorrectly classified; additionally, they rely upon an arbitrary threshold for predicting “war,” making comparisons between different models very difficult. A more appropriate standard, and the one we follow here, is presented in King and Zeng 2001.
In accordance with the three criteria outlined above, we offer a comparison of three statistical procedures for explaining the onset of war. These procedures are linear discriminant analysis, logistic regression, and neural networks estimation. Each of these procedures embodies a different epistemological perspective and reflects different assumptions about the degree to which independent variables interact in generating international conflicts. After introducing these methods, we argue that the neural network's expansion of the parameter space suffers from two failings, which are implicit but not fully explained in BKZ's discussion. Specifically, the neural networks approach (a) leads to unnecessary uncertainty about causal relationships because of inefficient estimates and (b) precludes hypothesis testing that focuses on measuring or comparing the effects of particular variables.
Given these problems, there must be evidence of vital interaction effects based on out-of-sample forecasts to justify the use of the technique. Our empirical work demonstrates that this condition is not satisfied in the data and models presented by BKZ. Instead, we find that neural networks do not perform substantially better than traditional methods, at least compared to a logit model specified in a manner consistent with the literature and evaluated with a more appropriate array of forecasting diagnostics.3
In fact, the logit often outperforms neural networks on crucial dimensions, such as the ability to rank cases from most to least likely to experience a dispute.
So although BKZ have offered a valuable service to the discipline by raising neural networks as a viable alternative, the rejection of the traditional logistic approach is not nearly as decisive.
THREE MODELS OF MILITARIZED INTERSTATE DISPUTES
One of the most valuable contributions of BKZ's essay is that it has forced researchers to question whether orthodox statistical procedures are flexible enough to model a process as complex as the initiation of international conflicts. In the spirit of BKZ's essay, we compare neural networks, logistic regression, and linear discriminant analysis. Each of these is based on a different assumption about the complexity of the phenomenon under investigation. These three models can be naturally ordered from most complex (neural networks) to least (linear discriminants). The advantage of a neural network is its ability to estimate arbitrary functions, including causal relationships characterized by high degrees of interactivity and nonlinearity (Bishop 1995). Accordingly, it allows researchers to model the massively nonlinear, interactive conflict generation process described by BKZ. The model least able to model complex processes is the linear discriminant. This approach estimates a separating hyperplane that divides war from peace dyads, allowing for neither interactions nor nonlinearities. Logit models lie in between these extremes. Like the linear discriminant, logit models presume linear effects for the independent variables. However, logit adds some complexity by allowing the researcher to make ex ante specifications of expected non-linearities and interactive effects.
THEORY BUILDING IMPLICATIONS OF NEURAL NETWORKS
While neural networks are more flexible than the general linear model, this flexibility comes at considerable cost. At its core the application of neural networks reflects a choice to deemphasize ex ante theory development in favor of an unparsimonious and inductive model of the data-generating process. Rather than using theory to generate hypotheses about the nature of the functional relationships and adding a handful of appropriate terms to traditional models to capture those effects, BKZ's neural network increases the size of the parameter space almost 30-fold, allowing the authors to estimate an arbitrary function. Inflating the size of the parameter space causes inefficiency and often results in “overfitting the data.” Even though the resulting inferences may be unbiased, King, Keohane, and Verba (1994) identify the potentially serious consequence: “When we replicate a study in a new data set in which there is a high correlation between the key explanatory variable and an irrelevant control variable, we will be likely to find different results, which would suggest different causal inferences” (183).4
To a certain extent, the use of out-of-sample tests insulates BKZ from this problem; however, it should not be surprising to find that the neural network with almost as many parameters as conflict events would be outperformed by a much simpler model like logit or discriminant analysis.
The underlying problem is best illustrated by an example. Suppose that a hypothetical researcher, with neither knowledge of nor concern for theoretical claims, acquired a data set collected by someone else. Imagine that our researcher then estimated a logit model with a large set of nonlinear transformations (logs, squares, etc.) for each variable and inserted all possible two- and three-way interactive effects among the variables. This model would not be viewed as an important contribution to the literature but, rather, as an exercise in overfitting. But this approach is based on the same assumptions and a comparable number of parameters as used by BKZ for their neural network. In the absence of prior hypotheses about when particular variables are likely to influence outcomes and why, at best we can induce theory based on our findings, not test theory.
These problems are compounded by the fact that BKZ's results are difficult to interpret. For example, the use of a neural network makes it impossible to test hypotheses about the magnitude and direction of a predictor's influence on the dependent variable. The problem is that in an interactive, nonlinear model, the relationship between the dependent variable and a particular independent variable is heavily contingent on the values of the other independent variables in the model. This is not just a more complicated case of the difficulty in interpreting logit coefficients. At a minimum, the logit model's greater parsimony ensures that coefficients do not change signs, even if the magnitude of the effects may be somewhat cumbersome to evaluate. In neural networks, even the direction of a causal relationship can fluctuate with relatively minor permutations of the other variables in the model. This implies that the marginal effect tables presented in BKZ's article may be misleading, because it is not possible to determine the sensitivity of the findings to changes in the other variables.
It is important, however, to give credit to BKZ's argument that out-of-sample testing in part mitigates the harms cited above. In our view, their emphasis on prediction, rather than repeated efforts to fit models to a fixed data set, is a genuine contribution and should be heeded broadly in political science. Despite our agreement on this point, it is worth remembering that out-of-sample work only decreases the probability that an overfitted model will be selected. In essence, predictive work means that one must find a model that tolerably fits the sample as well as the out-of-sample set. It should be obvious that given time, ardent data miners will arrive at a model that satisfies these criteria. Although BKZ did not elect to follow this approach (i.e., they chose their model solely upon the in-sample performance before generating out-of-sample predictions, as did we), not all researchers will be puritans in this regard. Without the ability to examine a theory that researchers believe explains the data-generating process, it is very difficult, even with predictive work, to detect an overfitted model.
BROADENING THE STANDARDS FOR ASSESSING FORECASTS
In addition to our concerns about the role of theory in building models, we believe that BKZ failed to present consistent standards for evaluating their out-of-sample results. BKZ rightly remind us that forecasts on out-of-sample data help to distinguish between models that accurately reflect the underlying data-generating process and those arrived at through atheoretical curve-fitting. That is, forecasting indicates whether a model reflects the “true” causal process driving the phenomena of interest and guards us against “taking advantage of some idiosyncratic feature of the data” (BKZ, 21). Predictive success, however, should not be judged against an arbitrary 0.5 probability threshold. Given that forecasting is the goal, we believe that there are at least two sets of standards that one might use to determine the accuracy of a model's forecasts: (1) the model's dichotomous predictions of “success” and “failure” and (2) the model's predicted probabilities of “success” and “failure.”
Evaluation of Dichotomous Forecasts
This is the primary standard emphasized by BKZ. But, the thrust of their argument focuses on the ability of their neural network to occasionally forecast a dispute with a probability greater than 0.5. This measure of forecast accuracy is extremely suspect and should not be used without a decision-theoretic justification. The problem is that we typically face trade-offs between models that forecasts a large number of false negatives (failure to predict disputes) and alternatives with a greater number of false positives (failure to predict peace). The magnitude of this trade-off is dramatically revealed by BKZ's own results, in which the authors fail to generate more overall correct predictions than their own logit model.5
We cannot emphasize enough how brittle the choice of 0.5 is. A poor man's approach to logit that would yield more predictions of war would be to estimate from the training data a constant that adds to the logit model's Pr(war) such that one predicts conflict 4.1% of the time (i.e., our expectation of war prior to forecasting). Because the choice of this constant uses only the training set (i.e., NOT the test set), it is a painless way to arrive at a greater number of successful predictions of conflict in one's forecasts.
In general, the use of any arbitrary cutoff point to discriminate between “peace” and “war” or “success” and “failure” in classification tasks is risky, and may simply be inappropriate (Greene 1997, 892–93; King and Zeng 2001, 11–3; Swets 1988, 1285–93). Theoretical work on international conflicts provides us with an additional worry in choosing such a threshold. Statistical models provide the predicted probability of a conflict, but this probability may be low in all cases. As noted in Greene, “0.5, although the usual choice, may not be a very good value to use for the threshold. If the sample is unbalanced —that is, has many more 1's than 0's, or vice versa—then by this prediction rule, it might never predict a 1 (or 0)…. The obvious adjustment is to reduce [the threshold]” (892).6
See Morrow 1989 for an early attempt to address this problem with international conflict data.
Of course, one might view the generally low probabilities generated by logit models as a problem than can be fixed by neural networks. However, even wars that ultimately do occur may have been generated by circumstances where the ex ante probability of war was less than 0.5 (Fearon 1995; Gartzke 1999). For example, if we view war as “off-equilibrium” behavior (Gartzke 1999), then the precise timing of the outbreak of military conflict may result from some combination of idiosynchratic events. In this case any attempt to build systematic statistical models that generate high ex ante probabilities of military disputes will inevitably become an exercise in overfitting a particular dataset. The problem of low ex ante probabilities does not mean that logit models never predict conflict. After all, logit models can meaningfully distinguish situations in which the probability of conflict is negligible from those in which the risk is substantial. Moreover, if we observe four cases with predicted probabilities of 0.2, then the ex ante probability of conflict in at least one of those cases is over 0.5.—even if the model cannot predict exactly when crises will erupt.
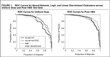
King and Zeng (2001) acknowledge in subsequent work that it is better to investigate the trade-offs between false positives and false negatives for a variety of predictive thresholds, and not penalize a model predisposed to predictions biased too high or too low. One way to look at different thresholds would be to generate a huge number of classification tables. A better solution, however, is to use receiver–operating characteristic (ROC) curves. ROC curves are diagnostics that are able to cope with the trade-offs between false positives and false negatives in model assessment (Swets 1988). These curves plot the proportion of conflicts correctly predicted on the x-axis and the proportion of nonconflicts correctly predicted on the y-axis. The intuition behind the graph is that any threshold used as the cutoff between a conflict and a peace prediction will correspond to a single point on this curve. The area below a single point on the curve corresponds to the proportion of true negatives for that cutoff, whereas the area above the point indicates the proportion of false positives. Similarly, the area to the left of a point corresponds to the proportion of true positives, whereas the area to the right of the point represents the proportion of false negatives. For example, if the cutoff is zero, then all disputes (but no cases of peace) are predicted correctly. Finally, as the cutoff varies over the range between zero and one, the curve will be negatively sloped, as fewer conflicts and greater numbers of peaceful dyads are forecast correctly.
The key point to glean from a pair of ROC curves used for model comparison is that the curve with more area underneath it corresponds to a greater proportion of successful predictions for both war and peace, regardless of what arbitrary threshold is settled upon for predicting war. In the absence of a specified optimal threshold, the area under an ROC curve provides a useful summary statistic that can arbitrate between competing models.
Evaluating Forecast Probabilities
The second set of standards used to evaluate forecasts relates to properties of a model's predicted probabilities rather than its dichotomous forecasts. These attributes can be derived from the joint distribution p(f, x), of the forecast probability f and the event x (Murphy and Winkler 1992). This is known as the “calibration-refinement factorization” of this distribution, where
factors the original joint distribution into separate components that reflect two desirable properties that a forecast should possess. First, the distribution of the forecast probabilities, p(f), indicates whether a model generates forecast probabilities that vary widely across the zero-to-one spectrum or if, instead, all predictions tend to cluster around a single value. This property is known as refinement and can be diagnosed using the variance of the predicted probabilities, a statistic that succinctly summarizes the dispersion around the mean prediction. Second, if f=p(x=1|f), then the predicted probability is a perfect reflection of the actual probability of conflict in a given situation. This property, known as calibration, would be perfectly satisfied, for example, if conflicts actually occurred in 10% of the dyads for which the forecasted probability was 0.1, and a similar relationship held for all other forecasted probabilities.
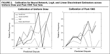
A useful diagnostic for calibration is the diagram used by BKZ in which forecasts were placed into bins of width 0.1 corresponding to whether the probabilities were in one of the following intervals: {(0, 0.1), (0.1, 0.2), …, (0.9, 1)}. For each bin, the mean predicted probability (e.g., 0.05 for the first bin, 0.15 for the second bin, and so on) is plotted on the x-axis versus the observed proportion of cases with conflict in that category. If the plot in the calibration table falls along the 45° line, then we would say that the forecast is well calibrated because for each of the bins f≈p(x=1|f).
When some bins are sparsely populated, calibration becomes difficult or impossible to assess with the diagram. In such cases a second useful diagnostic is the calibration index (CI). This has the form
where j indexes bins j=1, …, 10, Nj denotes the number of observations in bin j, fj the mean prediction in bin j, and xj the relative frequency of conflicts for observations in bin j (Yates 1990). Simply put, CI is the average departure of a calibration plot from the 45° line weighted by the number of observations in each bin. Smaller values of CI indicate a better-calibrated probability model.
DATA
We base our analyses on the data set used by BKZ and analyze the initiation of militarized disputes within “politically relevant dyads” between 1947 and 1989. The data included 23,529 dyad years; 976 of these years include a militarized dispute. As noted above, BKZ did not utilize a logit model that took into account the major findings of the quantitative securities studies literature. To rectify this problem, we added to our analysis variables and nonlinear transformations that we believe this literature has established as central to any model of dispute initiation. These choices represent a parsimonious addition of terms that are justified by previous research, and the success or failure of these terms in a logit model or discriminant analysis is open to inspection. We also included these new variables in our neural network and discriminant analyses, with the exception that we allowed the neural network to estimate the supposed nonlinearities and interactions endogenously. Thus, all three estimators are on a level playing field. Changes to the BKZ forecasting model are as follows.
Asymmetry of Military Capabilities
BKZ include asymmetry in their logit model, but most work (e.g., Oneal and Russett 1999) has hypothesized that the relationship between military capabilities is curvilinear. Importantly, these same studies have found substantial support for this hypothesis. Thus we also include the square of the asymmetry value in order to account for this relationship.
Major-Power Status
It is well established that major-power states are much more likely to engage in military conflict. (Bremer 1992; Maoz and Russett 1993; Oneal and Russett 1999). We add this variable to all three models, based on data from the Correlates of War (COW) data set.
Distance
Although BKZ include a dummy variable identifying contiguous states, the actual distance between states has also been shown to have a substantial impact on military conflict (Bremer 1992; Maoz and Russett 1993; Oneal and Russett 1999). Therefore, we generated a variable to measure the distance between each pair of states in a dyad using the EUGene program (Bennett and Stam 2000).
Democracy
BKZ include democracy in their models but do not specify the impact as interactive (Bueno de Mesquita and Lalman 1992; Maoz and Russett 1993, Rousseau et al. 1996). This interactive specification is standard in the literature and thus we include the interaction of the two democracy scores in the dyad (rescaling the democracy variables appropriately). Additionally, a number of scholars suggest that the impact of democracy on conflict may be curvilinear (Goemans 2000; Mansfield and Snyder 1995; Snyder 1991). We model this theorized curvilinear effect by including the square of the interaction of regime-types.
FORECASTING MILITARIZED DISPUTES: A SECOND LOOK
Before discussing the results of the competing models, note that all models were estimated using a pre-1985 training set, as in BKZ. We do, however, make two departures from the original work. First, we extracted two different subsamples from the main data set to use for out-of-sample forecasts. One of these samples was the test set reported in BKZ, consisting of all dyads in the years after 1985. We also withheld a second test set by drawing a 5% uniform random sample of the dyad-years from 1947 to 1985. The latter test set was used to test for robustness, and serves as a useful tool to determine whether the particular cutoff of 1986 for BKZ's test set might be fortuitous, aiding or hurting different models.7
We also generated additional test sets using different thresholds (e.g., 1984 instead of 1986) and found that all models performed substantially worse than in the 1986–89 test set.
Second, we do not present results from the training set; to do so may artificially inflate the models' apparent performances and deflect attention from their out-of-sample performance.
We report the results from a logit model estimated in the standard manner; a linear discriminant model estimated using a method similar to that proposed by Fisher, assuming that each class has an equivalent covariance matrix; and two different neural networks estimated with the same basic functional form as that estimated by BKZ.8
We implement the Levenberg–Marquardt (LM) algorithm with Bayesian regularization to penalize overfitting and a variable learning rate for computational efficiency in MATLAB's Neural Network Toolbox. Because LM is a hill-climbing algorithm that can be sensitive to the initial parameter values, we also estimated multiple models with random starting values for each number of hidden units (Bishop 1995). Following BKZ, to determine the number of hidden units we varied their number and compared their forecasting performance on a set of observations withheld from the training set. We find that 15 hidden units seemed to generally offer the best fit and report the results for two neural networks that possessed different sets of initial values that performed “best” on different forecasting criteria reported below.
We report results for two different neural networks because our two test data sets identified different neural nets as optimal. The first neural network maximized the number of correct dichotomous predictions using 0.5 as the prediction threshold in the training set. This model was optimal for the post-1985 test set (though not for other thresholds; see footnote 6). As we noted above, we do not advocate this criterion, but we report the model so as to present the best possible performance according to BKZ's standards. The second neural net maximized the area under the ROC curve in the training set, and so it attempts to maximize forecasting accuracy across a variety of predictive thresholds. This was optimal for the uniform draw test set.
Dichotomous Predictions
The abilities of the four models to rank-order cases from most to least likely were evaluated using ROC curves. Table 1 reports the area under the ROC curves and Figure 1 plots the ROC curve for each model. Perhaps the strongest support for BKZ, with respect to the ROC curves, can be found in the forecasts on the pre-1985 uniform draw test set. As Table 1 indicates, the neural network that maximized the area under the ROC curve in the training set marginally outperformed all of the other models in this forecast set. Specifically, the area under its ROC curve was 0.8555, whereas the area under the ROC curve for the logit estimator was 0.8372.
Given the rarity of militarized disputes, one should not dismiss even a modest increase in forecasting accuracy, but one cannot avoid the impression that the difference between these models is quite small. In fact, even the ROC-maximizing neural network is not the best estimator for all possible predictive thresholds. As indicated in Figure 1, the plots for the logit and ROC-maximizing neural network tend to weave around one another, indicating that the forecasts of these estimators are nearly indistinguishable across the range of thresholds. Indeed, if any of the estimators stands out from the others on the pre-1985 test set, it is the overall weakness of the neural network that focuses exclusively on the 0.5 classification threshold.
Our results are even less supportive of BKZ when we examine the post-1985 test data set. In this case, the logit and discriminant models both outperformed the neural networks. Table 1 reports that the logistic regression had the greatest area under its ROC curve, at 0.9152, while the linear discriminant had the second greatest, at 0.8722. Figure 1 demonstrates that for practically any given tolerance of false positives, the logit model either outperformed or was indistinguishable from its rivals. The overwhelming impression left by this set of results is that there is little difference among the neural network, logit, and discriminant analyses in terms of their ability to distinguish between dispute and nondispute cases, once one controls for a model's inherent bias toward predictive probabilities that are either too high or too low.
Predicted Probabilities
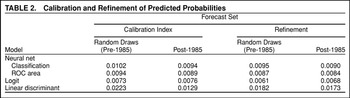
The calibration index reported in Table 2 and the calibration diagrams in Figure 2 indicate the extent to which the forecast probabilities are consistent with the actual probability of a war. The calibration index reported in Table 2 suggests that the logistic regression offered the best-calibrated set of predictions for both of the test sets, followed closely by the two neural networks. The linear discriminant provided the most poorly calibrated results, which is not surprising given the restrictive assumptions made by this model. The plots in Figure 2 for the uniform draws from the pre-1985 period confirm these findings. Both the logit model and the neural network that maximized the area under the ROC curve in the training set had calibration plots that fell roughly along an imaginary 45° line from the origin. Thus, for both of these models, the forecast probability of a dispute was approximately equal to the relative frequency of conflicts at a given predicted probability. The plot for the neural network that minimized the number of classification errors in the training set gyrates widely, but this model still performed well in terms of the calibration index, because there were relatively few observations in the range of forecast probabilities where the fluctuations were greatest.
Plots for the post-1985 test set suggest a level of calibration similar to that found from the uniform draws. As indicated in Table 2, logit continues to be the best-calibrated model, followed closely by the neural network that maximized the area under the ROC curve. Figure 2 indicates that predictions for the logit model fall approximately along the imaginary 45° line. The logit's calibration curve does drop sharply when it reaches above 0.5, but this drop is due to a single incorrect prediction with a probability greater than 0.6. With the exception of that error, the logit model remains well calibrated, as confirmed by the results from the calibration index in Table 2. The neural network that minimized the number of classification errors at the 0.50 threshold appears to be better calibrated in the post-1985 test set than in the previous test. Nonetheless, it continues to rank third among the four estimators.
The level of refinement for these models is also diagnosed in Table 2, which reports the variance in the predicted probabilities for the three models. As BKZ suggest, the forecasts of the neural networks are spread across a wider range of values than are the logit model's forecasts. This higher level of refinement indicates that it might be easier for decision makers to recognize the changes in the predicted probabilities of neural network models as substantively meaningful. However, the neural networks are themselves badly outperformed on this diagnostic by the linear discriminant, which has approximately twice the forecast variance in both test sets.
SUMMARY AND CONCLUSIONS
BKZ offered a provocative claim: Estimators based on the general linear model fundamentally misspecify the dispute generation process. If correct, this claim calls decades of research on international conflict into question. Theoretical debates on deterrence, the democratic peace, economic interdependence, and many other issues have all relied on the general linear model for testing their competing arguments. In this paper, we sought to determine whether this generation of scholarship should be rejected because of its reliance on inappropriate methodologies. We conclude that the answer is no, that there is little evidence that the general linear model is fundamentally biased or incomplete. Our empirical work shows that although neural networks may make more extreme predictions about the probability of international conflict than logit, they do not offer better forecasts of whether or not states engage in militarized disputes. The ROC curves, in particular, demonstrate that neural networks are not better at discriminating between dispute and nondispute cases. In fact, in some out-of-sample forecasts, logit proved to be the better estimator. Even the linear discriminant—which makes assumptions about the data-generation process that are directly opposite those of the neural network—does nearly as well as the modestly nonlinear logit and massively interactive and nonlinear neural network, providing some indication that the process that generates wars is less complex than argued by BKZ.
Why is it that we found a logit model to be a perfectly adequate predictor of international conflicts, whereas BKZ did not? The main source of this discrepancy was our inclusion of additional variables and transformations of variables that are standard in quantitative models of international conflict. BKZ's omission of these relevant variables disadvantaged the logit model more than the neural network because the latter estimator, in a beautiful way, is able to endogenously estimate proxies for the omitted variables. However, once we added the relevant variables to the analyses, a neural network was no longer needed to endogenously estimate these nonlinearities. And as one might expect, the logit's greater efficiency made it more robust in out-of-sample forecasts than the neural network.
In the prediction of international disputes, it is clear that neural networks hold few unambiguous advantages over fully specified and theoretically grounded logit models. And it is worth remembering that neural networks carry significant costs, as one forfeits the opportunity to measure particular parameters and test their statistical significance. If we are in the business of theory testing, then we should select our statistical estimators to reflect the level of complexity specified by our theories. We are not aware of any theories in the study of international conflict that specify a functional form so complex as to require, or even suggest, a neural network. In the absence of such theories, models should be constrained to a functional form that does not differ substantially from more traditional estimators.






Comments
No Comments have been published for this article.