1. Introduction
In the natural environment and industrial applications, the motility (or swimming motion) of micro-organisms plays an important role in their transport processes. These motile micro-organisms often swim towards light, food, oxygen or against gravity, as it would offer a better living condition. These stimulus-guided motility of micro-organisms are called ‘taxis’. In a suspension of these micro-organisms, such taxes can significantly impact on how they distribute themselves both spatially and temporally as well as on rheological properties. For example, in a shallow suspension of swimming algae where bioconvective patterns are often observed, light, oxygen and gravity are known to suppress or encourage the pattern formation (Bees Reference Bees2020).
Gyrotaxis is an example of such taxes, and is seen in some unicellular species of algae, such as Chlamydomonas, Dunaliella and Heterosigma, which are bottom-heavy (i.e. the centre of gravity is offset from the centre of buoyancy). These micro-organisms typically experience a gravitational torque due to the bottom-heaviness, and it makes them orient upwards in the absence of flow. However, in the presence of a vortical flow, their orientation deviates from the vertical due to the viscous torque from the flow vorticity (Kessler Reference Kessler1985b). For example, in a vertical pipe with a downward flow, the balance between the viscous torque and the gravitational torque creates a swimming-oriented flux of cells towards the centre, resulting in their accumulation along the centreline of the pipe. The column of such accumulated cells, often called a gyrotactic plume, can further accelerate the flow at the centreline due to the negative buoyancy force exerted by the cells, thereby further increasing the shear and attracting even more cells towards itself (Kessler Reference Kessler1986a).
The gyrotactic plume was first documented in a series of experimental studies carried out with vertical pipe flows by Kessler (Reference Kessler and Velarde1984, Reference Kessler1985a,Reference Kesslerb, Reference Kessler1986a), who coined the term ‘gyrotaxis’ to describe how the orientation of a bottom-heavy cell is influenced by the vorticity in the surrounding flow and the gravity. Further to the formation of a gyrotatic plume along the pipe centreline in the downward flow, he observed that, under certain conditions, the plume could experience an instability, which subsequently breaks it down into multiple blips. The blips are the localised regions of a higher density of the cells, and are spontaneously formed along the gyrotactic plume at the late stage of the instability. In general, they are more pronounced when the background concentration is high. They are also almost uniformly spaced vertically and remain axisymmetric (Kessler Reference Kessler1986a; Denissenko & Lukaschuk Reference Denissenko and Lukaschuk2007).
Kessler (Reference Kessler1986a) originally modelled the spatial distribution of the cells with a simple advection–diffusion based transport equation for cell concentration to understand his experimental observations, where the horizontal advection velocity was modelled to be proportional to ambient vorticity and the diffusivity was assumed to be constant and isotropic. Although the model is somewhat primitive, it enabled him to subsequently find an analytic solution of the plume structure for the special case where the imposed pressure gradient is zero. Since the pioneering work of Kessler, numerous efforts have been made to improve the description for the transport of cell concentration. Pedley & Kessler (Reference Pedley and Kessler1990) introduced the first model accounting for the random walk of individual cells, in which the swimming orientation of an individual cell was described by the Jeffery's equation (Jeffery Reference Jeffery1922; Hinch & Leal Reference Hinch and Leal1972a,Reference Hinch and Lealb) with a superposed white noise for rotational random walk. A probability density function (p.d.f.) for the cell orientation was obtained by formulating a Fokker–Plank equation, and the diffusivity was approximated from the related correlation of the cell orientation vector. Hill & Bees (Reference Hill and Bees2002) and Manela & Frankel (Reference Manela and Frankel2003) later proposed the use of generalized Taylor dispersion (GTD) theory, which approximates the diffusivity from the p.d.f. of a single tracer particle defined in both orientation and physical space. Bees & Croze (Reference Bees and Croze2010) and Bearon, Bees & Croze (Reference Bearon, Bees and Croze2012) recently employed the GTD model to study the dispersion of gyrotactic cells in a downward pipe flow. In particular, Bearon et al. (Reference Bearon, Bees and Croze2012) showed that the prediction of the GTD model on the cell-concentration distribution is significantly different from that of the model of Pedley & Kessler (Reference Pedley and Kessler1990). Importantly, a recent numerical study by Croze et al. (Reference Croze, Sardina, Ahmed, Bees and Brandt2013) further showed that the GTD model provides a much more accurate prediction for the cell distribution obtained from individual-based simulation than the one by Pedley & Kessler (Reference Pedley and Kessler1990) especially when the shear (or vorticity) rate of the surrounding flow is high. Recently, Jiang & Chen (Reference Jiang and Chen2020) have also demonstrated the superiority of the GTD model without making any approximation to the Smoluchowski equation. This observation was further supported by the recent experimental result in Croze, Bearon & Bees (Reference Croze, Bearon and Bees2017).
In the light of emerging evidence supporting the use of the GTD model at least for unidirectional flows (for this issue, see also Bearon, Hazel & Thorn Reference Bearon, Hazel and Thorn2011), the present study aims to study the emergence of the blips observed in the original pipe flow experiment of Kessler (Reference Kessler1986a) using the GTD model. Recently, the stability of gyrotactic plumes emerging in a downward plane channel flow was studied by Hwang & Pedley (Reference Hwang and Pedley2014b) using a model basically identical to the one by Pedley & Kessler (Reference Pedley and Kessler1990). Interestingly, they reported the emergence of a varicose-type instability mode sharing some similarities with the blips observed in pipe flow (e.g. spacing between blips). Despite the encouraging observation, no such analysis is available for pipe flows, and, therefore, it is not possible to make any direct comparison with the previous experiments (Kessler Reference Kessler1986a; Denissenko & Lukaschuk Reference Denissenko and Lukaschuk2007; Croze et al. Reference Croze, Bearon and Bees2017). Nevertheless, bifurcation and stability of any gyrotactic micro-organism suspensions have only been studied either using the early primitive model of Pedley, Hill & Kessler (Reference Pedley, Hill and Kessler1988) (e.g. Hill, Pedley & Kessler Reference Hill, Pedley and Kessler1989) or using the model of Pedley & Kessler (Reference Pedley and Kessler1990) (e.g. Bees & Hill Reference Bees and Hill1997; Pedley Reference Pedley2010a; Hwang & Pedley Reference Hwang and Pedley2014a,Reference Hwang and Pedleyb; Maretvadakethope, Keaveny & Hwang Reference Maretvadakethope, Keaveny and Hwang2019). For this reason, the issue of how important having an accurate cell transport model is for the prediction of the pattern-forming motions in the suspension remains completely elusive.
The objective of the present study is to extensively study the bifurcation and stability of downflowing suspensions in a vertical pipe using the GTD model. Unlike the channel flow studied by Hwang & Pedley (Reference Hwang and Pedley2014b), in this set-up we shall see the emergence of bistability and the related hysteresis in the bifurcation of the basic state, the possibility of which was previously conjectured by Bees & Croze (Reference Bees and Croze2010). Further to this, a particular emphasis of the present study is given to an extensive and comparative assessment of the model by Pedley & Kessler (Reference Pedley and Kessler1990) and the GTD model for studying bifurcation and stability of the suspension in a downward pipe flow. From this, we shall see that the prediction of the GTD model offers a much more realistic description for the experimental observation on the blip instability than that of the model by Pedley & Kessler (Reference Pedley and Kessler1990), highlighting the need for having a correct cell transport model to accurately describe pattern-forming fluid motions in suspensions of gyrotactic micro-organisms.
This paper is organised as follows. In § 2 the equations of motion are introduced and formulated for linear stability analysis with the model of Pedley & Kessler (Reference Pedley and Kessler1990) and the GTD model. In § 3 the bifurcation of the basic state given in the form of a steady axisymmetric and axially uniform plume is first shown with particular emphasis on their bistable nature in a range of the given parameters. The instability of these basic states is subsequently studied in § 4. The implication of these findings is discussed in § 5 from both experimental and theoretical perspectives. The paper is concluded with a brief discussion on the shortcoming of the GTD model with an outlook to improve this model.
2. Problem formulation
2.1. Equations of fluid motion
We consider a downward fluid flow in a cylindrical vertical pipe, in which a puller type of spherical gyrotactic micro-organisms are suspended (e.g. Chlamydomonas nivalis, Dunaliella and Volvox). We express the position of a point in space in terms of cylindrical co-ordinates  $r^*$,
 $\psi ^*$ and
 $z^*$, the radial, azimuthal and streamwise (or axial) co-ordinates, and the corresponding unit vectors
 ${\boldsymbol {i}}$,
 ${\boldsymbol {j}}$ and
 ${\boldsymbol {k}}$. The fluid has density
 $\rho ^*$ and kinematic viscosity
 $\nu ^*$, and the gravity is in the same direction as
 $z^*$. The local coordinates of
 ${\boldsymbol {e}}=(e_1,e_2,e_3)$ are introduced for the swimming orientation of the cells, and are defined on the surface of unit sphere (i.e.
 $\|{\boldsymbol {e}}\|=1$), where
 $e_1$,
 $e_2$ and
 $e_3$ indicate the radial, upward (
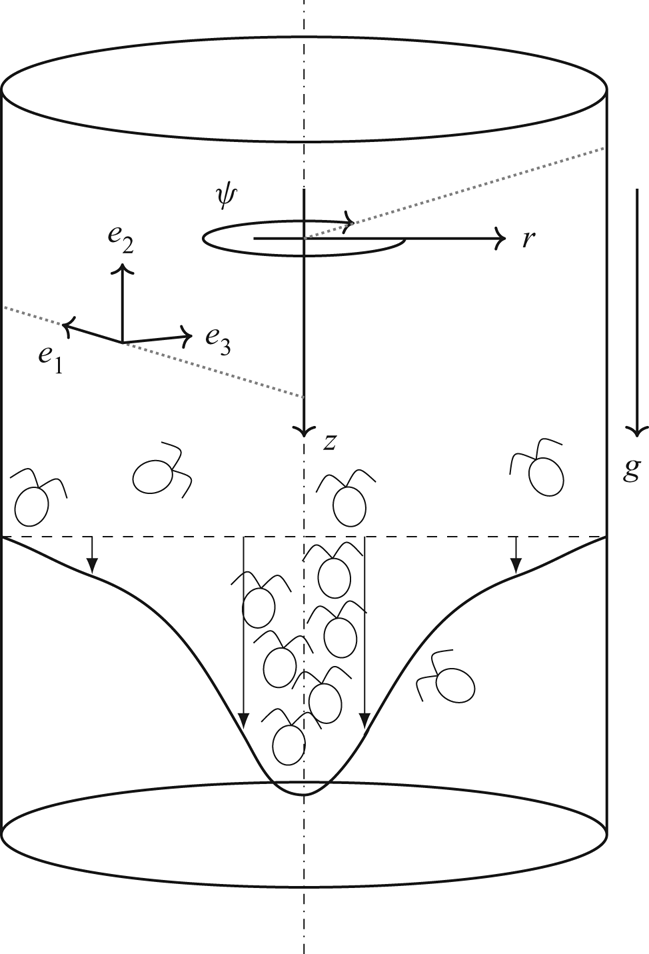
 $-z^*$) and azimuthal components, respectively. Both of the coordinate systems and the flow geometry are sketched in figure 1. We will also repeat some of the key assumptions made in Hwang & Pedley (Reference Hwang and Pedley2014a,Reference Hwang and Pedleyb), where a more detailed discussion and justifications on the assumptions in the present study can be found. The fluid motion is described by the following equations:
 \begin{gather} \boldsymbol{\nabla}^* \boldsymbol{\cdot} \boldsymbol{u}^* = 0, \end{gather}
 \begin{gather}\frac{\partial \boldsymbol{u}^*}{\partial t^*} + (\boldsymbol{u}^* \boldsymbol{\cdot} \boldsymbol{\nabla}^*) \boldsymbol{u}^* = -\frac{1}{\rho^*} \boldsymbol{\nabla}^* p^* + \nu^* \nabla^{*2} \boldsymbol{u}^* + n^* \upsilon^* g'^* \boldsymbol{k}+\boldsymbol{\nabla}^* \boldsymbol{\cdot} \boldsymbol{\varSigma}_p^*. \end{gather}
Here, the velocity,  ${\boldsymbol {u}}^*=(v^*,w^*,u^*)$, is resolved into the cylindrical components,
 $p^*$ is the pressure,
 $n^*$ the cell number density,
 $\upsilon ^*$ the volume of a single cell and
 $g'^*=g ^*{\rm \Delta} \rho ^* / \rho ^*$ the reduced gravity, where
 $g^*$ and
 ${\rm \Delta} \rho ^*$ are the gravitational acceleration and the density difference between the micro-organism and the fluid, respectively. Following Hwang & Pedley (Reference Hwang and Pedley2014b), we neglect the stresslet term
 $\boldsymbol {\nabla }^* \boldsymbol {\cdot } \boldsymbol {\varSigma }_p^*$, which would be dominantly contributed by the locomotion of the suspended cells (Pedley & Kessler Reference Pedley and Kessler1990). For the ‘puller’-type swimmers, the stresslet term
 $\boldsymbol {\varSigma }_p^*$ is not, in general, responsible for the generation of any instabilities (Saintillan & Shelley Reference Saintillan and Shelley2007, Reference Saintillan and Shelley2008; Pedley Reference Pedley2010a). This term is also negligible compared to the negative buoyancy (Pedley & Kessler Reference Pedley and Kessler1990). We will also neglect any near-field cell–cell interactions (Kessler, Hill & Hader Reference Kessler, Hill and Hader1992; Ishikawa & Pedley Reference Ishikawa and Pedley2007) based on the assumption that the suspension is dilute enough. The validity of the assumption of dilute suspension here will be revisited later in § 5.2.
Schematic diagram of the flow configuration and the frames of reference. Here the stability analysis is performed on the global frame of reference  ${\boldsymbol {x}}=(r,\psi ,z)$, but the cell swimming direction is calculated in the local frame of reference
 ${\boldsymbol {e}}=(e_1,e_2,e_3)$.

2.2. Models for cell transport
Now, we introduce the transport equation for the cell concentration given in the form of an advection–diffusion equation:
 \begin{equation} \frac{\partial n^*}{\partial t^*} + \boldsymbol{\nabla}^* \boldsymbol{\cdot} [(\boldsymbol{u}^* + V^*_c \langle {\boldsymbol{e}} \rangle ) n^*] = \boldsymbol{\nabla}^* \boldsymbol{\cdot} (\boldsymbol{\mathsf{D}}_m^* \boldsymbol{\cdot} \boldsymbol{\nabla}^* n^*). \end{equation}
Here  ${\boldsymbol {u}}^* + V^*_c \langle {\boldsymbol {e}} \rangle$ is the advection velocity, in which
 $V^*_c$ is the cell swimming velocity assumed to be constant and
 $\langle {\boldsymbol {e}} \rangle$ represents the locally ensemble-averaged swimming orientation vector, and
 ${\boldsymbol{\mathsf{D}}}_m^*$ is the ‘effective’ diffusivity tensor, the detailed definition of which will be introduced below with the subscript
 $m$. We note here that the diffusivity tensor
 ${\boldsymbol{\mathsf{D}}}_m^*$ is designed to model the spatio-temporal dispersion of the cells phenomenologically. It models the random walk originating from the cell motility and the random cell orientation. Whilst it can also incorporate translational Brownian motion, because the typical size of the cells of interest in the present study (e.g. Chlamydomonas) is too large to experience such a thermal fluctuation, we neglect this here (see Pedley & Kessler Reference Pedley and Kessler1992; Saintillan Reference Saintillan2018).
Based on (2.3), we now introduce two models for  $\langle {\boldsymbol {e}} \rangle$ and
 ${\boldsymbol{\mathsf{D}}}_m^*$. The first model, often called the Fokker–Planck model, was first introduced by Pedley & Kessler (Reference Pedley and Kessler1990). The second model is based on the GTD theory, first proposed by Brenner (Reference Brenner1980). This theory was previously applied to gyrotactic micro-organisms by Hill & Bees (Reference Hill and Bees2002) and Manela & Frankel (Reference Manela and Frankel2003). For simplicity, hereafter, we shall refer to the Fokker–Planck model as model F, and the model based on GTD theory as model G, respectively. The behaviours of
 $\langle {\boldsymbol {e}} \rangle$ and
 ${\boldsymbol{\mathsf{D}}}_m^*$ with respect to the external velocity gradient in the two models have been extensively discussed in several previous studies (Manela & Frankel Reference Manela and Frankel2003; Bearon et al. Reference Bearon, Bees and Croze2012; Croze et al. Reference Croze, Sardina, Ahmed, Bees and Brandt2013, Reference Croze, Bearon and Bees2017). Therefore, in the following sections, we will introduce them only briefly.
2.2.1. Model F
In model F each cell is modelled as a motile spheroid performing a random rotational motion with gyrotaxis. For this purpose, a probability density function  $f$ of the cell swimming orientation is introduced to describe the random rotation in the
 ${\boldsymbol {e}}$-space, which satisfies the steady Fokker–Planck equation (Pedley & Kessler Reference Pedley and Kessler1990)
 \begin{equation} \boldsymbol{\nabla}_e \boldsymbol{\cdot} \left[ \boldsymbol{\dot{e}}^* f \right] = D_R^* \boldsymbol{\nabla}^2_e f, \end{equation}
subject to
 \begin{equation} \int_{\|\boldsymbol{e}\|=1} f(\boldsymbol{e}) \,\textrm{d}^2\boldsymbol{e}=1,\end{equation}
and  $\boldsymbol{\dot{e}}^*$ is given by the Jeffrey's equation (Jeffery Reference Jeffery1922; Hinch & Leal Reference Hinch and Leal1972a,Reference Hinch and Lealb)
 \begin{equation} \boldsymbol{\dot{e}}^* = \frac{1}{2\beta^*}[-\boldsymbol{k}+(\boldsymbol{k} \boldsymbol{\cdot} \boldsymbol{e})\boldsymbol{e}] +\frac{1}{2} \boldsymbol{\varOmega}^* \wedge \boldsymbol{e}.\end{equation}
Here,  $\boldsymbol {\varOmega }^*=\boldsymbol {\nabla }^* \wedge {\boldsymbol {u}}^*$ is the vorticity and
 $\beta ^*$ is the gyrotactic time scale. The random rotational motion is represented by a constant isotropic diffusivity
 $D_R^*$ (Pedley Reference Pedley2010b). We also note here that the cell is assumed to be spherical in (2.4c), so that the effect of cell eccentricity (hence, the effect of strain rate) is neglected. This assumption excludes the appearance of instability mechanisms due to the cell shape: for example, rod-like swimming cells in suspension may yield the instability proposed by Koch & Shaqfeh (Reference Koch and Shaqfeh1989) and Saintillan, Shaqfeh & Darve (Reference Saintillan, Shaqfeh and Darve2006). However, for more rounded algal species like those in the Chlamydomonas genus, O'Malley & Bees (Reference O'Malley and Bees2012) showed that the effective cell eccentricity of a swimming cell is much smaller than that of an inanimate body due to the influence of flagella beating. Therefore, in effect, a spherical approximation of the cell is a reasonable approximation at the continuum level.
In model F the average cell swimming direction is obtained as
 \begin{equation} \langle \boldsymbol{e} \rangle \equiv \int_{\|\boldsymbol{e}\|=1} \boldsymbol{e} f(\boldsymbol{e})\,\textrm{d}^2\boldsymbol{e}. \end{equation}
The diffusivity tensor is given by the covariance matrix multiplied by a correlation time scale  $\tau ^*$, i.e.
 \begin{equation} {\boldsymbol{\mathsf{D}}}_F^*={V_c^*}^2 \tau^* (\langle \boldsymbol{e} \boldsymbol{e}\rangle -\langle \boldsymbol{e} \rangle \langle \boldsymbol{e} \rangle), \end{equation}
where the subscript  $F$ in place of
 $m$ denotes the diffusivity obtained from model F. As discussed by Pedley (Reference Pedley2010b), such a form of diffusivity is essentially ad hoc, as the correlation time scale takes into account both the natural variability of the cell properties in the population and the randomness in the cell swimming direction. Therefore, the correlation time scale
 $\tau ^*$ has often been used from the values directly obtained from experimental measurements (Hill & Häder Reference Hill and Häder1997; Vladimirov et al. Reference Vladimirov, Denissenko, Pedley, Wu and Moskalev2000). In the present study we will use
 $\tau ^*=5.35 s$, which is slightly different from
 $\tau ^*=5 s$ used in previous studies (e.g. Hwang & Pedley Reference Hwang and Pedley2014b), as this will allow us to set models F and G to share the same radial diffusivity in stationary suspension. A detailed discussion on this issue will be given in § 2.7.
2.2.2. Model G
Model G was developed from the Smoluchowski equation, which describes the probability density function in both physical and orientational space. In this respect, the ‘diffusivity’ in (2.3) would be interpreted as a consequence of the dispersion resulting from the interaction between the random cell orientation and the translational swimming motion. Model G uses the same averaged cell swimming direction vector as that of model F (i.e. (2.5)). However, it gives a different form for the effective diffusivity (Hill & Bees Reference Hill and Bees2002; Manela & Frankel Reference Manela and Frankel2003),
 \begin{equation} {\boldsymbol{\mathsf{D}}}_G^*=\int_{\|\boldsymbol{e}\|=1} \left[ f(\boldsymbol{e})\boldsymbol{B}^*(\boldsymbol{e})\boldsymbol{e} {V^*_c}+f(\boldsymbol{e})\boldsymbol{B}^*(\boldsymbol{e})\boldsymbol{B}^*(\boldsymbol{e}) \boldsymbol{\cdot} \boldsymbol{\mathsf{G}}^* \right]^{sym} \textrm{d}^2 \boldsymbol{e}, \end{equation}
where the subscript  $G$ in the place of the subscript
 $m$ indicates that the diffusivity originates from model G, and
 $\boldsymbol{\mathsf{G}}^*(\equiv \nabla ^*\textbf {u}^*$) is the local velocity gradient tensor. In (2.7),
 $f({\boldsymbol {e}})$ is obtained from (2.4a) as in model F, and the vector
 ${\boldsymbol {B}}^*({\boldsymbol {e}})$ satisfies
 \begin{equation} \boldsymbol{\nabla}_e \boldsymbol{\cdot} \left[ \dot{\boldsymbol{e}}^* f\boldsymbol{B}^*- D_R^* \boldsymbol{\nabla}_e(\,f\boldsymbol{B}^*)\right]-f\boldsymbol{B}^* \boldsymbol{\cdot} \boldsymbol{\mathsf{G}}^* = V_c^*( \boldsymbol{e}-\langle {\boldsymbol{e}} \rangle)f, \end{equation}
subject to
 \begin{equation} \int_{\|\boldsymbol{e}\|=1} f \boldsymbol{B}^*(\boldsymbol{e}) \,\textrm{d}^2\boldsymbol{e}=\textbf{{0}}. \end{equation}
Here,  ${\boldsymbol {B}}^*({\boldsymbol {e}})$ is the long-time limit of the difference between the overall average position, and the average position of the cell given its instantaneous orientation is
 $\boldsymbol {e}$ (Hill & Bees Reference Hill and Bees2002). Thus, the form of (2.8) implies that the dimension of
 ${\boldsymbol {B}}^*$ is length, and its appropriate scale would be
 $V_c^* /D_R^*$.
2.3. Non-dimensionalisation and boundary conditions
The equations of motion (2.1), (2.2), (2.3) and (2.4a) are non-dimensionalised by
 \begin{equation} \boldsymbol{x}=\frac{\boldsymbol{x}^*}{h^*}, \quad t=\frac{t^* V_c^*}{h^*}, \quad \boldsymbol{u}=\frac{\boldsymbol{u}^*}{V_c^*}, \quad p=\frac{p^*}{\rho^*V_c^{*2}}, \quad n=\frac{n^*}{N^*}, \end{equation}
where  $N^*$ is the cell concentration if the suspension is set to be uniform and
 $h^*$ is the pipe radius. The resulting dimensionless equations are
 \begin{gather} \boldsymbol{\nabla} \boldsymbol{\cdot} \boldsymbol{u} = 0, \end{gather}
 \begin{gather}\frac{\partial \boldsymbol{u}}{\partial t} + (\boldsymbol{u} \boldsymbol{\cdot} \boldsymbol{\nabla}) \boldsymbol{u} = -\boldsymbol{\nabla} p + \frac{1}{Re} \nabla^{2} \boldsymbol{u} + Ri\,n\boldsymbol{k}, \end{gather}
 \begin{gather}\frac{\partial n}{\partial t} + \boldsymbol{\nabla} \boldsymbol{\cdot} [(\boldsymbol{u} + \langle {\boldsymbol{e}} \rangle ) n] = \frac{1}{D_R} \boldsymbol{\nabla} \boldsymbol{\cdot} ({\boldsymbol{\mathsf{D}}}_m \boldsymbol{\cdot} \boldsymbol{\nabla} n), \end{gather}
 \begin{gather}\boldsymbol{\nabla}_e \boldsymbol{\cdot} \left[ \lambda[-\boldsymbol{k}+(\boldsymbol{k} \boldsymbol{\cdot} \boldsymbol{e})\boldsymbol{e}]\,f+\frac{1}{2 D_R} \boldsymbol{\varOmega} \wedge \boldsymbol{e} f \right] = \boldsymbol{\nabla}^2_e\,f, \end{gather}
with boundary conditions
 \begin{gather} \boldsymbol{u} |_{r=1} = (0,0,0)^\textrm{T}, \end{gather}
 \begin{gather}\left. \left[(\boldsymbol{u} + \langle {\boldsymbol{e}} \rangle ) n - \frac{1}{D_R} {\boldsymbol{\mathsf{D}}}_m \boldsymbol{\cdot} \boldsymbol{\nabla} n \right] \right|_{r=1} \boldsymbol{\cdot} \boldsymbol{i} = 0, \end{gather}
where
 \begin{equation} Ri=\frac{\displaystyle N^* \upsilon^* g'^*h^*}{\displaystyle V_c^{*2}}, \quad Re=\frac{\displaystyle V_c^*h^*}{\displaystyle \nu^*}, \quad \lambda=\frac{\displaystyle 1}{\displaystyle 2\beta^* D_R^*}, \quad D_R=\frac{D_R^* h^*}{V_c^*}.\end{equation}
Here,  $Re$ is the Reynolds number based on the cell swimming speed,
 $Ri$ the Richardson number and
 $D_R$ the dimensionless rotational diffusivity. We note that (2.10d) is further divided by
 $D_R$, since the appropriate time scale in the cell orientation space would be
 $1/D_R^*$, different from
 $h^*/V_c^*$ in the physical space. Lastly, the dimensionless translational diffusivities for models F and G are given by
 \begin{equation} \boldsymbol{\mathsf{D}}_F=\frac{\displaystyle \boldsymbol{\mathsf{D}}^*_F D_R^*}{\displaystyle V_c^{*2}}=\tau (\langle \boldsymbol{e} \boldsymbol{e}\rangle -\langle \boldsymbol{e} \rangle \langle \boldsymbol{e} \rangle) \end{equation}
and
 \begin{equation} \boldsymbol{\mathsf{D}}_G=\frac{\displaystyle \boldsymbol{\mathsf{D}}^*_G D_R^*}{\displaystyle V_c^{*2}}=\int_{\|\boldsymbol{e}\|=1} \left[ f(\boldsymbol{e})\boldsymbol{B}(\boldsymbol{e})\boldsymbol{e} +f(\boldsymbol{e})\boldsymbol{B}(\boldsymbol{e})\boldsymbol{B}(\boldsymbol{e}) \boldsymbol{\cdot} \boldsymbol{\mathsf{G}} \right]^{sym} \textrm{d}^2 \boldsymbol{e}, \end{equation}
respectively, where  $\tau =\tau ^* D_R^*$,
 $\boldsymbol {B}=\boldsymbol {B}^* D_R^*/V_C^*$ and
 $\boldsymbol{\mathsf{G}}=\boldsymbol{\mathsf{G}}^*/D_R^*=\boldsymbol {\nabla } {\boldsymbol {u}}/D_R$. As mentioned previously,
 $\tau$ in (2.10h) will be chosen appropriately later. To compute
 $\boldsymbol{\mathsf{D}}_G$, it is convenient to introduce
 ${\boldsymbol {b}}(\boldsymbol {e})=f(\boldsymbol {e})\boldsymbol {B}(\boldsymbol {e})$, which from (2.10i) satisfies the equation
 \begin{equation} \boldsymbol{\nabla}_e \boldsymbol{\cdot} \left[ \dot{\boldsymbol{e}}\boldsymbol{b}- \boldsymbol{\nabla}_e\boldsymbol{b}\right]-\boldsymbol{b} \boldsymbol{\cdot} \boldsymbol{\mathsf{G}} = ~(\boldsymbol{e}-\langle {\boldsymbol{e}} \rangle)f, \end{equation}
where  $\dot {\boldsymbol {e}}= {\dot {\boldsymbol {e}}^*} / D_R^*$. Once
 ${\boldsymbol {b}}(\boldsymbol {e})$ is obtained from (2.10j), the translational diffusivity of model G is given by the following expression:
 \begin{equation} \boldsymbol{\mathsf{D}}_G=\int_{\|\boldsymbol{e}\|=1} \left[ \boldsymbol{b}(\boldsymbol{e})\boldsymbol{e} +\frac{\boldsymbol{b}(\boldsymbol{e})\boldsymbol{b}(\boldsymbol{e})}{f(\boldsymbol{e})} \boldsymbol{\cdot} \boldsymbol{\mathsf{G}} \right]^{sym} \textrm{d}^2 \boldsymbol{e}. \end{equation}
2.4. Basic state
The basic state of (2.10) is first calculated by assuming that the velocity and cell-concentration fields are steady, axisymmetric and homogeneous along the axial direction, i.e.
 \begin{equation} \boldsymbol{u}=\boldsymbol{u_0}=(0,0,U(r)), \quad n=N(r), \quad \frac{\partial }{\partial t}=\frac{\partial }{\partial z}=\frac{\partial }{\partial \psi}=0. \end{equation}
The basic-state pressure  $P_0(r,z)$ is obtained by integrating (2.10b) in the radial direction
 \begin{equation} \frac{\partial P_0}{\partial z}=\left.\frac{2}{Re} \frac{\partial U}{\partial r}\right|_{r=1} +Ri, \end{equation}
which is composed of the pressure gradient driving the flow,
 \begin{equation} \frac{\partial P_0^d}{\partial z}=\left.\frac{2}{Re} \frac{\partial U}{\partial r}\right|_{r=1}, \end{equation}
and the hydrostatic pressure gradient balancing out the gravitational term (i.e.  $Ri$) in (2.12a).
Removal of the hydrostatic balance from (2.10) then yields the following equations for the basic state:
 \begin{gather} - r\frac{\partial P^d_0}{\partial z}+\frac{1}{Re}\frac{\partial }{\partial r} r \frac{\partial U}{\partial r}+r Ri (N-1)=0, \end{gather}
 \begin{gather}- \frac{\partial P^d_0}{\partial r}=0, \end{gather}
 \begin{gather}\frac{\partial }{\partial r}(r N \langle e_{r} \rangle_0)=\frac{1}{D_R}\frac{\partial }{\partial r}\left(r {D}_{rr,0} \frac{\partial N}{\partial r}\right). \end{gather}
With the boundary conditions
 \begin{equation} U(1) = 0, \quad \left.\left[\langle e_{r} \rangle_0 N-\frac{{D}_{rr,0}}{D_R}\frac{\partial N}{\partial r} \right] \right|_{r=1} = 0, \end{equation}
and the compatibility condition at the centre
 \begin{equation} \left. \frac{\partial U}{\partial r} \right|_{r=0} = 0, \quad \left.\frac{\partial N}{\partial r} \right|_{r=0} = 0. \end{equation}
Here, the subscript  $0$ in
 $\langle e_{r} \rangle _0$ and
 ${D}_{rr,0}$ indicates the variables from § 2.3, which are used for the calculation of the steady basic state.
Since the total number of the cells is preserved over the given control volume, we impose the normalisation condition for the cell concentration,
 \begin{equation} \int_0^1 N(r) r\,\textrm{d}r=\tfrac{1}{2}. \end{equation}
The flow rate  $Q$ is assumed to be given, such that
 \begin{equation} \int_0^1 U(r) r \,\textrm{d}r=\frac{Q}{2 {\rm \pi}}. \end{equation}
2.5. Linear stability analysis
Now, we consider a small perturbation about the basic state
 \begin{equation} \boldsymbol{u}=\boldsymbol{u_0}+\epsilon \boldsymbol{u}'+{O} (\epsilon^2), \quad p=P_0+\epsilon p'+{O} (\epsilon^2), \quad n=N+\epsilon n'+{O} (\epsilon^2), \end{equation}
where  ${\boldsymbol {u}_\textbf {0}}=(0,0,U(r))$,
 ${\boldsymbol {u}'}=(v',w',u')$ and
 $\epsilon \ll 1$. We also define
 $\boldsymbol {\varOmega }_\textbf {{0}}=\nabla \wedge {\boldsymbol {u}_\textbf {{0}}}$,
 $\boldsymbol {\varOmega }'=\boldsymbol {\nabla } \wedge {\boldsymbol {u}}'$,
 $\boldsymbol{\mathsf{G}}_\textbf {{0}}=\boldsymbol {\nabla } \boldsymbol {u}_\textbf {{0}}/D_R$ and
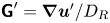 $\boldsymbol{\mathsf{G}}'=\boldsymbol {\nabla } {\boldsymbol {u}}'/D_R$ accordingly. Here, we note that the axial velocity perturbation and the cell concentration over a given control volume
 $V_0$ should satisfy
 \begin{equation} \int_{V_0} n' \,\textrm{d}V= \int_{V_0} u' \,\textrm{d}V=0, \end{equation}
as the flow rate  $Q$ is fixed and the total number of the cells over the entire domain is preserved in time. The linearised equations for the small perturbation are then given as
 \begin{gather} \frac{\partial u'}{\partial z}+\frac{1}{r}\frac{\partial rv'}{\partial r}+\frac{1}{r}\frac{\partial w'}{\partial \psi}=0, \end{gather}
 \begin{gather} \frac{\partial u'}{\partial t}+U \frac{\partial u'}{\partial z}+v' \frac{\partial U}{\partial r}=-\frac{\partial p'}{\partial z}+\frac{1}{Re}\nabla^2 u' + Ri\, n', \end{gather}
 \begin{gather} \frac{\partial v'}{\partial t}+U \frac{\partial v'}{\partial z} =-\frac{\partial p'}{\partial r}+\frac{1}{Re}\left(\nabla^2 v' - \frac{v'}{r^2} - \frac{2}{r^2}\frac{\partial w'}{\partial \psi}\right), \end{gather}
 \begin{gather} \frac{\partial w'}{\partial t}+U \frac{\partial w'}{\partial z} =-\frac{1}{r}\frac{\partial p'}{\partial \psi}+ \frac{1}{Re}\left(\nabla^2 w' - \frac{w'}{r^2} +\frac{2}{r^2}\frac{\partial v'}{\partial \psi}\right), \end{gather}
 \begin{align} & \frac{\partial n'}{\partial t} + n'\left(\frac{{\langle e_{r} \rangle}_0}{r}+\frac{\partial {\langle e_{r} \rangle}_0}{\partial r}\right)+{\langle e_{r} \rangle}_0\frac{\partial n'}{\partial r} +U \frac{\partial n'}{\partial z}+{\langle e_{z} \rangle}_0 \frac{\partial n'}{\partial z} +\frac{{\langle e_{z} \rangle}_0}{r} \frac{\partial n'}{\partial \psi} + v' \frac{\partial N}{\partial r} \nonumber\\ &\qquad + {\langle e_{r} \rangle'}\frac{\partial N}{\partial r} + N \frac{\partial {\langle e_{r} \rangle'}}{\partial r}+N \frac{\langle e_{r} \rangle'}{r}+N \frac{\partial \langle e_{z} \rangle'}{\partial z}+\frac{N}{r}\frac{\partial \langle e_{\psi} \rangle'}{\partial \psi} \nonumber\\ &\quad = \frac{1}{D_R}\left[ \frac{D_{rr}'}{r}\frac{\partial N}{\partial r}+\frac{\partial D_{rr}'}{\partial r}\frac{\partial N}{\partial r}+D_{rr}' \frac{\partial^2 N}{\partial r^2}+\frac{\partial D_{rz}'}{\partial z}\frac{\partial N}{\partial r} +\frac{1}{r}\frac{\partial D_{r\psi}'}{\partial z}\frac{\partial N}{\partial r}\right. \nonumber\\ &\qquad + \frac{1}{r} \left(D_{rr,0}\frac{\partial n'}{\partial r}+D_{rz,0}\frac{\partial n'}{\partial z}+2D_{r\psi,0}\frac{\partial^2 n'}{\partial r \partial \psi}+\frac{\partial D_{r\psi,0}}{\partial r}\frac{\partial n'}{\partial \psi}+2D_{\psi z,0}\frac{\partial ^2 n'}{\partial \psi \partial z} \right) \nonumber\\ &\qquad + \frac{\partial D_{rr,0}}{\partial r}\frac{\partial n'}{\partial r}+2\frac{\partial D_{rz,0}}{\partial r}\frac{\partial n'}{\partial z}+D_{rz,0}\frac{\partial ^2 n'}{\partial r \partial z} \nonumber\\ &\qquad + \left. D_{rr,0}\frac{\partial^2 n'}{\partial r^2}+D_{zz,0}\frac{\partial^2 n'}{\partial z^2}+\frac{1}{r^2}D_{\psi \psi,0}\frac{\partial^2 n'}{\partial \psi^2} \right], \end{align}
with the boundary conditions at the wall
 \begin{gather} u'|_{r=1} =v'|_{r=1}=w'|_{r=1}= 0, \end{gather}
 \begin{gather} N v'+ N \langle e_{r} \rangle' + n' {\langle e_{r} \rangle}_0=\frac{1}{D_R} \left(D_{rr}' \frac{\partial N}{\partial r}+D_{rr,0} \frac{\partial n'}{\partial r}+D_{rz,0}\frac{\partial n'}{\partial z}+\frac{D_{r\psi,0}}{r}\frac{\partial n'}{\partial \psi} \right). \end{gather}
Here,  $\boldsymbol{\mathsf{D}}'_m$ and
 $\langle {\boldsymbol {e}} \rangle '$ are computed by linearising (2.10d) and (2.10j) in a similar manner to Hwang & Pedley (Reference Hwang and Pedley2014a,Reference Hwang and Pedleyb). The detailed set of lengthy linearised equations can be found in appendix A.
Finally, the following normal-mode solution is introduced for linear stability analysis:
 \begin{equation} \left.\begin{array}{c@{}} {}\boldsymbol{u}'(r,\psi,z,t)=\hat{\boldsymbol{u}}(r)\exp({\textrm{i} (\alpha z+m \psi-\omega t)})+\text{c.c}, \\ p'(r,\psi,z,t)=\hat{p}(r)\exp({\textrm{i}(\alpha z+m \psi-\omega t)})+\text{c.c}, \\ n'(r,\psi,z,t)=\hat{n}(r)\exp({\textrm{i}(\alpha z+m \psi-\omega t)})+\text{c.c}, \end{array}\right\} \end{equation}
where  $\alpha$ is the real axial wavenumber,
 $m$ the wavenumber in the azithumal direction (positive integer) and
 $\omega$ the complex frequency. Substitution of the normal-mode solution into (2.18) yields an eigenvalue problem, as detailed in appendix B.
2.6. Numerical methods
To obtain the basic state from (2.13) and subsequently examine its stability,  $\langle {\boldsymbol {e}} \rangle$ and
 $\boldsymbol{\mathsf{D}}_m$ in (2.10c) need to be computed as a function of
 $\boldsymbol {\varOmega }/D_R$ (models F and G) and
 $\boldsymbol{\mathsf{G}}$ (model G): see § 2.2. The steady solution
 $f(\boldsymbol {e})$ to (2.10d) is obtained using the solver identical to that of Hwang & Pedley (Reference Hwang and Pedley2014a), and the reader may refer to § 3 in Hwang & Pedley (Reference Hwang and Pedley2014a) for the detailed result on
 $\langle {\boldsymbol {e}} \rangle$ and
 $\boldsymbol{\mathsf{D}}_F$. As for model G, the mean swimming orientation vector
 $\langle {\boldsymbol {e}} \rangle$ is the same as the one for model F. Therefore, only
 $\boldsymbol{\mathsf{D}}_G$ used for model G needs to be obtained. With the same discretisation schemes and resolution used for (2.10d) in Hwang & Pedley (Reference Hwang and Pedley2014a), (2.10j) and (2.10k) are solved to obtain
 $\boldsymbol{\mathsf{D}}_G$. The numerical results agree very well with the ones given by Bearon et al. (Reference Bearon, Bees and Croze2012). Similarly,
 $\langle {\boldsymbol {e}} \rangle '$ and
 $\boldsymbol{\mathsf{D}}_m'$ used in (2.18e) are calculated by applying the same discretisation schemes to the equations in appendix A.
In order to compute the basic state, the radial direction of (2.13) is discretised using a Chebyshev collocation method described in Weideman & Reddy (Reference Weideman and Reddy2000). Two solvers have been written in MATLAB: one is based on a Newton–Ralphson method, and the other solves the unsteady version of (2.13) to obtain its steady solution, the latter of which is used to study the stability of the basic state to axially uniform and radially independent perturbation. The solutions from the two solvers have been validated against each other when stable solutions are admitted. They are found to be identical up to the given numerical precision. Finally, for the purpose of studying bifurcation of the basic state, the Newton–Raphson solver is combined with a pseudo-arclength continuation algorithm (see § 3).
For the linear stability, the radial direction of (B 2) is discretised using the same discretisation method as the one for the basic state. The discretised eigenvalue problem is solved using the function eig in MATLAB. The computation is performed with  $N_r=175$, showing no difference from the results with
 $N_r=100$. The computed eigenvalues for
 ${Ri}=0$ are validated against pipe flow stability data of Schmid & Henningson (Reference Schmid and Henningson1994), Schmid & Henningson (Reference Schmid and Henningson2001) and Meseguer & Trefethen (Reference Meseguer and Trefethen2003) with excellent agreement.
2.7. Parameters
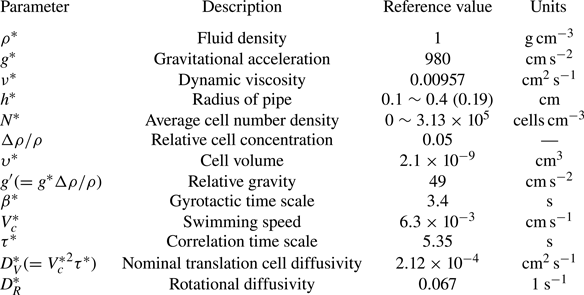
A list of parameters and their values used in the present study are summarised in table 1. Here, it should be noted that  $\tau ^*$ is not a free parameter, as mentioned in § 2.2. Instead,
 $\tau ^*$ is set, such that models F and G provide consistent and quantitatively comparable results. Therefore, in the present study we follow the approach of Bearon et al. (Reference Bearon, Bees and Croze2012), in which
 $\tau ^*$ is chosen to match
 $D_{G,rr}$ with
 $D_{F,rr}$ in the absence of any flow (i.e. stationary medium). This gives
 $\tau =0.36$, consistent with that of Bearon et al. (Reference Bearon, Bees and Croze2012).
Parameters and their reference values in the present study. Most of the parameters for the cell properties are taken from the data for C. Nivalis (Pedley & Kessler Reference Pedley and Kessler1990; Bees & Hill Reference Bees and Hill1998; Pedley Reference Pedley2010b).

In this study the radius of the cylindrical pipe is chosen to be around  $0.2$ cm, so that we obtain results comparable with the same as Hwang & Pedley (Reference Hwang and Pedley2014b), at around
 $0.2$ cm. The parameters for the cell's biological properties, including cell swimming speed
 $V_c^*$, gyrotactic time scale
 $\beta ^*$, relative cell density
 ${\rm \Delta} \rho / \rho$ and rotational diffusivity
 $D_R^*$, are taken for C. nivalis from previous studies (e.g. Pedley & Kessler Reference Pedley and Kessler1990; Bees & Hill Reference Bees and Hill1998; Pedley Reference Pedley2010b; Hwang & Pedley Reference Hwang and Pedley2014b), except the shape of the cell which we assume to be spherical. As in the linear stability analysis of Hwang & Pedley (Reference Hwang and Pedley2014b) and the experiment of Croze et al. (Reference Croze, Bearon and Bees2017), only the flow rate
 $Q$ and the background cell concentration (represented by
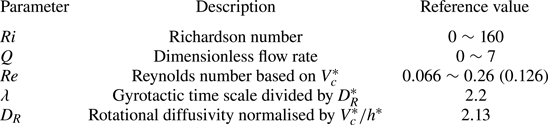
 $Ri$) are varied in this study. Based on the parameter values given in table 1, the dimensionless parameters and their values examined are given in table 2.
Dimensionless parameters and their values in the present study.

3. Basic state
3.1. Very low flow rate
At very low flow rate (i.e.  $Q \rightarrow 0$), models F and G share the same asymptotic value for
 $\langle {\boldsymbol {e}} \rangle$ and the radial diagonal component of
 $\boldsymbol{\mathsf{D}}_m$ (see Bearon et al. (Reference Bearon, Bees and Croze2012) and figure 7). Therefore, the two models would give almost identical results when
 $Q$ is small enough. Hence, here we report the result from model G first in this case.
When  $Q=0$, a stationary uniform suspension (i.e.
 $U(r)=0$ and
 $N(r)=1$) is a solution to (2.13). However, a further numerical search has also found that there exists another solution at
 $Q=0$ featured with non-trivial
 $U(r)$ and
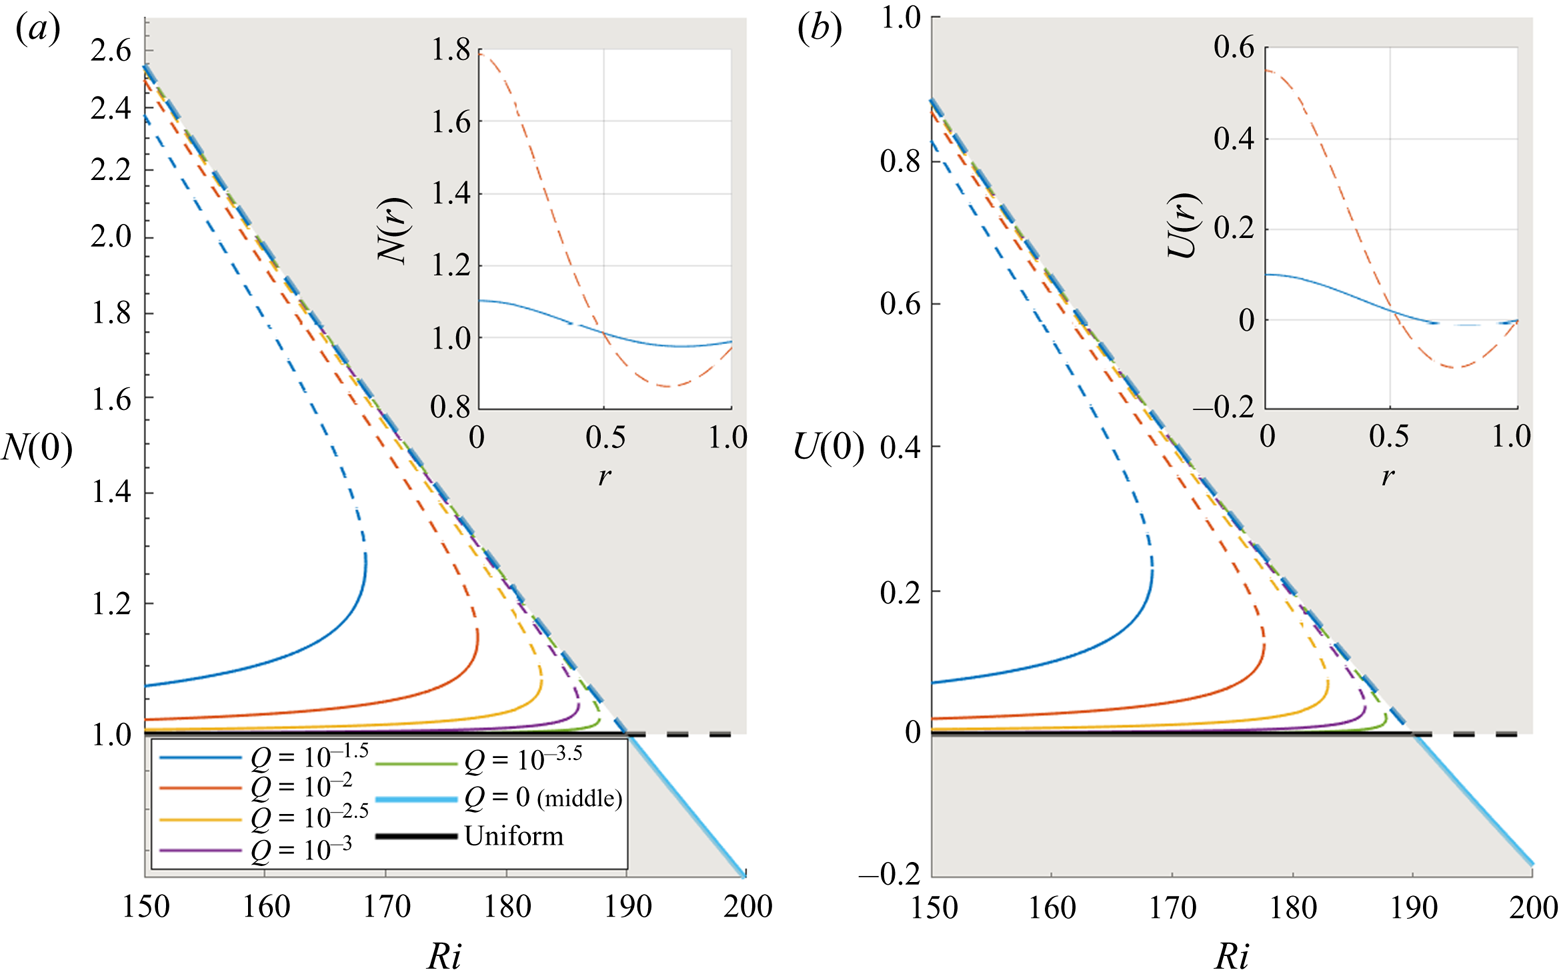
 $N(r)$, consistent with Bees & Croze (Reference Bees and Croze2010). Bifurcation diagrams of these two solutions with respect to
 $Ri$ are shown for small positive
 $Q$ in figure 2, where the centreline concentration
 $N(0)$ and axial velocity
 $U(0)$ are used to represent the state of the steady solutions. For
 $Q=0$, the two solutions meet at
 $Ri= Ri_c({\simeq }189.9)$, and their stability has been checked using the unsteady solver described in § 2.6. The stationary solution (
 $U(r)=0$ and
 $N(r)=1$) is found to be stable for
 $Ri<Ri_c$, but becomes unstable for
 $Ri>Ri_c$. On the other hand, the non-trivial solution, featured with a downflow and a high cell concentration along the pipe axis, is unstable for
 $Ri<Ri_c$. This solution gains its stability when
 $Ri>Ri_c$, and the form of the solution is subsequently changed with an upflow and a lower cell concentration along the pipe axis. The interchange of the stability of the two solutions at
 $Ri=Ri_c$ indicates that the stationary suspension in the vertical pipe experiences a transcritical bifurcation with
 $Ri$.
Bifurcation of steady solutions with  $Ri$ at very low flow rate:
 $(a)$ the cell concentration
 $N(0)$ and
 $(b)$ the centreline velocity
 $U(0)$ along the pipe axis. Here,
 , stable; - - - -, unstable. The grey area indicates where
 $Q<0$ contours would be. The insets show
 $N(r)$ and
 $U(r)$ at
 $Ri=160$: blue
 , the lower branch; red - - - -, the middle branch. Note that as
 $Q \rightarrow 0$, the results from models F and G coincide.

When a small downflow ( $Q>0$) is applied, the transcritical bifurcation point given at zero flow rate turns into a saddle-node point. At
 $Ri>Ri_c$, the axial velocity is upward instead of downward (i.e.
 $U(0)<0$), even though the overall net flow is downward (
 $Q>0$). If a small upflow (
 $Q<0$) is applied instead then the opposite is true, as shown by the grey area in figure 2. The transition from a transcritical to a saddle-node bifurcation is a consequence of an imperfect bifurcation caused by the addition of a small non-zero flow rate. This behaviour of the solutions with two parameters,
 $Ri$ and
 $Q$, can be understood within the framework of codimension two bifurcation (i.e. bifurcation with two parameters). The overall bifurcation is also closely related to how the system would evolve with the flow direction. However, given the scope of the present study, we shall only focus on the downflowing case and leave the upflowing case as future work.
3.2. Model F
The solution featured with  $N(0)>1$ and
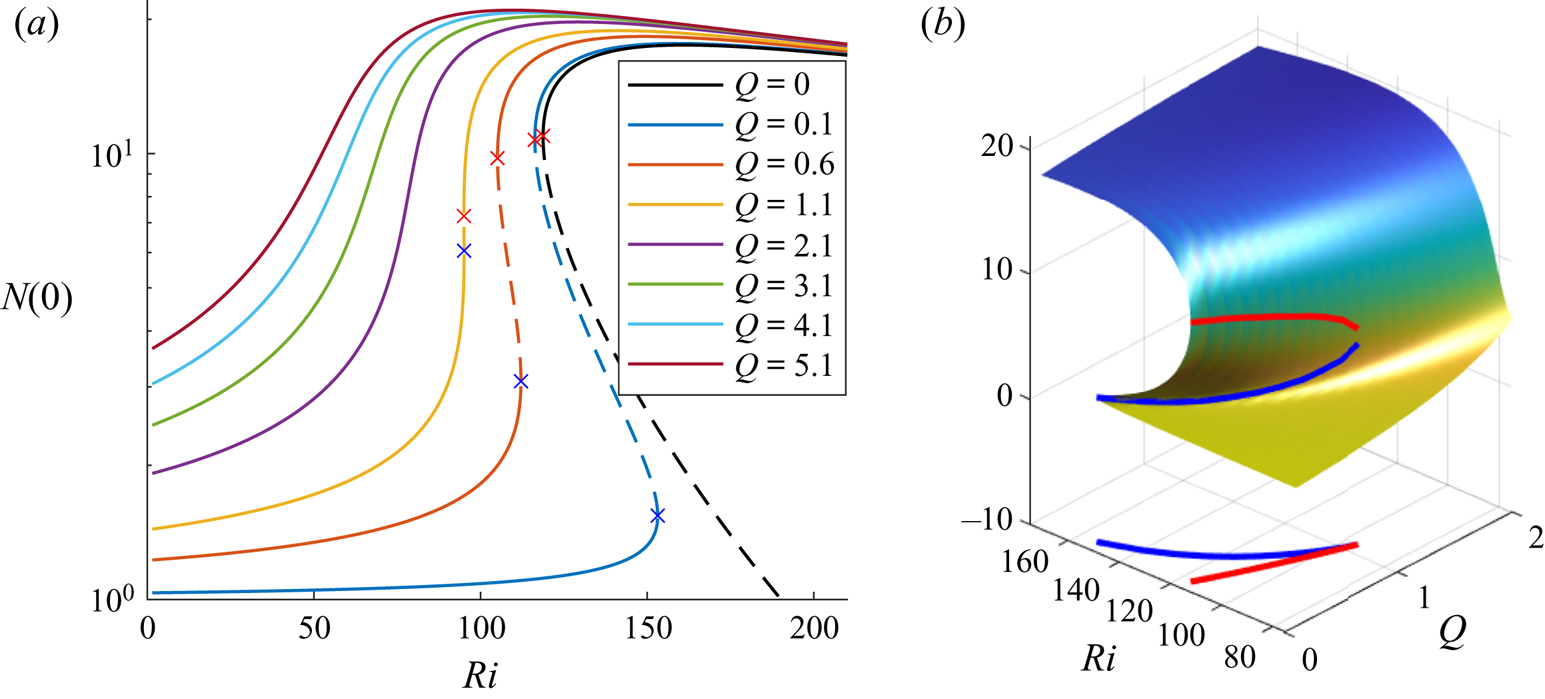
 $U(0)>0$ in figure 2 is further continued for much higher flow rates with model F. Figure 3(a) shows the result from such continuation with model F, in which the concentration at the pipe axis
 $N(0)$ is used to represent the state of the corresponding steady solution. At sufficiently low flow rate (
 $Q\lesssim 1$), the bifurcation of the solutions featured with two saddle-node points (highlighted by the crosses in figure 3a) indicate the emergence of three solutions at the given flow rate. With the increasing order of
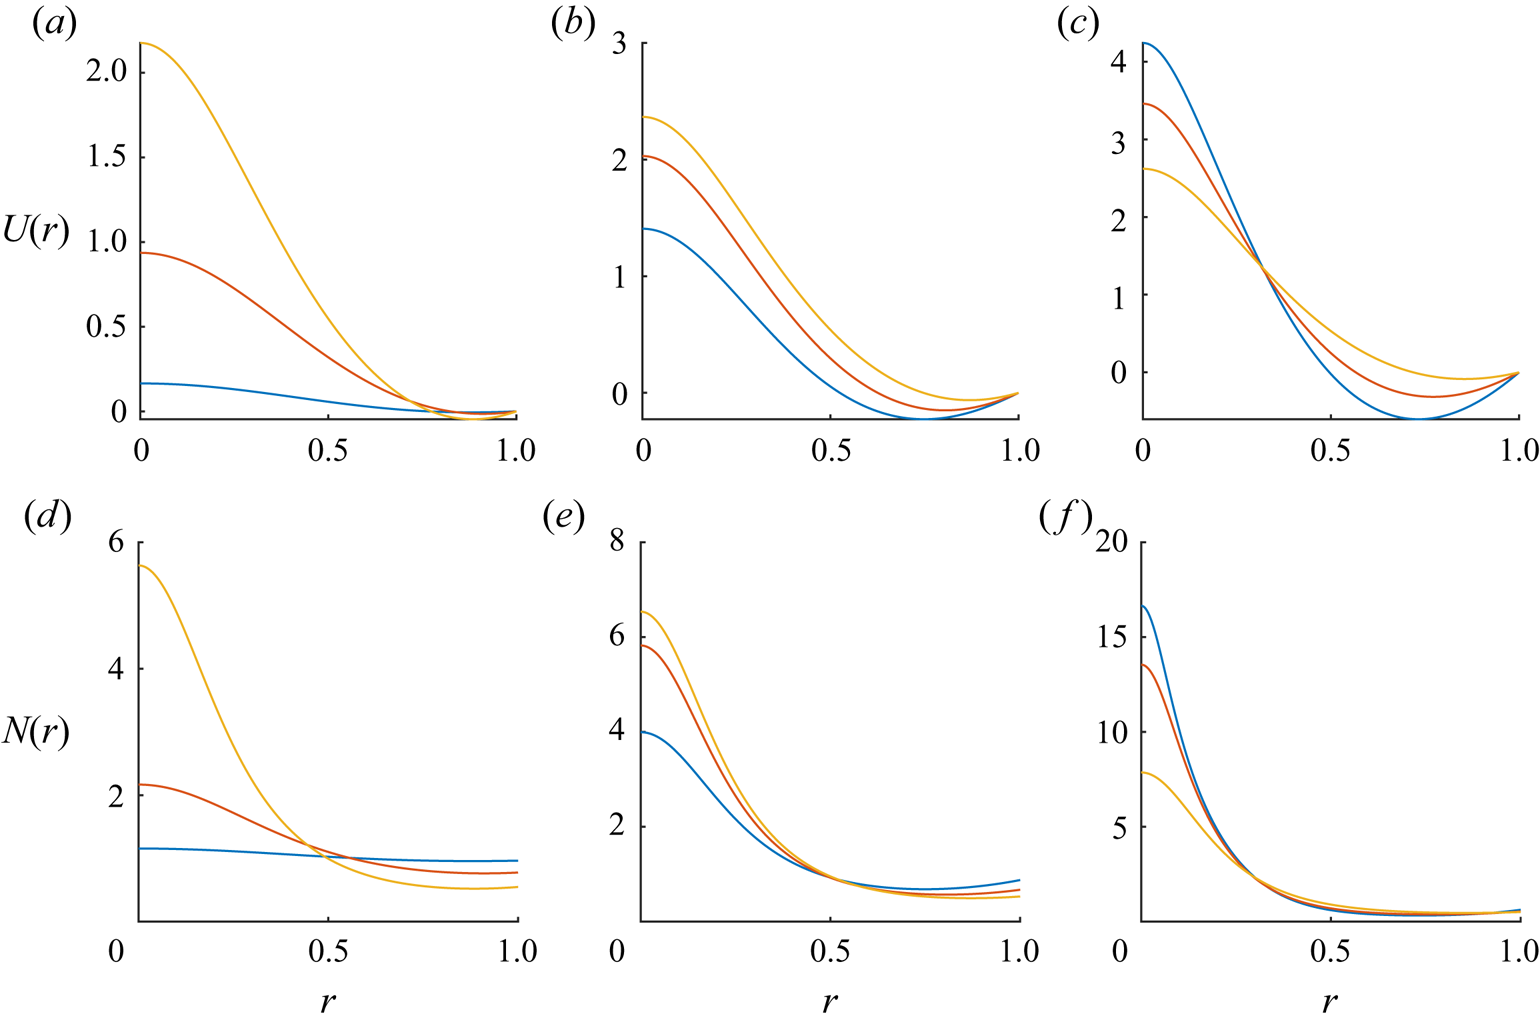
 $N(0)$, the three types of solutions will be denoted by lower, middle and upper branches, respectively, and they are visualised in figure 4. Here, we note that
 $N(0)$ was found to uniquely represent each solution per parameter set, and hence was used as a representation for each solution. In general, as the solution is continued from the lower to upper branch, both the velocity and cell-concentration profiles near the pipe axis (
 $r=0$) tend to be sharper. This is expected because the lower branch state is a homotopy of the uniform suspension obtained with increasing flow rate (i.e. state without gyrotactic instability), while the middle and upper branch states are homotopy of nonlinearly developed plumes from the gyrotatic instability at zero flow rate (i.e. state with nonlinearly saturated gyrotactic instability). Examination of the stability of each solution to axially and radially uniform perturbations (i.e. unsteady calculation of the basic state) reveals that the lower and upper branches are stable, whereas the middle one is unstable, indicating the bistable nature of the basic state featured with hysteresis.
Bifurcation of the steady solutions at high flow rates (model F):  $(a)$
 $N(0)$ with respect to
 $Ri$ for several flow rates
 $Q$;
 $(b)$ surface plot of
 $N(0)$ in the
 $Q\text {--}Ri$ space. In
 $(a)$,
 , stable; - - - -, unstable. The blue cross (x) indicates the first saddle-node point where lower and middle branches meet, while the red cross (x) indicates the second saddle-node point where middle and upper branches meet. In
 $(b)$ the blue and red curves indicate the trajectories of the two saddle-node points with change in
 $Q$, respectively. The graph at the bottom shows the projection of the trajectories onto the
 $Q\text {--}Ri$ plane.

Downward velocity  $U(r)$ (a–c) and cell concentration
 $N(r)$ (d–f) profiles of the steady basic states at (blue)
 $Q=0.1;Ri=132$, (red)
 $Q=0.6;Ri=108$ and (yellow)
 $Q=1.1;Ri=95.04$ (model F). Here, the left, middle and right columns represent the lower, middle and upper branch solutions, respectively.

As the flow rate  $Q$ is further increased, the two saddle-node points become closer. They eventually merge and disappear with the increasing
 $Q$. The curves in figure 3(b) show how the two saddle-node points evolved with
 $Q$ in the
 $Q\text {--}Ri\text {--}N(0)$ space. At the bottom of this figure, the trajectories of the two saddle-node points are projected onto the
 $Q\text {--}Ri$ plane to visualise how the
 $Ri$ values at these points change with
 $Q$. The two saddle-node points in the
 $Q\text {--}Ri$ plane indeed merge as
 $Q$ increases. Beyond this merging point, the bistable behaviour of the steady solutions disappears, as there exits only a single steady solution. This type of codimension two bifurcation is a cusp bifurcation (see Zeeman Reference Zeeman1976; Thom Reference Thom1989). Further discussion on the bifurcation in relation to previous experimental observations will be given in § 5.3.
Lastly, it is worth mentioning that, in model F, the density at the pipe axis  $N(0)$ decreases with increasing
 $Ri$ for sufficiently large
 $Ri$ (see the upper branch in figure 3a). As discussed in Hwang & Pedley (Reference Hwang and Pedley2014b), the decrease of
 $N(0)$ is the direct consequence of increasing
 $D_{rr}$ with the increase of background base-flow shear (see figure 7b of this paper and figure 3b of Hwang & Pedley Reference Hwang and Pedley2014b), which smooths out the gyrotactic focusing near the pipe axis.
3.3. Model G
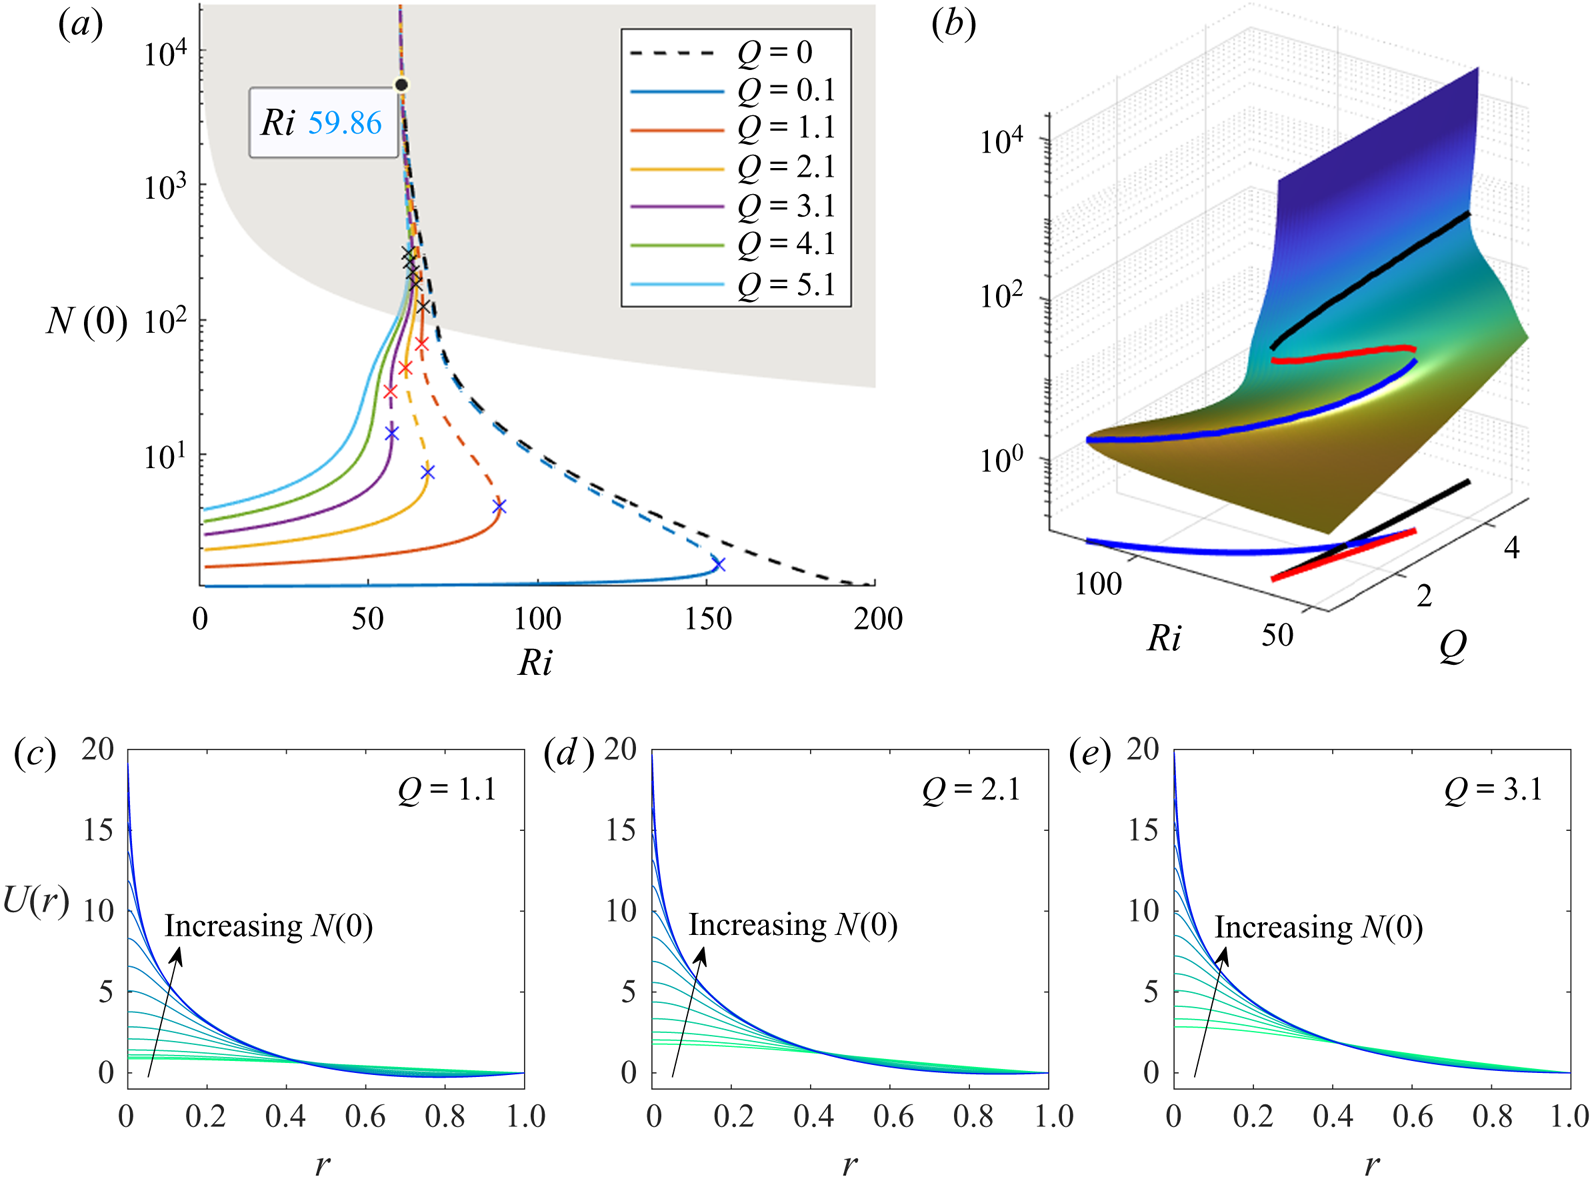
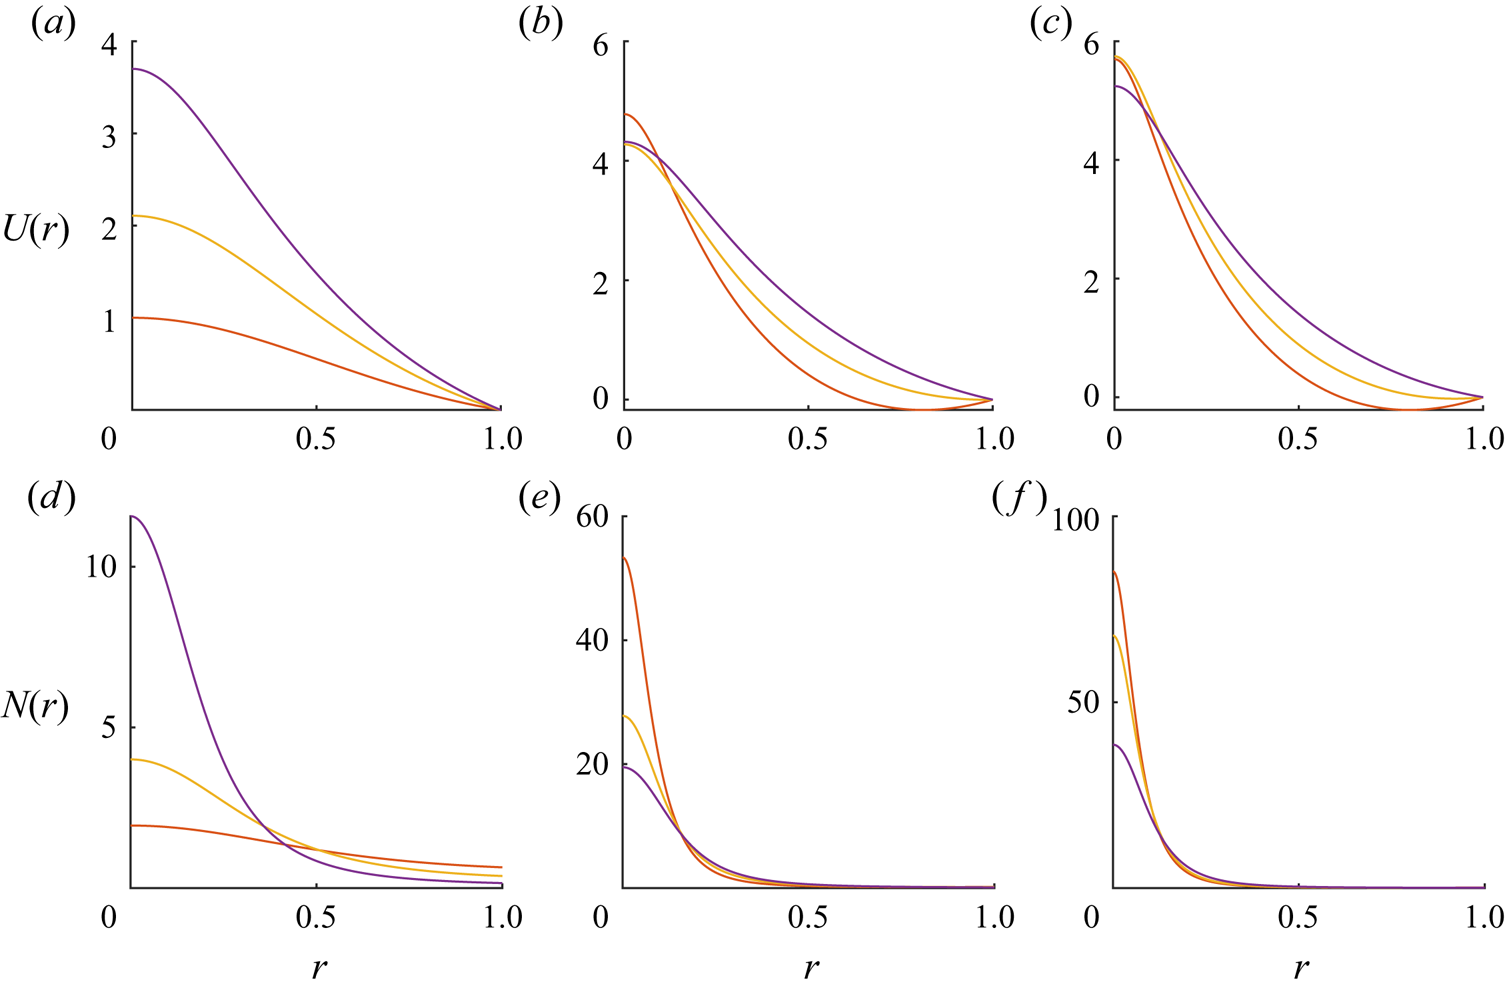
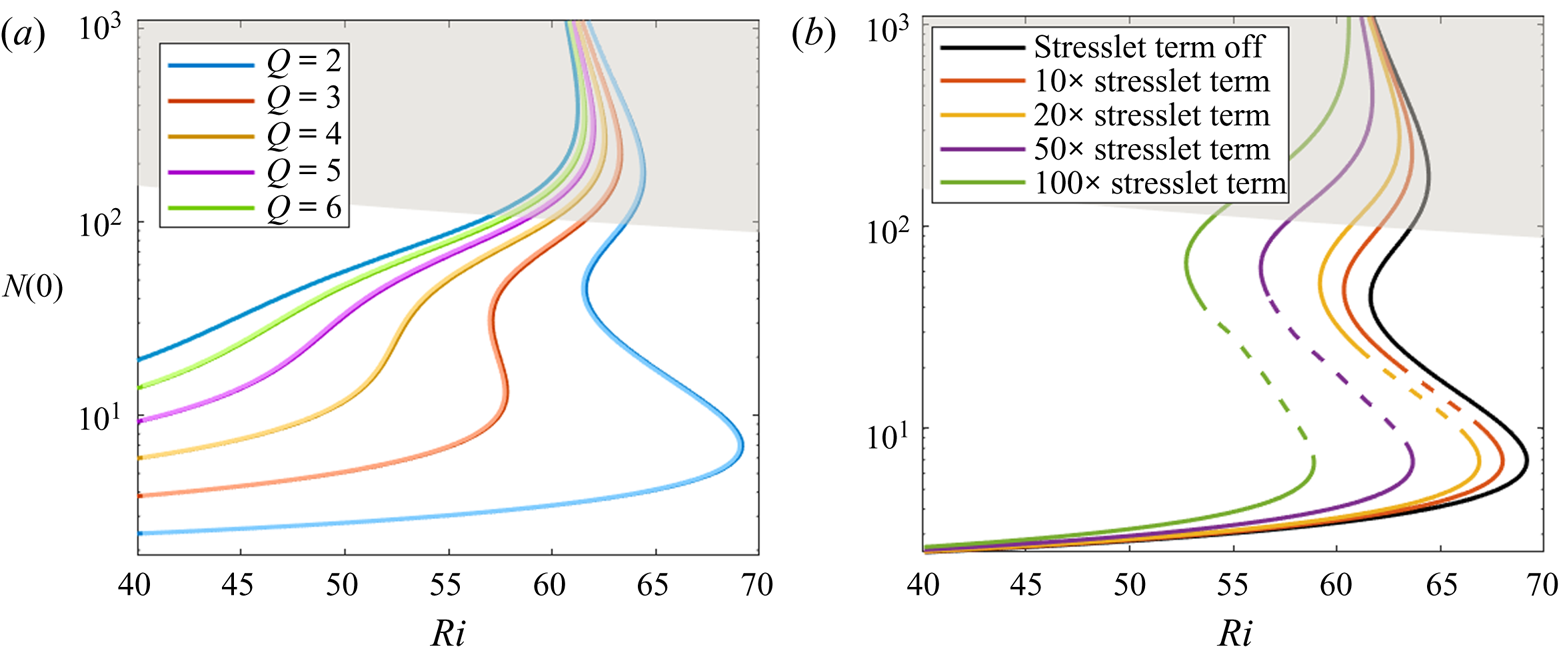
Now, we compare the steady basic-state solutions obtained from model F to those from model G. Figure 5(a) shows the bifurcation diagram of the steady solution obtained using model G. When the cell concentration at the pipe axis is relatively small (i.e.  $N(0)<10^2$), the same kind of cusp bifurcation is seen in this case (compare with figure 3a). Also, the related form of the steady solutions is qualitatively identical to that obtained with model F, as shown in figure 6. However, as the solution is continued further from the middle branches, its behaviour turns out to be very different from that obtained with model F. In particular, for all the flow rates considered, the bifurcation curves do not properly form the upper branches, contrary to model F (compare with figure 3b). Indeed, irrespective of the flow rate
 $Q$, the continued solution from the middle branch asymptotically exhibits a singular behaviour at
 $Ri=Ri_{s}({\simeq }59.86)$ in figure 5a), implying
 $N(0) \rightarrow \infty$ with the continuation. This suggests that a steady downflowing upper branch solution may not necessarily exist for
 $Ri>Ri_{s}$.
Bifurcation of the steady solutions at high flow rates (model G):  $(a)$
 $N(0)$ with respect to
 $Ri$ for several flow rates
 $Q$;
 $(b)$ surface plot of
 $N(0)$ in the
 $Q\text {--}Ri$ space. In
 $(a)$,
 , stable; - - - -, unstable. Here, the blue, red and black crosses (x) indicate the first, second and third saddle-node points, respectively, as the solution is continued from the lower to the upper branch. The grey area indicates the cases where the volume fraction at the pipe axis is greater than
 $2.5\,\%$ (see § 5.2). Note that all curves asymptotically approach a vertical line that corresponds to
 $Ri_{s}\simeq 59.86$. In
 $(b)$ the blue and red curves indicate the trajectories of the two saddle-node points with change in
 $Q$, respectively. The graph at the bottom shows the projection of the trajectories onto the
 $Q\text {--}Ri$ plane. (c–e) Velocity profile
 $U(r)$ of the steady solutions along the continuation from
 $Ri=50$ to the singularity at each
 $Q$. The colour of the lines changes from green to blue, representing increasing
 $N(0)$ along the continuation.

Downward velocity  $U(r)$ (a–c) and cell concentration
 $N(r)$ (d–f) profiles of the steady basic states at (red)
 $Q=1.1;Ri=65.9$, (yellow)
 $Q=2.1;Ri=62$ and (purple)
 $Q=3.1;Ri=56.9$ (model G). Here, the left, middle and right columns represent the lower, middle and upper branch solutions, respectively.

The origin of the singularity in the steady solution can be further studied from the following explicit form of  $N(r)$ obtained with (2.13c) and (2.13d) (Bees & Croze Reference Bees and Croze2010):
 \begin{equation} N(r)= N(0) \exp \left(D_R \int_0^r \frac{\langle e_{r} \rangle_0}{D_{rr,0}} \,\textrm{d}r\right). \end{equation}
This form of the solution indicates that the singularity would be directly related to the behaviour of  $\langle e_{r} \rangle _0/D_{rr,0}$ with prescribed background shear
 $S(\equiv -1/D_R\,\textrm {d}U/\textrm {d}r)$. Note that
 $S$ is varying with the radial position
 $r$ (figure 8) because of the coupling via the negative buoyancy. In effect,
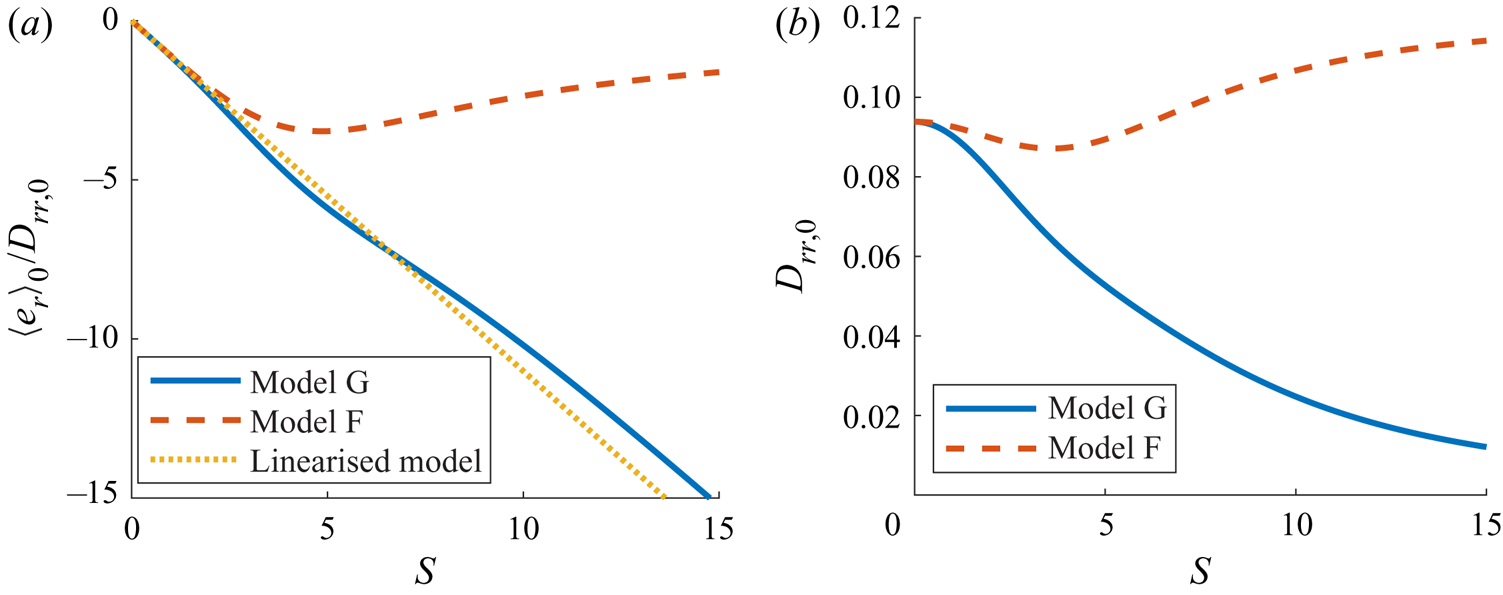
 $S(r)$ can also be interpreted as the local rotary Péclet number. Figure 7(a) shows the behaviour of
 $\langle e_{r} \rangle _0/D_{rr,0}$ with the background shear
 $S$ for both models F and G (see also figure 1 f in Bearon et al. Reference Bearon, Bees and Croze2012). For model F, the values of
 $\langle e_{r} \rangle _0/D_{rr,0}$ are bounded between a relatively small negative value (
 $\min (\langle e_{r} \rangle _0/D_{rr,0})=-3.47$) and zero for all the values of
 $S$. However, in the case of model G,
 $\langle e_{r} \rangle _0/D_{rr,0}$ monotonically decreases with
 $S$ and is roughly linearly proportional to
 $S$ for sufficiently large
 $S$ (figure 7a). It should be mentioned that this difference in
 $\langle e_{r} \rangle _0/D_{rr,0}$ between models F and G must originate from the difference in the translational diffusivity, because they share exactly the same
 $\langle e_{r} \rangle$ (see also § 2). This is shown in figure 7(b).
Averaged radial swimming velocity and radial diagonal component of diffusivity tensor with the dimensionless shear rate,  $S=-{D_R}^{-1}{\textrm {d}U}/{\textrm {d}r}$ (see also figure 1 in Bearon et al. Reference Bearon, Bees and Croze2012): (a)
 $\langle e_{r} \rangle _0/D_{rr,0}$; (b)
 $D_{rr,0}$. Here, - - - -, model F;
 , model G. In
 $(a)$,
 $\cdots \cdots$, linearised model (see (3.2)).

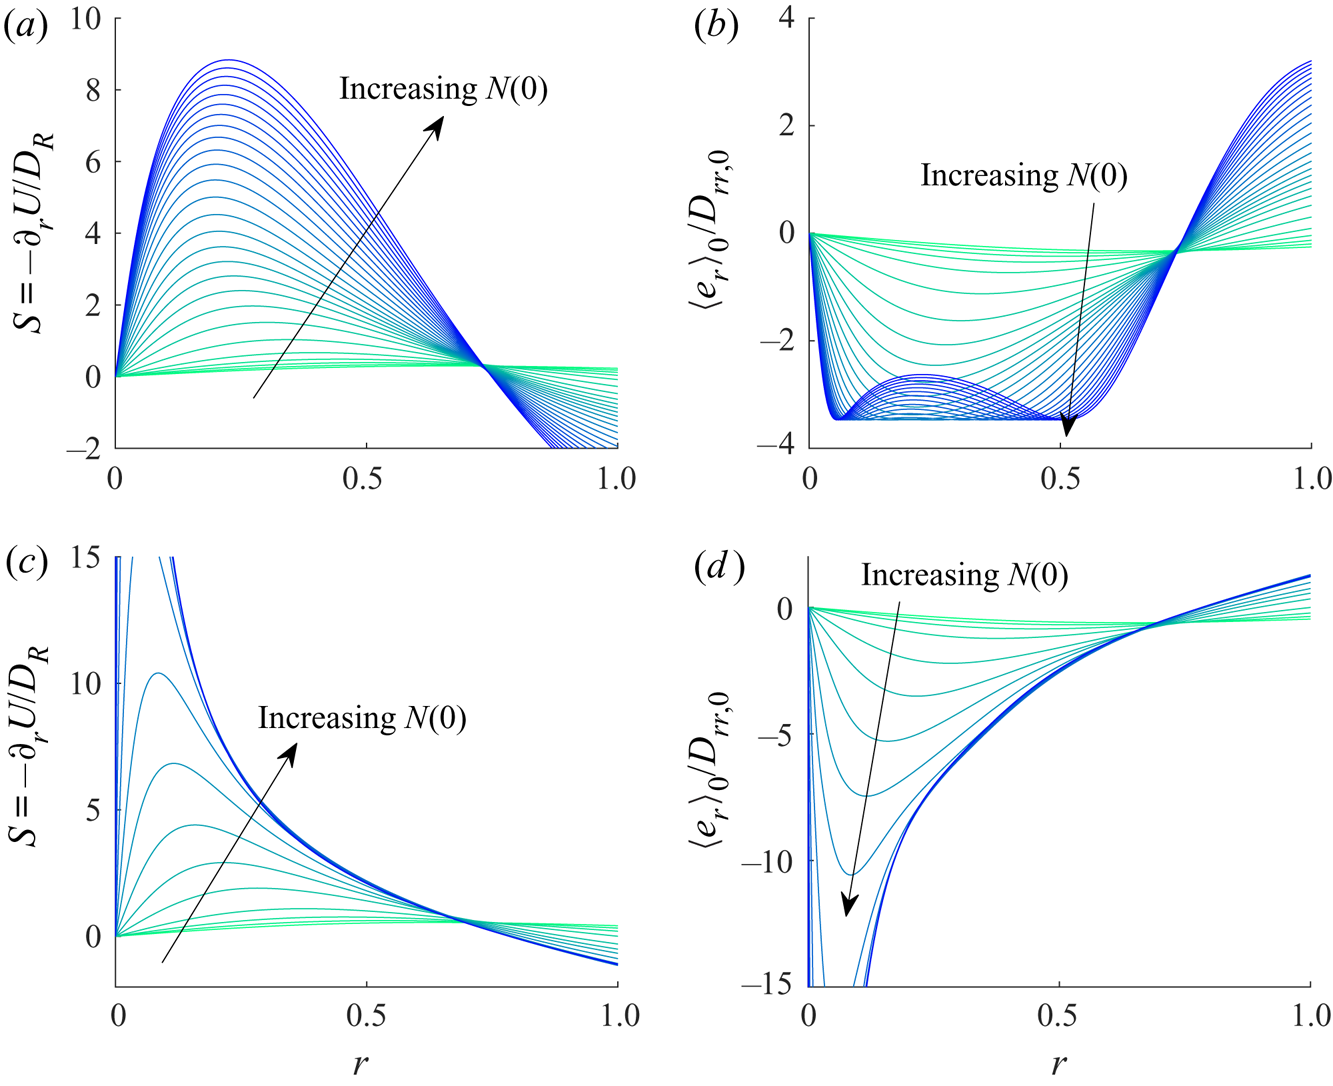
Figure 8(a) visualises the radial profiles of  $S(r)$ and
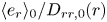 $\langle e_{r} \rangle _0/D_{rr,0}(r)$ for models F and G along the continuation curves at
 $Q=2.1$. As the solution is continued from the lower to the upper branch, the absolute values of
 $S(r)$ monotonically increase for both model F and model G (figure 8a,b). However,
 $\langle e_{r} \rangle _0/D_{rr,0}(r)$ do not behave like
 $S(r)$. In particular,
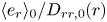 $\langle e_{r} \rangle _0/D_{rr,0}(r)$ for model F is bounded due to the nature shown in figure 7(a). As a result,
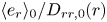 $\langle e_{r} \rangle _0/D_{rr,0}(r)$ in figure 8(b) is bounded, whereas that in figure 8(d) is not. This suggests that the singularity developed at
 $Ri_s$ from model G originates from the unboundedness of
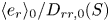 $\langle e_{r} \rangle _0/D_{rr,0}(S)$.
(a,c) Rotary Péclet number  $S(r)$ and (b,d) net-flux-diffusion ratio
 $\langle e_{r} \rangle _0/D_{rr,0}$ against radial position
 $r$ along the continuation at
 $Q=2.1$ in (a,b) model F and (c,d) model G.

If the behaviour of  $\langle e_{r} \rangle _0/D_{rr,0}$ in model G is further simplified, the
 $Ri_s$ in figure 5(b) can be predicted analytically. For this purpose, we consider a simplified model for
 $\langle e_{r} \rangle _0/D_{rr,0}$, in which the translational diffusivity is set such that
 $\langle e_{r} \rangle _0/D_{rr,0}$ is linearly proportional to the background shear
 $\textrm {d}U/\textrm {d}r$:
 \begin{equation} D_{rr,0}= -\frac{\langle e_{r} \rangle_0 D_R}{\eta}\left (\frac{\textrm{d}U}{\textrm{d}r} \right)^{-1}{=\frac{\langle e_{r} \rangle_0}{\eta S}}. \end{equation}
In this model,  $\langle e_{r} \rangle _0$ is kept to be the same as that used in both model F and model G, and
 $\eta$ is obtained from the slope of
 $\langle e_{r} \rangle _0/D_{rr,0}$ for
 $S=0$, i.e.
 $\eta \equiv -\partial (\langle e_{r} \rangle _0/D_{rr,0})/\partial S|_{S=0}$. The behaviour of this simplified model is shown in figure 7(a), in which
 $\langle e_{r} \rangle _0/D_{rr,0}$ of this model behaves similarly to that of model G with
 $\eta =1.10$. We shall refer to this model as the ‘linearised model’.
Coincidentally, the behaviour of  $\langle e_{r} \rangle _0/D_{rr,0}$ against
 $S$ in this ‘linearised model’ is the same as that of Kessler (Reference Kessler1986a). In Kessler (Reference Kessler1986a),
 $\langle e_{r} \rangle _0$ is linear to shear rate
 $S$ and
 $D_{rr,0}$ is constant. In contrast, in both model G and the subsequent ‘linearised model’,
 $D_{rr,0} \sim S^{-2}$ and
 $\langle e_{r} \rangle _0 \sim S^{-1}$ as
 $S$ increases towards infinity. As a result, the ‘linearised model’ shares the same linear behaviour in
 $\langle e_{r} \rangle _0/D_{rr,0}(S)$ with the simpler model of Kessler (Reference Kessler1986a), even though their approximations for
 $\langle e_{r} \rangle _0$ and
 $D_{rr,0}$ respectively are different. In the following, we will exploit the similarity in
 $\langle e_{r} \rangle _0/D_{rr,0}(S)$ between the ‘linearised model’ and Kessler (Reference Kessler1986a) to understand the bifurcation.
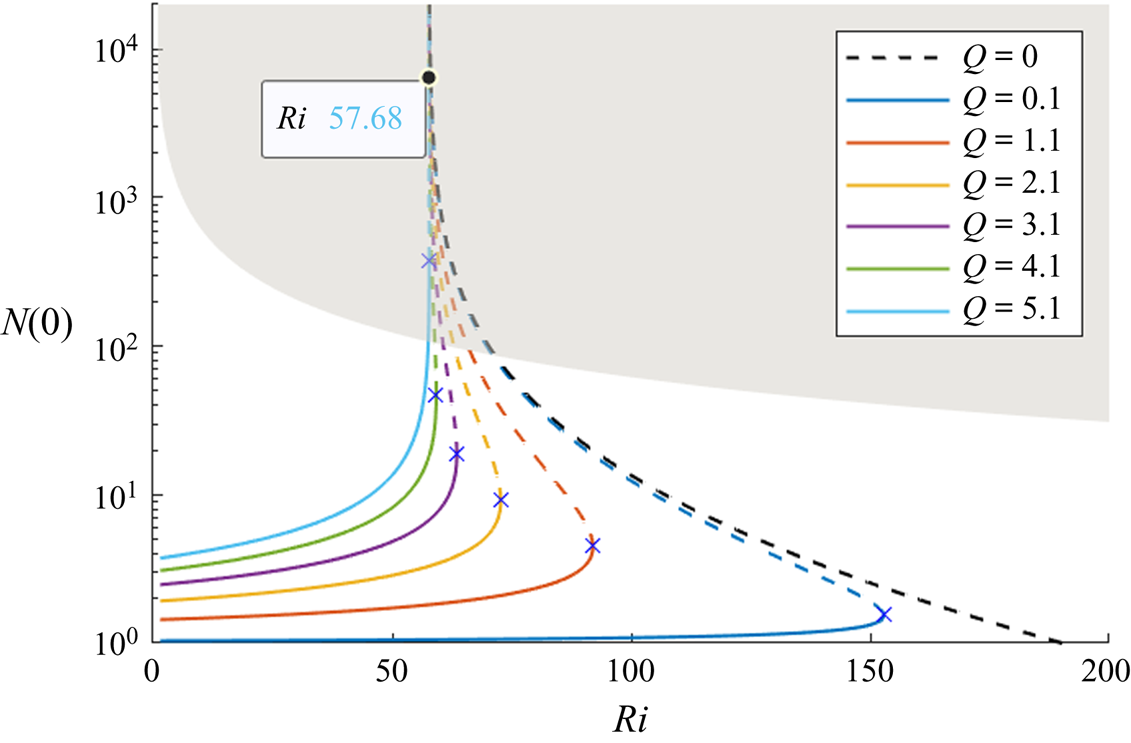
Bifurcation of the steady solutions of the linearised model is shown in figure 9 for  $\eta =1.10$. The bifurcation diagram of the linearised model confirms the behaviour qualitatively similar to that of model G: as the solution is continued from the lower to upper branch, the cell concentration at the pipe axis gradually becomes singular at
 $Ri\simeq Ri_s({=}57.68)$ irrespective of
 $Q$ (compare with figure 5a). The only qualitative difference between figures 5(a) and 9 is the small extra bumpy behaviour in the bifurcation curves of model G, likely the consequence of the nonlinear behaviour of
 $\langle e_{r} \rangle _0/D_{rr,0}$ in this model. This suggests that the singularity at the centreline cell concentration in model G indeed originates from the monotonically decreasing
 $\langle e_{r} \rangle _0/D_{rr,0}$ with the background shear rate
 $S$. In fact, as
 $S \rightarrow \infty$,
 $\langle e_{r} \rangle _0$ scales with
 $S^{-1}$ while
 $D_{rr,0}$ scales with
 $S^{-2}$, hence,
 $\langle e_{r} \rangle _0/D_{rr,0}$ scales with
 $S$ (Bearon et al. Reference Bearon, Bees and Croze2012). This implies that the origin of the singularity in
 $N(0)$ is essentially associated with the lack of translational diffusion flux relative to the advection flux caused by swimming in the radial direction in model G, as the local shear rate
 $S$ increases with
 $N(0)$ towards infinity along the continuation.
Bifurcation diagram of the linearised model with  $Ri$ for several
 $Q$. Here, the state of steady solution is represented by the cell concentration at the pipe axis
 $N(0)$. As the solution is continued from the lower branch,
 $N(0) \rightarrow \infty$ at
 $Ri=Ri_s({\simeq }57.68)$. Also,
 , stable; - - - -, unstable, and the blue crosses (x) indicate the saddle-node point. The grey area indicates the cases where the volume fraction at the pipe axis is greater than
 $2.5\,\%$ (see § 5.2).

The emergence of this singularity can be more precisely analysed. We now consider the following equation for  $N(r)$, which can be obtained from (2.13) with
 $D_{rr,0}$ in (3.2) of the linearised model:
 \begin{equation} -\frac{1}{r}\frac{\textrm{d}}{\textrm{d}r}\left(r\frac{\textrm{d}}{\textrm{d}r} \ln{N(r)}\right)=8 \gamma (N(r)-1) - G. \end{equation}
Here 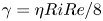 $\gamma ={\eta RiRe}/8$ and
 $G= \eta \partial U/\partial r|_{r=1}$. Since
 $N(r)$ near the singular regime is highly concentrated near the pipe axis, we assume that the cell concentration is highly focused in a small region around the axis, i.e.
 $r\in [0,\epsilon ]$. Then, from the constraint of
 $N(r)$ given by (2.14),
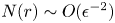 $N(r) \sim O(\epsilon ^{-2})$ in
 $r\in [0,\epsilon ]$. Therefore, in this region, we can introduce a relevant rescaling of the radial coordinate
 $r=\epsilon R$, where
 $R$ is of order unity, and define a normalised profile
 $N_0(R)=N(r/\epsilon )/N(0)$. Then, at
 $O(\epsilon ^{-2})$, (3.3) is approximated as
 \begin{equation} \left(\frac{1}{N_0}\frac{\textrm{d}N_0}{\textrm{d}R}\right)^2- \frac{1}{RN_0}\frac{\textrm{d}N_0}{\textrm{d}R}-\frac{1}{N_0}\frac{\textrm{d}^2N_0}{\textrm{d}R^2}= {8\gamma} N_0(R). \end{equation}
Now, it is evident that (3.4) does not contain  $G$ anymore, although it still describes the behaviour of most of the cell concentration in the suspension. This implies that, in the regime where the singular solution nearly develops, the form of the steady basic-state solution should approximately be independent of pressure gradient as well as of flow rate for
 $r\in [0,\epsilon ]$, confirming the numerical result for
 $N(0)>O(10^3)$ shown in figure 9.
The solution to (3.4) was previously obtained by Kessler (Reference Kessler1986a) with the far field boundary condition  $N_0(\infty )=0$, i.e.
 \begin{equation} N_0(R)=\frac{1}{(1+\gamma R^2)^2}. \end{equation}
We note that (3.4) is the leading-order approximation of (3.3) valid only for  $R\in [0,1]$ (or, equivalently,
 $r\in [0,\epsilon ]$). Therefore, (3.5) would be a good approximation of the full numerical solution of (3.3) for any
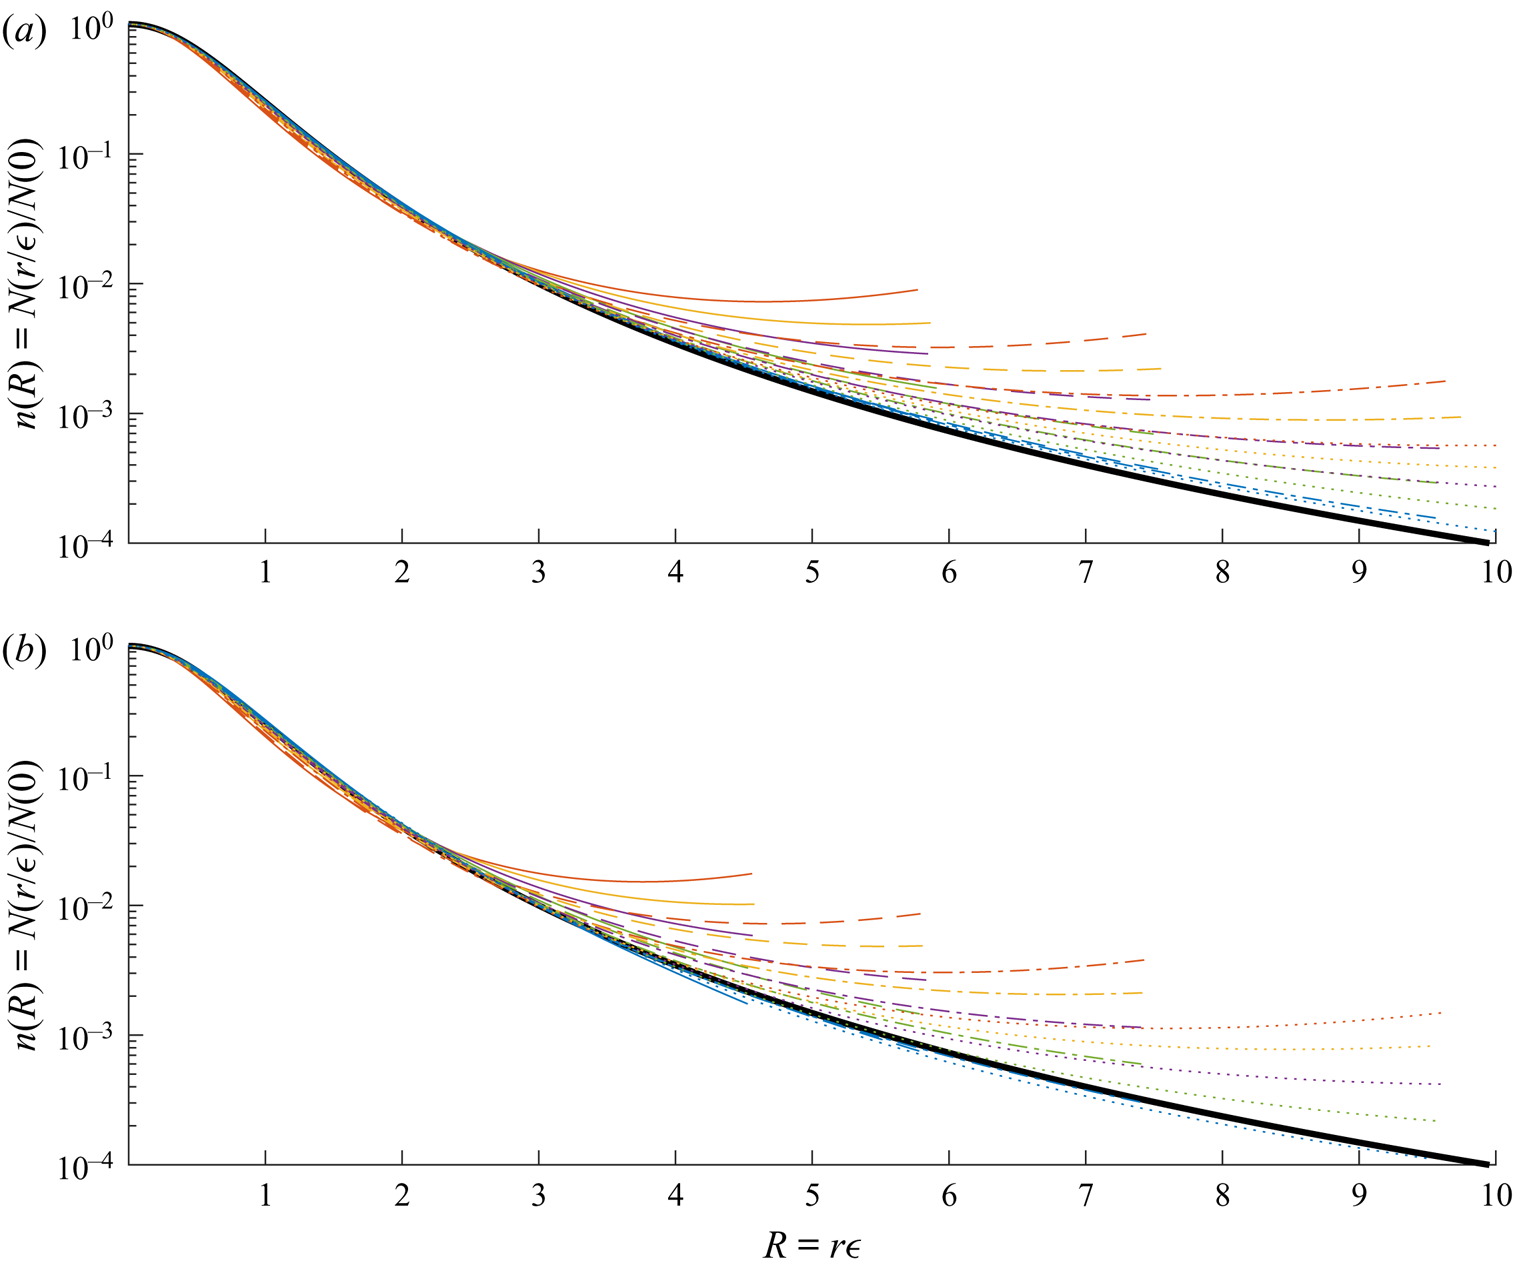
 $Q$ in this region. The normalised cell concentration of its numerical solutions for several
 $Q$ and
 $N(0)$ is compared with (3.5) in figure 10(a). Indeed, (3.5) shows an excellent agreement with the numerical solutions for
 $R\in [0,1]$. We note that (3.5) is also a good approximation of the cell-concentration profile of model G near the pipe axis, as demonstrated in figure 10(b).
The cell-concentration profile of the steady solutions normalised by the pipe axis value for several flow rates ( $Q=1,2,3,4,5$):
 $(a)$ the linearised model;
 $(b)$ model G. Here,
 $N(0)=20$,
 ;
 $N(0)=33$,
 ;
 $N(0)=55$,
 ;
 $N(0)=90$,
 for the coloured lines. The thick black solid line indicates the solution of Kessler (Reference Kessler1986a) given in (3.5).

Finally, if the solution (3.5) is substituted into (2.14), the resulting cell concentration at the pipe axis is obtained as
 \begin{equation} N(0)=\frac{1}{1-\gamma}. \end{equation}
From the definition of  $\gamma$, this implies that
 $N(0)$ would be singular, if
 $\gamma \rightarrow 1$. At
 $\gamma =1$,
 $Ri=8/(\eta Re)$, which should be a good approximation of
 $Ri_s$. Indeed, for the given
 $Re$ and
 $\eta$ of the linearised model, the value of
 $8/(\eta Re))$ is
 $57.66$, showing excellent agreement with the numerical one
 $Ri_s\simeq 57.68$ (see figure 9).
The physical mechanism for the singularity is as follow. As  $Ri$ increases, the acceleration from the negative buoyancy of cells would increase local downflow and the shear rate
 $S$, attracting more cells towards the centre from more negative
 $\langle e_r \rangle _0/D_{rr,0}$ for the increased
 $S$. The increased cell concentration would therefore increase the local downflow further, and the same process would be repeated until the resulting averaged swimming flux and the radial diffusion are balanced (i.e. formation of a steady solution). Therefore,
 $N(0)$ would increase drastically with a small increment in
 $Ri$. The physical process described here is identical to that of the gyrotactic instability. However, in the current case as well as that of Kessler (Reference Kessler1986a), there is a certain threshold of
 $Ri(=Ri_s)$, beyond which the formation of a steady solution is no longer possible.
4. Linear stability
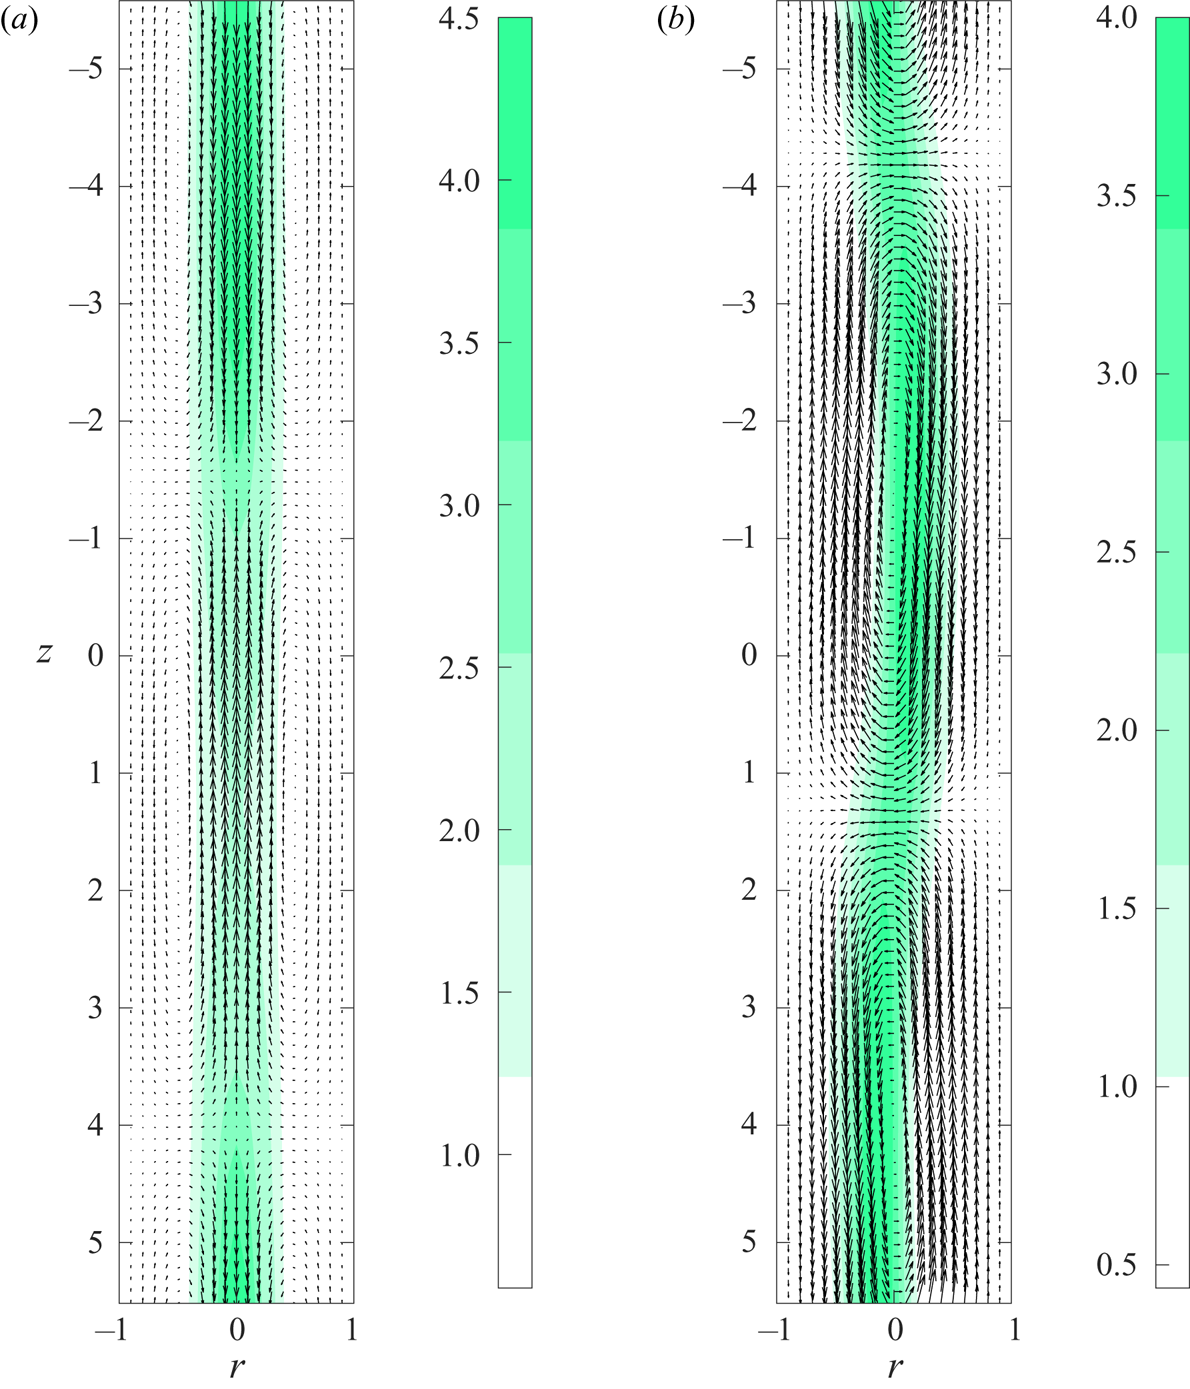
Now, linear stability analysis is performed with the steady plume solutions computed in § 3. Here, we will focus on the axisymmetric mode and the first non-axisymmetric mode, which are similar to the varicose and sinuous modes in downward channel flow (Hwang & Pedley Reference Hwang and Pedley2014b). The typical spatial structures of these two modes are visualised in figure 11, demonstrating the similarity to figure 8 in Hwang & Pedley (Reference Hwang and Pedley2014b): the axisymmetric mode is composed of a plume, the thickness of which varies along the axial direction, whereas the non-axisymmetric mode is composed of an axially meandering plume. In the present study we will be focusing on the axisymmetric mode ( $m=0$) as it is more physically relevant and observable in experiments. The first non-axisymmetric mode (i.e. when
 $m=1$) is also presented briefly.
Spatial structure of the unstable  $(a)$ axisymmetric (
 $m=0$) and
 $(b)$ non-axisymmetric (
 $m=1$) mode at
 $Ri=92, Q=1, \alpha =0.56$, computed using a lower branch basic state. Here, the contours indicate
 $N(r)+a n'(r,z)$ with an arbitrary value of
 $a$ for visualisation, and the vectors represent the axial and radial perturbation velocity field.

Given the existence of multiple basic-state solutions for a given set of  $Ri$ and
 $Q$, it is not straightforward to present the conventional neutral stability diagram. Therefore, in this section we present the stability of the steady solutions along each of the continuation curves shown in § 3. For each steady solution (basic state) and the corresponding set of parameters, the maximum growth rate
 $\omega _{i,max}$ is sought out for all real
 $\alpha$. Here, the value of
 $\alpha$ used to search for
 $\omega _{i,max}$ ranges from
 $0.001$ to
 $20$, and the corresponding
 $\alpha _{max}$ is also computed.
4.1. Axisymmetric mode
4.1.1. Model F
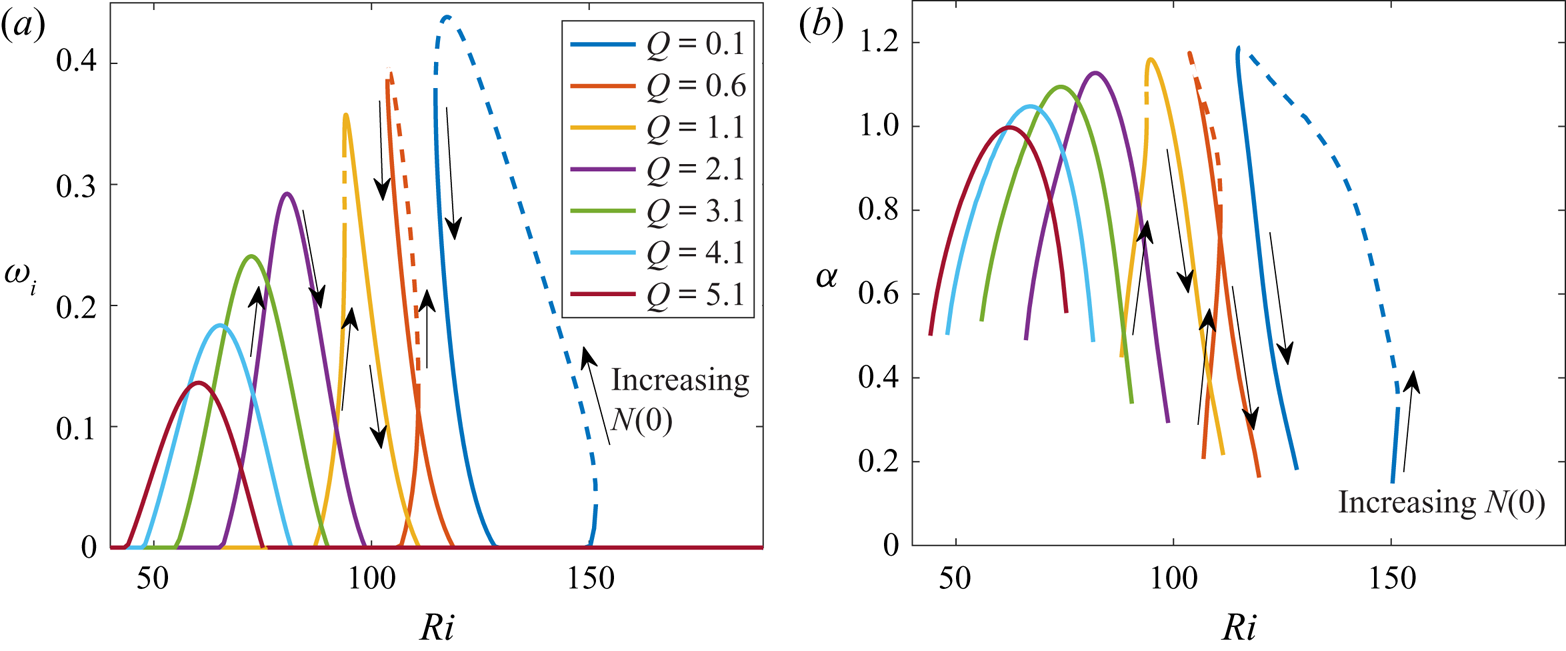
Figure 12 shows how the maximum growth rate  $\omega _{i,max}$ and the corresponding streamwise wavenumber
 $\alpha _{max}$ change with
 $Ri$ for each fixed
 $Q$ along the continuation curves in figure 3(a). At low
 $Q(\lesssim 1)$, the basic state becomes unstable to axially varying perturbations near the first saddle-node point where
 $N(0)$ increases rapidly with
 $Ri$, as the solution continued from the lower to the middle branch. With a further continuation, the solution stabilises, in that the value of
 $\omega _{i}$ begins to reduce, before the second saddle-node point (figure 12a). The streamwise wavenumber retaining the maximum growth rate also behaves similarly to
 $\omega _{i,max}$:
 $\alpha _{max}$ grows as the solution continued from the lower to the middle branch, and it decays again with a further continuation. Finally, as
 $Q$ increases,
 $\omega _{i,max}$ obtained for all the steady solutions along the continuation decreases, implying that increasing the flow rate stabilises the streamwise perturbation.
Stability of the axisymmetric mode (model F):  $(a)$ maximum growth rate
 $\omega _{i,max}$ and
 $(b)$ the corresponding
 $\alpha _{max}$ of the steady solution at each
 $Ri$ and
 $Q$. In
 $(a)$,
 , stable; - - - -, unstable to streamwise-uniform perturbation.

Comparison of figure 12(a) with figure 3(a) also indicates that the destabilisation seems to correlate with the rapid increase in  $N(0)$ of the basic state at least for the lower and middle branches. This suggests that the instability is presumably associated with the sharp gradient in the base flow and cell concentration near the pipe axis, consistent with the previous observation in Hwang & Pedley (Reference Hwang and Pedley2014b) where the instability of this type (varicose mode Hwang & Pedley (Reference Hwang and Pedley2014b)) was shown to originate from the following simplified process:
 \begin{equation} \frac{\partial n'}{\partial t} \sim - n'\left(\frac{\partial \langle e_r \rangle_0}{\partial r}+\frac{\langle e_{r} \rangle_0}{r}\right). \end{equation}
This process also appears through the first to third terms in (2.18e) in the present pipe flow. We note that  $\partial \langle e_r \rangle _0/\partial r$ and
 ${\langle e_{r} \rangle _0}/{r}$ must be negative near the pipe axis, because the cells swim towards the centre (
 $\langle e_r \rangle _0<0$) near the pipe axis and
 $\langle e_r \rangle _0=0$ at the pipe axis, implying that the same mechanism of the instability is active in the vertical pipe case.
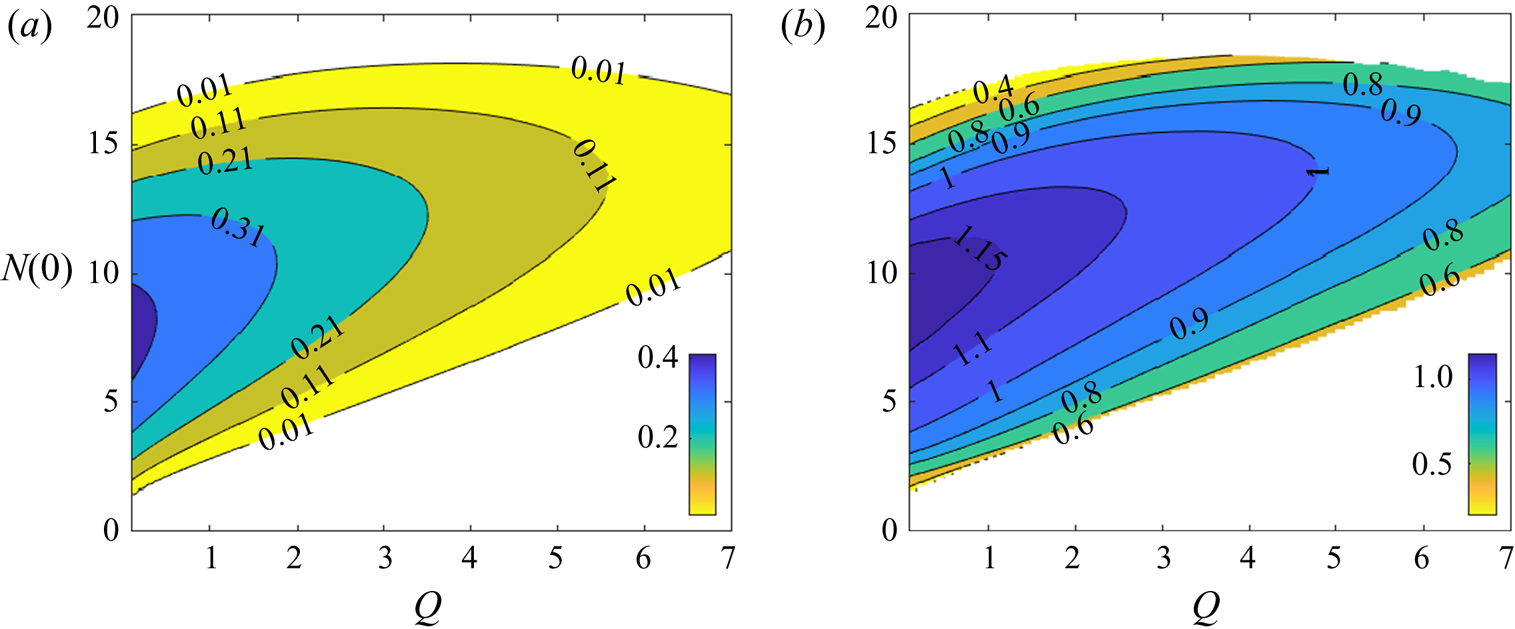
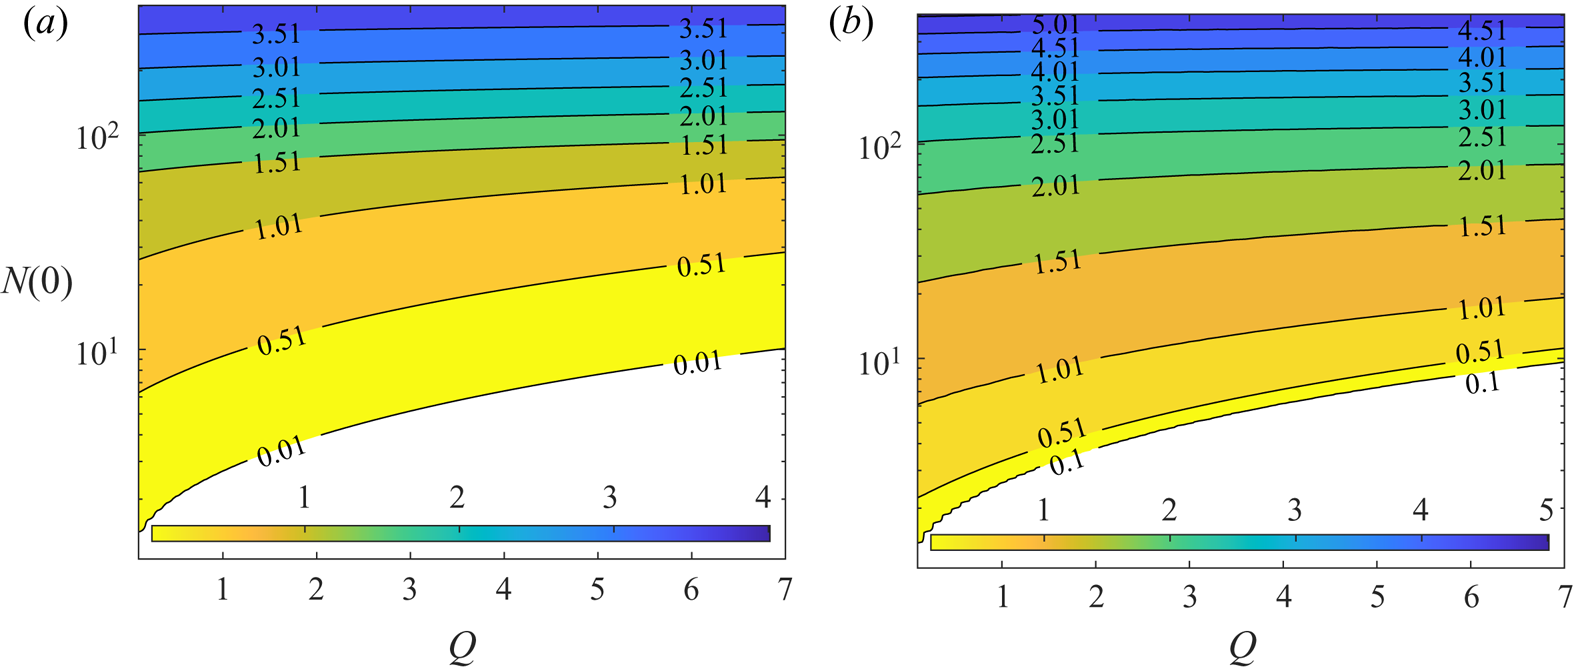
To further explain the correlation between the growth rate and the nature of the steady solution near the pipe axis, the maximum growth rate  $\omega _{i,max}$ in the
 $Q\text {--}N(0)$ plane is plotted in figure 13. For
 $N(0)\lesssim 10$, the basic state is destabilised on increasing
 $N(0)$, consistent with the explanation given above. However, as
 $N(0)$ is further increased (
 $N(0)\gtrsim 10$), the solution is found to be stabilised again. Here, we note that there are no overlapping contour lines in figure 13, which one might have expected from the existence of multiple
 $N(0)$ for a given flow rate (see figure 3a). This is because the basic state is stabilised (
 $\omega _i<0$) well before
 $N(0)$ starts to decrease along the upper branch (see figure 3a). In other words, the stabilisation takes place while
 $N(0)$ is still increasing along the continuation.
 $(a)$ The maximum growth rate
 $\omega _{i,max}$ and
 $(b)$ the corresponding
 $\alpha _{max}$ in the
 $N(0)\text {--}Q$ plane (model F). Note that the contours do not contain any overlap because the basic state is stable before
 $N(0)$ decreases in the branch continuation.

The stability analysis result here is qualitatively similar to that in Hwang & Pedley (Reference Hwang and Pedley2014b), although the stability diagram in the  $Q\text {--}Ri$ space is not directly shown here due to the complexity emerging from the bifurcation of the basic state: the most unstable mode of the flow appears in the form of an axisymmetric blip instability like their varicose mode, and this instability is stabilised if the flow rate is sufficiently large. However, it should be mentioned that Hwang & Pedley (Reference Hwang and Pedley2014b) did not explore for
 $Ri>90$. Therefore, it is unclear whether the stabilisation observed at higher
 $N(0)$ in the present pipe flow would also occur in their channel flow.
4.1.2. Model G
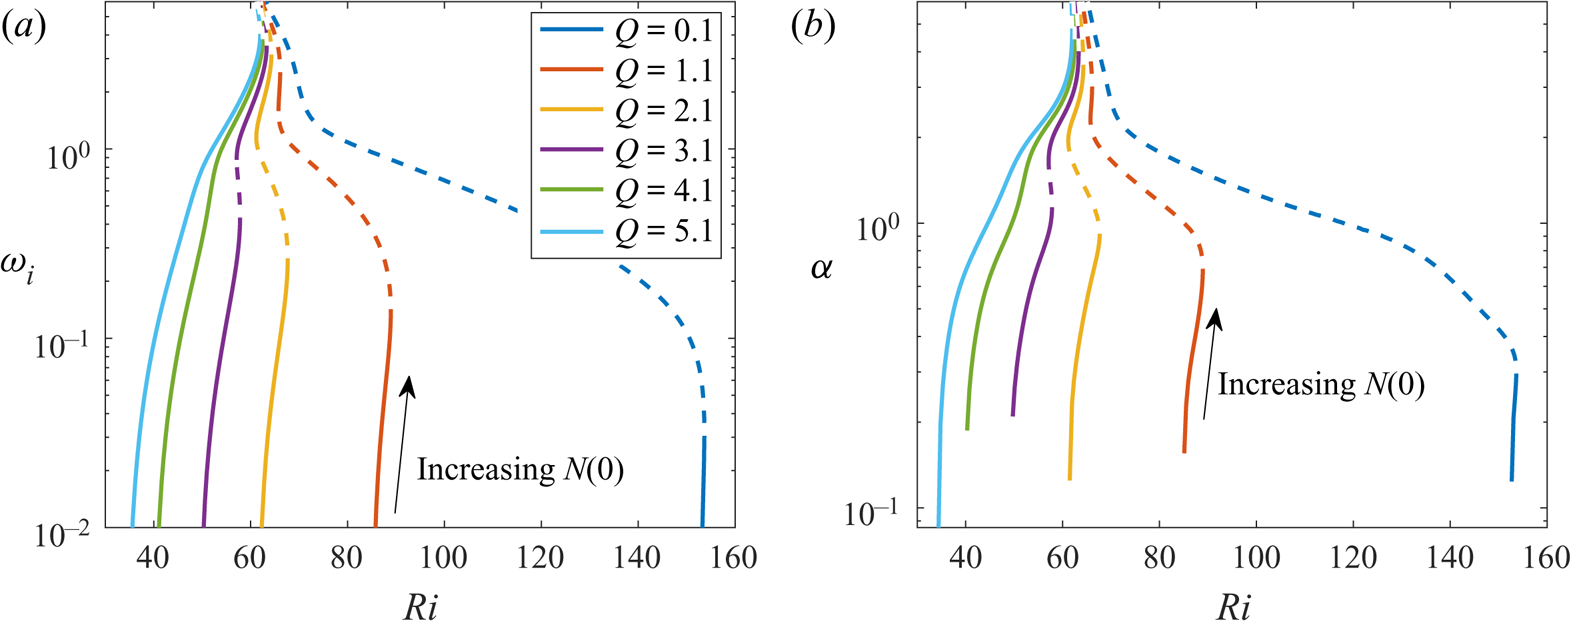
Now, we perform a linear stability using model G. Figure 14 shows how the maximum growth rate  $\omega _{i,max}$ changes with
 $Ri$ along the continuation curves in figure 5(a) for each fixed
 $Q$. Due to the wider range of the values of
 $\omega _{i,max}$ emerging in model G, here we have chosen to plot
 $\omega _{i,max}$ in log scale in figure 14. Similar to the result of model F, the basic state is destabilised near the first saddle-node point. However, in contrast with figure 12, the basic state is no longer stabilised with the continuation to upper branches. Instead, it is found that the growth rate continues to increase, and the basic state always remains unstable along the continuation curve.
Stability of the axisymmetric mode (model G):  $(a)$ maximum growth rate
 $\omega _{i,max}$ and
 $(b)$ the corresponding
 $\alpha _{max}$ of the steady solution at each
 $Ri$ and
 $Q$. In
 $(a)$,
 , stable; - - - -, unstable to streamwise-uniform perturbation.

The maximum growth rate  $\omega _{i,max}$ in the
 $Q\text {--}N(0)$ space is also plotted in figure 15. It is interesting to note that the growth rate appears to be almost independent of
 $Q$ at high enough
 $N(0)$. This is presumably because the profile of the basic-state solution is almost independent of
 $Q$ for sufficiently high
 $N(0)$, as discussed in § 3.3. This observation is also consistent with the notion that the instability is essentially driven by the local flow dynamics near the centreline of the pipe through (4.1).
 $(a)$ The maximum growth rate
 $\omega _{i,max}$ and
 $(b)$ the corresponding
 $\alpha _{max}$ in the
 $N(0)\text {--}Q$ plane (model G).

The main difference in the stability of models F and G appears from the upper branch basic state. In a way, this would not be surprising because models F and G show significantly different upper branch states. Model F exhibits decreasing  $N(0)$, as the steady basic-state solution is continued along the upper branch. By the contrary, model G shows increasing
 $N(0)$ with the continuation. This feature greatly impacts on the stability result, and we shall provide a further discussion on this issue in § 5.1.
4.2. Non-axisymmetric mode
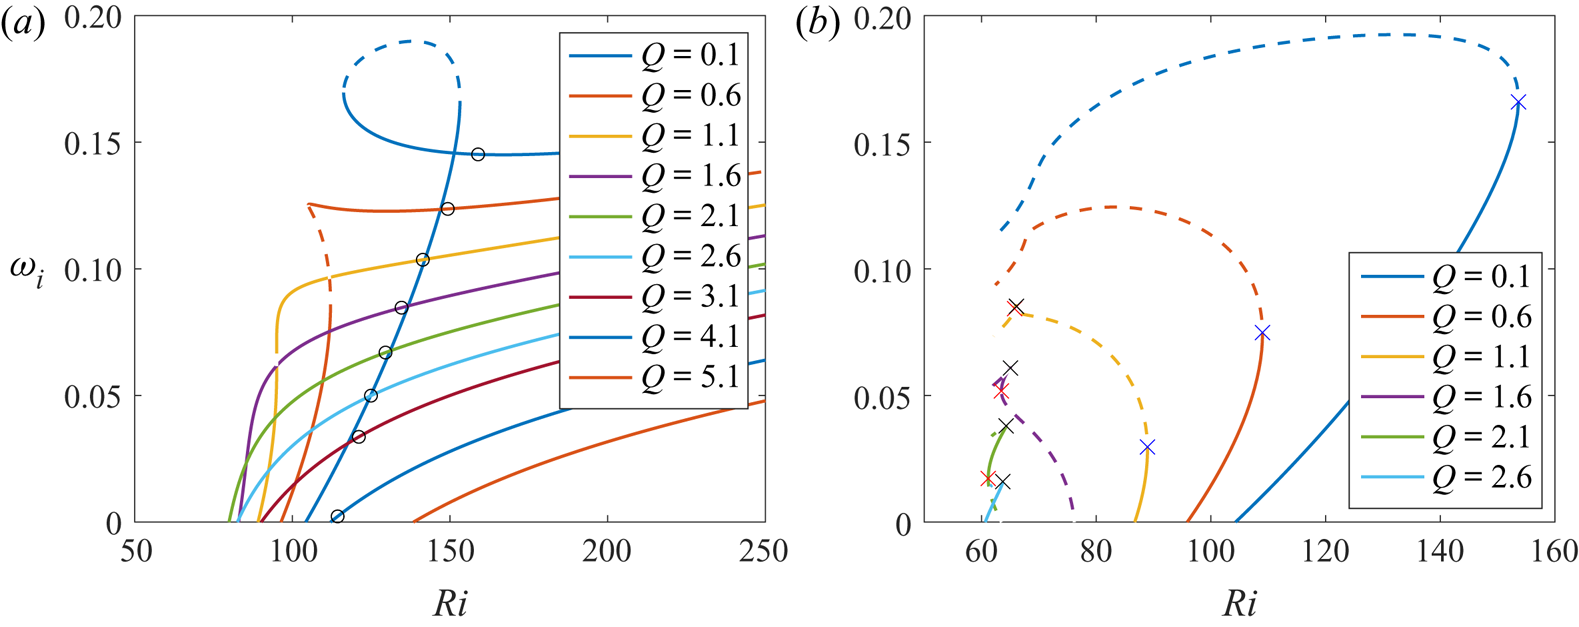
Finally, we have computed the stability of the non-axisymmetric mode (sinuous mode). It was found that, at  $m=1$, the non-axisymmetric mode is always the most unstable when
 $\alpha =0$ in both model F and model G (i.e. when the perturbation is streamwise uniform). Figure 16 shows how the maximum growth rate
 $\omega _{i,max}$ changes with
 $Ri$ along the continuation curves shown in figures 3(a) and 5(a) for models F and G, respectively. At low
 $Q({\sim } 0.1)$, the base flow becomes unstable to azimuthally varying (and streamwise-uniform) perturbation at a lower
 $Ri$ than the streamwise varying axisymmetric perturbation in both models, before the continuation reaches the first saddle-node point. For model F, the growth rate peaks at the middle branch, similar to the axisymmetric mode. However, as the solution continued to the upper branch, the non-axisymmetric mode is destabilising again, even though
 $N(0)$ is decreasing at the upper branch. For model G, the non-axisymmetric mode stabilises after the first saddle-node point despite increasing
 $N(0)$.
Stability of the non-axisymmetric mode: maximum growth rate  $\omega _{i,max}$ at each
 $Ri$ and
 $Q$, using
 $(a)$ model F and
 $(b)$ model G. In both figures,
 , stable; - - - -, unstable to streamwise-uniform perturbation. In
 $(a)$ the point with maximum
 $N(0)$ is marked with a black circle in each curve. In
 $(b)$ the blue, red and black crosses (x) indicate the first, second and third saddle-node points, respectively.

As  $Q$ increases,
 $\omega _{i,max}$ obtained for all the steady solutions along the continuation decreases. At higher
 $Q({\gtrsim } 1)$, for model F,
 $\omega _{i,max}$ remains increasing along the branch continuation even though
 $N(0)$ started decreasing (as shown by the point indicating maximum
 $N(0)$ along each continuation curve). For model G, because of the strong stabilising effect of the flow rate, the mode is only unstable when
 $Q \lesssim 3.0$. In figure 16(b), at higher
 $Q({\gtrsim } 1)$, the mode is destabilising with increasing
 $N(0)$ before the third saddle-node point. The growth rate
 $\omega _{i,max}$ peaks at the third saddle-node point. Beyond the third saddle-node point where
 $N(0)$ tends toward infinity (i.e. approaching the singularity at
 $Ri_s$),
 $\omega _{i,max}$ decreases along the continuation curve. This is also the regime where there is a self-similar profile at the centre of the pipe, as discussed in § 3.3, implying that the non-axisymmetric mode is stabilising when the self-similar plume structure becomes narrower.
The fact that the mode is most unstable when  $\alpha =0$ and that it is not as correlated to
 $N(0)$ as the axisymmetric mode strongly suggest that the non-axisymmetric mode is driven by a different mechanism. In fact, Hwang & Pedley (Reference Hwang and Pedley2014b) showed that the sinuous mode is driven by gyrotactic instability, even though Hwang & Pedley (Reference Hwang and Pedley2014b) did not take into account the spanwise variation. According to Hwang & Pedley (Reference Hwang and Pedley2014b), the gyrotactic instability is expected to originate from the simplified process
 \begin{equation} \frac{\partial n'}{\partial t} \sim - \left ({\langle e_{r} \rangle'} \frac{\partial N}{\partial r} + N \frac{\partial {\langle e_{r} \rangle'}}{\partial r}+N \frac{\langle e_{r} \rangle'}{r}+N \frac{\partial \langle e_{z} \rangle'}{\partial z}+\frac{N}{r}\frac{\partial \langle e_{\psi} \rangle'}{\partial \psi} \right), \end{equation}
which also corresponds to the first term and the second line of (2.18e). We note that this gyrotactic instability mechanism is different from that of (4.1), which is driven by the gradient in the base flow average cell swimming. Although both mechanisms originate from gyrotaxis, the former is driven directly by gyrotaxis, while the latter is the result of the net flux of cells in the radial direction due to non-uniform shear rate. A more in-depth discussion on both mechanisms can be found in Hwang & Pedley (Reference Hwang and Pedley2014b).
To confirm this mechanism, we have performed the stability analysis with the second line of (2.18e) suppressed. The non-axisymmetric mode is found no longer unstable for all the parameter space for both model F and model G, which shows that the mode is indeed driven by the gyrotactic mechanism.
5. Summary and discussion
Thus far, we have explored the bifurcation and stability of a downflowing gyrotactic micro-organism suspension in a vertical pipe flow. This work probably provides an almost full analytical picture (bifurcation and stability of steady basic state) for the original experiment of Kessler (Reference Kessler1985a,Reference Kesslerb, Reference Kessler1986a,Reference Kesslerb) with the most up-to-date continuum models (model G, in particular), while extending the stability analysis of Hwang & Pedley (Reference Hwang and Pedley2014b) for channel to pipe. In particular, both models F and G have been used in the present study, offering some useful physical insights into the benefits and drawbacks of the existing continuum descriptions.
5.1. Models F and G
The basic-state steady solutions from models F and G have been compared in a series of previous experimental and numerical studies (Bearon et al. Reference Bearon, Bees and Croze2012; Croze et al. Reference Croze, Sardina, Ahmed, Bees and Brandt2013, Reference Croze, Bearon and Bees2017). In the present study a bifurcation analysis has been performed and revealed a complete description of the existence of multiple solutions, their mutual relations and the existence boundaries for the first time. In a stationary suspension, both model F and model G exhibit a transcritical bifurcation with  $Ri$ (figure 2). With the addition of a small flow rate
 $Q$, this transcritical bifurcation with
 $Ri$ evolves into an imperfect bifurcation involving a saddle-node point (figure 2). The further increase of the flow rate results in the disappearance of the saddle-node point, exhibiting a cusp bifurcation in terms of two parameters,
 $Ri$ and
 $Q$ (figures 3b and 5b).
Despite the qualitative similarity in the behaviour of the steady solutions of models F and G, especially at low flow rates, they also exhibit several vital differences. These differences between models F and G stem fundamentally from how the translational diffusivity  $\boldsymbol{\mathsf{D}}_m$ changes with
 $S$, especially when
 $S$ is high (see figure 7b). The difference in
 $D_{rr}(S)$ results in different bifurcation behaviour, as shown by the comparison between figures 3(a) and 5(a). The differences are particularly profound at high
 $N(0)$, where the background shear rate
 $S$ is large. In model F, the plume structure of the steady solution eventually smooths out as it is continued from the middle to the upper branch. This should be related to the recovery of
 $D_{rr}$ in model F on increasing
 $S$. In contrast, the monotonically decreasing
 $D_{rr}(S)$ in model G causes the plume structure of the steady solution to be more focused as it is continued to the upper branch. This is also the essential reason why model G does not admit any steady solution, especially for high
 $Ri$. On the contrary, in model F, there always exists at least one steady solution, albeit not physically realistic.
As for the stability of the basic state, the main difference between the two models is that model F shows restabilisation of the axisymmetric mode on increasing  $N(0)$, whereas model G exhibits a rapid increase in its growth rate (figures 13 and 15). Given that the only difference between model F and model G is in the expression of the translational diffusivity, this difference should also originate from the diffusivity. It has been shown both numerically (Croze et al. Reference Croze, Sardina, Ahmed, Bees and Brandt2013) and experimentally (Croze et al. Reference Croze, Bearon and Bees2017) that the diffusivity prediction of model F is not as accurate as model G in modelling gyrotactic focusing. This suggests that the restabilisation at high
 $N(0)$ is likely not physical but an artefact of model F. Furthermore, model F showed that the non-axisymmetric mode has a higher growth rate than the axisymmetric mode at high
 $Ri$, but this is not supported by any previous experiments, in which only the axisymmetric instability mode (i.e. blip) has been observed. On the contrary, the axisymmetric mode remained the dominant mode in most of the parameter space in model G, which is more consistent with the observation of blips in experiments. These stability results suggest that model F shows little consistency with the experimental observations, and would not be as accurate as model G in predicting the blip occurrence.
5.2. Limitation and outlook of the continuum descriptions
Despite the interesting bifurcation structure and the stability of the basic state, which may offer sound explanations on the previous experiments, care must also be taken in interpreting the present analysis with the assumptions made in modelling of the suspension. We have assumed in § 2 that the contribution of swimming motions of individual micro-organisms to the flow field (i.e. the  $\boldsymbol {\nabla }^* \boldsymbol {\cdot } \boldsymbol {\varSigma }_p^*$ term in (2.2)) would be negligible throughout the present study. However, the plume structure of the computed steady solutions exhibits a very high cell density at the pipe axis, implying that this assumption would not be valid near the pipe axis region. Perhaps, a minimal way to address this issue with the continuum models in the present study would be to incorporate the ignored stresslet term. To this end, we have recomputed the steady solutions using model G with the stresslet term included, assuming that it is dominated by the contribution of swimming motions of individual micro-organisms to the flow field (for a detailed discussion, see also Pedley & Kessler Reference Pedley and Kessler1990). The stresslet term considered is given by
 \begin{equation} \boldsymbol{\varSigma}_p^*=n^* T^* \left(\langle \boldsymbol{e}\boldsymbol{e} \rangle - \tfrac{1}{3} \boldsymbol{\mathsf{I}}\right), \end{equation}
where  $T^*=10^{-10}\ \mathrm {g}\,\textrm {cm}^{2}\,\textrm {s}^{-1}$ (Pedley Reference Pedley2010b).
Figure 17 shows the effect of the stresslet term on the bifurcation of the steady solutions computed with model G. The stresslet term only slightly modifies how  $N(0)$ changes with
 $Ri$, without significant impact on the result (figure 17a). We have also arbitrarily increased
 $T$ to further understand any potential role of the stresslet in the bifurcation (figure 17b). As shown at the top of figure 17(b), the changes in the stresslet strength do not alter the singular behaviour of
 $N(0)$ (i.e.
 $N(0) \rightarrow \infty$ ). Moreover, the stresslet term seems to appear to introduce further bifurcation probably involving the emergence of unsteady solutions, as the Newton solver failed to converge within the prescribed residue (
 ${>}10^{-4}$) in the parameter space where the middle branch solutions reside (dashed lines in figure 17b). However, this issue has not been further pursued in the present study as the singular behaviour of
 $N(0)$ is still found to exist even with such a unphysically strong stresslet, implying that the removal of this singularity requires a more sophisticated modelling effort.
Bifurcation of steady basic-state solution  $(a)$ with (lighter lines) and without (darker lines) the stresslet for several
 $Q$ and
 $(b)$ for several arbitrarily scaled stresslet strengths
 $T$ at
 $Q=2$. The grey area indicates the cases where the volume fraction at the pipe axis is greater than
 $2.5\,\%$. In
 $(a)$ the lighter and darker lines almost overlap. In
 $(b)$ the dashed line (- - - -) represents the solutions obtained with large residue (
 ${>}10^{-4}$) in the solver.

It should be mentioned that, even with the stresslet term included, the interactions between the cells and the wall and the near-field interactions between cells are still neglected in the current continuum models. Cell-wall interactions may well be negligible in the present study as the cells tend to swim away from the wall. However, an accurate description of such interactions (e.g. Berke et al. Reference Berke, Turner, Berg and Lauga2008; Spagnolie & Lauga Reference Spagnolie and Lauga2012; Elgeti & Gompper Reference Elgeti and Gompper2013; Bearon & Hazel Reference Bearon and Hazel2015; Ezhilan & Saintillan Reference Ezhilan and Saintillan2015; Vennamneni, Nambiar & Subramanian Reference Vennamneni, Nambiar and Subramanian2020) may become important when there is an upflow at the centre and cells tend to move towards the wall. In particular, the current no-flux boundary condition in both model F and model G does not incorporate the swimming behaviour near the wall, because it simply extends the averaged swimming velocity and the diffusivity obtained without the influence of the wall to the near-wall region. Recently, this issue was comprehensively addressed by Jiang & Chen (Reference Jiang and Chen2019) with full Smoluchowski equation. As for cell–cell interactions, the model with the stresslet term may well be invalid near the centre of the pipe where the cells are highly concentrated. It is known that in the semi-dilute regime, the volume fraction has significant impact on the translational diffusivity (e.g. Hernandez-Ortiz, Stoltz & Graham Reference Hernandez-Ortiz, Stoltz and Graham2005; Ishikawa & Pedley Reference Ishikawa and Pedley2007; Mehandia & Nott Reference Mehandia and Nott2008; Underhill, Hernandez-Ortiz & Graham Reference Underhill, Hernandez-Ortiz and Graham2008). To address this issue, we have highlighted the parameter space, where the modelling assumption would break down, in grey in figures 5(a) and 17. The greyed-out areas represent the parameter regime in which the volume fraction at the pipe axis is higher than a threshold value of  $2.5 \times 10^{-2}$. This value was previously shown to yield significant changes to the rotational and translational diffusivities by the near-field interaction between cells (Ishikawa & Pedley Reference Ishikawa and Pedley2007).
In the previous study by Ishikawa & Pedley (Reference Ishikawa and Pedley2007) for a suspension of squirmers, it was shown that when the ambient flow is stationary, the rotational diffusivity  $D_R$ increases with the volume fraction of the cells while the translational diffusivity decreases. Therefore, although
 $N(0) \rightarrow \infty$ was found at
 $Ri \rightarrow Ri_s$ due to decreasing
 $D_{rr}$ at high shear, in reality, the near-field interaction at such a high
 $N(0)$ is likely to increase the effective rotational diffusivity
 $D_R$ at the pipe axis. However, in general, in the presence of ambient shear, the issue of how
 $\langle e_{r} \rangle _0$ and
 $D_{rr,0}$ would change with
 $D_R$ has not been very well understood. In this respect, it would be interesting to see how additional modelling incorporating the observations made in the semi-dilute suspensions would modify the plume structure of the solutions in the future.
Finally, besides the violation of the dilute-suspension assumption, the high cell concentration at the centre also gives rise to a rapidly changing shear rate in the plume structure of the solutions. This may also break down the assumptions made in model G. In the application of the GTD theory outlined by Frankel & Brenner (Reference Frankel and Brenner1991), Frankel & Brenner (Reference Frankel and Brenner1993) and Manela & Frankel (Reference Manela and Frankel2003), the shear rate of the flow was approximated to be locally homogeneous at each spatial point without taking into account the effect of inhomogeneity in the shear. In particular, Bearon & Hazel (Reference Bearon and Hazel2015) has shown that even in the absence of gyrotaxis that causes the net swimming towards the pipe axis, swimmers may still aggregate in the regions of high shear due to the inhomogeneity in the flow shear. In effect, such inhomogeneous shear can also generate an extra net advective cell-concentration flux towards the centre. Vennamneni et al. (Reference Vennamneni, Nambiar and Subramanian2020) categorised such a phenomenon as low-shear trapping, in which the phenomenological model G fails to capture due to its quasi-homogeneous assumption. Given that the formation of the upper branch solutions in the present study is strongly linked to the high shear rate near the centre, this effect might also be significant.
5.3. Implications to experimental observations
While the mode structure from the stability analysis is reminiscent of the blips observed in experiments, one needs to be cautious in comparing the experimental observation with the result from the current analysis, performed primarily with the ‘steady’ base-flow solution under the dilute-suspension assumption. In § 3.3 we have demonstrated that the solution blows up as  $\gamma =\eta Ri Re/8 \rightarrow 1$, irrespective of the flow rate
 $Q$. We note that
 $\eta$ is strictly a parameter from the given cell properties and
 $ReRi$ is proportional to
 $N^* (h^*)^2$ if the biological properties of the cell and fluid viscosity are fixed. Here, we can define the cross-sectional area of the pipe as
 $A^*= (h^*)^2{\rm \pi}$. Therefore, the physical interpretation of the singularity at
 $\gamma \rightarrow 1$ is that there exist a maximum cell number per unit length of the pipe
 $N^* A^*$ which the self-focused steady plume (upper branch) can hold.
Interestingly, the idea of having a limited capacity in the cell number per unit length of pipe of the steady plume has also been discussed in Kessler (Reference Kessler1986a). In the present study we have extended the theory by demonstrating that if the flow rate is low enough with the centreline velocity at the order of the swimming speed, there exists a lower branch state which can surpass such a threshold. However, as shown in figures 5(a) and 9, the upper branch state still has the cell capacity threshold given by  $\gamma =1$, implying that there exist a set of certain initial conditions which never reach any of the steady states within the framework of model G. Meanwhile, if the flow rate is high enough, the hysteresis disappear (figures 5a and 9) and a steady solution given in this form is no longer possible beyond the cell capacity threshold.
In both the experiments of Kessler (Reference Kessler1986a) and Denissenko & Lukaschuk (Reference Denissenko and Lukaschuk2007) where blips are observed, the total number of cells (per unit length)  $N^* A^*$ is an order of magnitude higher than the capacity threshold. Therefore, no steady solution is obtained with model G in the regimes studied in Kessler (Reference Kessler1986a) and Denissenko & Lukaschuk (Reference Denissenko and Lukaschuk2007), not allowing for any direct comparison with the experiment. However, model G and the dilute-suspension assumption remain to be valid for the experiment of Croze et al. (Reference Croze, Bearon and Bees2017), where the range of parameters did fall within the regime where steady solutions can be found. Unfortunately, in Croze et al. (Reference Croze, Bearon and Bees2017), the flow profile and the blips are not directly measured.
Perhaps the most robust feature of the steady solutions found in the present study would be the existence of a cusp bifurcation which emerges in both model F and model G. The cusp bifurcation involves bistability of the steady solutions. In such a system, the asymptotic state is highly sensitive to the form of the given initial condition and is often featured with a hysteresis which involves a discontinuous change of the state upon a continuous change of the bifurcation parameter ( $Ri$ in this case). Such sensitivity might explain why the experimental observations made for the blip formation in the
 $Q\textit {--}Ri$ space are so scattered and qualitatively different from the prediction of Hwang & Pedley (Reference Hwang and Pedley2014b) (see figure 5 in Croze et al. Reference Croze, Bearon and Bees2017).
Acknowledgements
L.F. gratefully acknowledges funding from the President's PhD Scholarship of Imperial College London. We would like to thank Dr O. Croze and Dr D. Jin for sharing their experimental observations and providing their numerical solver to verify our results.
Declaration of interests
The authors report no conflict of interest.
Appendix A. Linearised equations for perturbed average swimming orientation vector and diffusivity
In (2.18e) the values of  $\boldsymbol{\mathsf{D}}'_m$ and
 $\langle {\boldsymbol {e}} \rangle '$ are required. To obtain these values, we first need to compute
 $f(\boldsymbol {e})'$ with a perturbation of
 $\boldsymbol {\varOmega }'$:
 \begin{equation} \boldsymbol{\nabla}_e \boldsymbol{\cdot} \left[ \lambda[\boldsymbol{e}_\textbf{2}-(\boldsymbol{e}_\textbf{2} \boldsymbol{\cdot} \boldsymbol{e})\boldsymbol{e}]\,f'+ \frac{1}{2 D_R} \boldsymbol{\varOmega} \wedge \boldsymbol{e} f' \right] -\boldsymbol{\nabla}^2_e f' = -\boldsymbol{\nabla}_e \boldsymbol{\cdot} \left[ \frac{1}{2 D_ R} \boldsymbol{\varOmega}' \wedge \boldsymbol{e} f \right]. \end{equation}
Then,  $\langle {\boldsymbol {e}} \rangle '$ can be computed with
 $f(\boldsymbol {e})'$ by
 \begin{equation} \langle \boldsymbol{e} \rangle' =\int_{\|\boldsymbol{e}\|=1} \boldsymbol{e} f'(\boldsymbol{e})\,\textrm{d}^2\boldsymbol{e}. \end{equation}
For model F,  $\boldsymbol{\mathsf{D}}'_F$ is obtained easily by Hwang & Pedley (Reference Hwang and Pedley2014b):
 \begin{equation} \boldsymbol{\mathsf{D}}_F'=\tau (\langle \boldsymbol{e} \boldsymbol{e}\rangle' -\langle \boldsymbol{e} \rangle \langle \boldsymbol{e} \rangle'-\langle \boldsymbol{e} \rangle \langle \boldsymbol{e} \rangle'). \end{equation}
However, for model G, the process is more involved, as  $\boldsymbol{\mathsf{D}}'_G$ not only depends on
 $\boldsymbol {\varOmega }'$, but also
 $\boldsymbol{\mathsf{G}}'=\boldsymbol {\nabla } {\boldsymbol {u}}'$. Hence,
 \begin{equation} \boldsymbol{\mathsf{D}}_G'= \int_{\|\boldsymbol{e}\|=1} \left[ \boldsymbol{b}'\boldsymbol{e} +\frac{\boldsymbol{b}'\boldsymbol{b}}{f} \boldsymbol{\cdot} \boldsymbol{\mathsf{G}} +\frac{\boldsymbol{b}\boldsymbol{b}'}{f} \boldsymbol{\cdot} \boldsymbol{\mathsf{G}} -\frac{\boldsymbol{b}\boldsymbol{b}f'}{f^2} \boldsymbol{\cdot} \boldsymbol{\mathsf{G}}+ \frac{\boldsymbol{b}\boldsymbol{b}}{f} \boldsymbol{\cdot} \boldsymbol{\mathsf{G}}' \right]^{sym} \textrm{d}^2 \boldsymbol{e}, \end{equation}
where the perturbed  ${\boldsymbol {b}}'$ due to
 $\boldsymbol{\mathsf{G}}'$ (and
 $\boldsymbol {\varOmega }'$) is needed. We can compute
 ${\boldsymbol {b}}'$ by solving
 \begin{equation} \boldsymbol{\nabla}_e \boldsymbol{\cdot} \left[ \dot{\boldsymbol{e}}\boldsymbol{b}'- \boldsymbol{\nabla}_e \boldsymbol{b}'\right]-\boldsymbol{b}' \boldsymbol{\cdot} \boldsymbol{\mathsf{G}}= -\langle {\boldsymbol{e}} \rangle'f+(\boldsymbol{e}-\langle {\boldsymbol{e}} \rangle)f'+ \boldsymbol{b} \boldsymbol{\cdot} \boldsymbol{\mathsf{G}}'- \boldsymbol{\nabla}_e \boldsymbol{\cdot} \left[ \frac{1}{2 D_R} (\boldsymbol{\varOmega}' \wedge \boldsymbol{e}) \boldsymbol{b} \right]. \end{equation}
In practice, the left-hand side of (A 1) and (A 5) is the same linear operator used in (2.10d) and (2.10j), while their right-hand side can be viewed as different forcing terms. Therefore,  $f'$ and
 ${\boldsymbol {b}}'$ can be obtained by imposing the different forcing term on the right-hand side of (A 1) and (A 5), similarly to the framework of Hwang & Pedley (Reference Hwang and Pedley2014a,Reference Hwang and Pedleyb).
Appendix B. Equations for linear stability
Using the framework in appendix A,  $\langle {\boldsymbol {e}} \rangle '$ and
 $\boldsymbol{\mathsf{D}}_m'$ can be written as linear combinations of the components of
 $\boldsymbol {\varOmega }'$ (models F and G) and
 $\boldsymbol{\mathsf{G}}'$ (model G), hence, also as a linear combination of
 ${\boldsymbol {u}}'$. This allows us to write
 $\langle {\boldsymbol {e}} \rangle '$ and
 $\boldsymbol{\mathsf{D}}_m'$ as
 \begin{gather} {\langle e_{r}
\rangle}_0' = \frac{\xi_1}{D_R}\left(\frac{\partial
v'}{\partial z}-\frac{\partial u'}{\partial r}\right);
\end{gather}
 \begin{gather}{\langle e_{z}
\rangle}_0' = \frac{\xi_2}{D_R}\left(\frac{\partial
v'}{\partial z}-\frac{\partial u'}{\partial r}\right);
\end{gather}
 \begin{gather}{\langle e_{z}
\rangle}_0' =
\frac{\xi_3}{D_R}\left(\frac{1}{r}\frac{\partial
u'}{\partial \psi}-\frac{\partial w'}{\partial z}\right)+
\frac{\xi_4}{r D_R}\left(\frac{\partial r w'}{\partial
r}-\frac{\partial v'}{\partial \psi}\right);
\end{gather}
 \begin{align} D_{rr}' & =
\frac{1}{D_R}\left(\xi_5\frac{\partial u'}{\partial
r}+\xi_6\frac{\partial v'}{\partial r}+\xi_7\frac{\partial
w'}{\partial r}+\xi_8\frac{\partial u'}{\partial
z}+\xi_9\frac{\partial v'}{\partial
z}+\xi_{10}\frac{\partial w'}{\partial z} \right.
\nonumber\\ &\quad \left.+
\frac{1}{r}\left(\xi_{11}\frac{\partial u'}{\partial
\psi}+\xi_{12}\left(\frac{\partial v'}{\partial
\psi}-w'\right)+\xi_{13}\left(\frac{\partial w'}{\partial
\psi}+v'\right)\right)\right);
\end{align}
 \begin{align} D_{rz}' & =
\frac{1}{D_R}\left(\xi_{14}\frac{\partial u'}{\partial
r}+\xi_{15}\frac{\partial v'}{\partial
r}+\xi_{16}\frac{\partial w'}{\partial
r}+\xi_{17}\frac{\partial u'}{\partial
z}+\xi_{18}\frac{\partial v'}{\partial
z}+\xi_{19}\frac{\partial w'}{\partial z} \right.
\nonumber\\ & \quad \left. +
\frac{1}{r}\left(\xi_{20}\frac{\partial u'}{\partial
\psi}+\xi_{21}\left(\frac{\partial v'}{\partial
\psi}-w'\right)+\xi_{22}\left(\frac{\partial w'}{\partial
\psi}+v'\right)\right)\right);\end{align}
 \begin{align} D_{r\psi}' & =
\frac{1}{D_R}\left(\xi_{23}\frac{\partial u'}{\partial
r}+\xi_{24}\frac{\partial v'}{\partial
r}+\xi_{25}\frac{\partial w'}{\partial
r}+\xi_{26}\frac{\partial u'}{\partial
z}+\xi_{27}\frac{\partial v'}{\partial
z}+\xi_{28}\frac{\partial w'}{\partial z} \right. \nonumber\\ &
\quad \left. + \frac{1}{r}\left(\xi_{29}\frac{\partial
u'}{\partial \psi}+\xi_{30}\left(\frac{\partial v'}{\partial
\psi}-w'\right)+\xi_{31}\left(\frac{\partial w'}{\partial
\psi}+v'\right)\right)\right),\end{align}
where  $\xi _{1\text {--}4}$ are the same for models F and G, but
 $\xi _{5\text {--}31}$ are different for models F and G.
Application of the normal-mode assumption of (2.19) to (2.18), we get
 \begin{gather} \textrm{i} \alpha{\hat{u}}+\frac{1}{r}\frac{\partial r\hat{v}}{\partial r}+\frac{1}{r}\textrm{i} m{\hat{w}}=0, \end{gather}
 \begin{gather}\textrm{i} \omega \hat{u}+ L_{OS}{\hat{u}}+ \frac{\partial U}{\partial r} \hat{v}=-\textrm{i} \alpha{\hat{p}} + Ri\,\hat{n}, \end{gather}
 \begin{gather}\textrm{i} \omega \hat{v} + L_{OS}{\hat{v}} =-\frac{\partial \hat{p}}{\partial r}+ \frac{1}{Re}\left( -\frac{\hat{v}}{r^2} - \frac{2 \textrm{i} m}{r^2}{\hat{w}}\right), \end{gather}
 \begin{gather}\textrm{i} \omega \hat{w} + L_{OS}{\hat{w}} =-\frac{1}{r}\textrm{i} m{\hat{p}}+ \frac{1}{Re}\left(- \frac{\hat{w}}{r^2} +\frac{2 \textrm{i} m}{r^2}{\hat{v}}\right), \end{gather}
 \begin{align} & \textrm{i}
\omega{\hat{n}} + L_n \hat{n} + \frac{\partial N}{\partial
r}\hat{v} + \left(\frac{\partial N}{\partial r} + N
\frac{\partial }{\partial
r}+\frac{N}{r}\right)\left(\frac{\textrm{i} \alpha
\xi_1}{D_R}{\hat{v}}-\frac{\xi_1}{D_R} \frac{\partial
\hat{u}}{\partial r}\right) \nonumber\\
&\qquad +
\textrm{i} \alpha N \frac{\xi_2}{D_R}\left(\textrm{i}
\alpha{\hat{v}}- \frac{\partial \hat{u}}{\partial
r}\right)+\frac{\textrm{i} m N}{r}\left(\frac{\xi_3}{D_R}
\left(\frac{\textrm{i} m}{r}\hat{u}- \textrm{i} \alpha
\hat{w}\right)+\frac{\xi_4}{r D_R}\left(\frac{\partial r
\hat{w}}{\partial r}-\textrm{i} m \hat{v}\right)\right)\nonumber\\
&\quad = \frac{1}{D_R^2} \left[
\left(\frac{1}{r}\frac{\partial N}{\partial
r}+\frac{\partial N}{\partial r}\frac{\partial }{\partial
r}+\frac{\partial^2 N}{\partial r^2}\right) \left(
\xi_5\frac{\partial \hat{u}}{\partial
r}+\xi_6\frac{\partial \hat{v}}{\partial
r}+\xi_7\frac{\partial \hat{w}}{\partial r} \right. \right.
\nonumber\\
&\qquad + \left. \textrm{i} \alpha
(\xi_8{\hat{u}}+\xi_9{\hat{v}}+
\xi_{10}{\hat{w}})+\frac{\textrm{i}
m}{r}(\xi_{11}{\hat{u}}+\xi_{12}{\hat{v}}+
\xi_{13}{\hat{w}})+\frac{1}{r}(-\xi_{12}\hat{w}+\xi_{13}\hat{v})
\right) \nonumber\\
&\qquad + {\textrm{i} \alpha}
\frac{\partial N}{\partial r} \left( \xi_{14}\frac{\partial
\hat{u}}{\partial r}+\xi_{15} \frac{\partial
\hat{v}}{\partial r}+\xi_{16}\frac{\partial
\hat{w}}{\partial r}+\textrm{i} \alpha
(\xi_{17}\hat{u}+\xi_{18}\hat{v}+\xi_{19}\hat{w}) \right.
\nonumber\\ &\qquad + \left. \frac{\textrm{i} m}{r}
(\xi_{20}\hat{u}+\xi_{21}\hat{v}+\xi_{22}\hat{w})+
\frac{1}{r}(-\xi_{21}\hat{w}+\xi_{22}\hat{v}) \right)
\nonumber\\ &\qquad + \frac{\textrm{i} m}{r} \frac{\partial
N}{\partial r} \left( \xi_{23}\frac{\partial
\hat{u}}{\partial r}+\xi_{24}\frac{\partial
\hat{v}}{\partial r}+\xi_{25} \frac{\partial
\hat{w}}{\partial r}+\textrm{i} \alpha
(\xi_{26}\hat{u}+\xi_{27}\hat{v}+\xi_{28}\hat{w}) \right.
\nonumber\\ & \qquad + \left. \left. \frac{i m}{r}
(\xi_{29}\hat{u}+\xi_{30}\hat{v}+\xi_{31}\hat{w})+
\frac{1}{r}(-\xi_{30}\hat{w}+\xi_{31}\hat{v}) \right)
\right], \end{align}
where
 \begin{equation} L_{OS}= \textrm{i} \alpha U -\frac{1}{Re}\left( \frac{1}{r}\frac{\partial }{\partial r} \left( r \frac{\partial }{\partial r}\right) -\alpha^2-\frac{m^2}{r^2} \right), \end{equation}
and
 \begin{align} L_n & = \left(\frac{{\langle e_{r} \rangle}_0}{r}+\frac{\partial {\langle e_{r} \rangle}_0}{\partial r}\right)+ {\langle e_{r} \rangle}_0\frac{\partial }{\partial r} +\textrm{i} \alpha U + \textrm{i} \alpha {\langle e_{z} \rangle}_0 + \frac{\textrm{i} m {\langle e_{z} \rangle}_0}{r} \nonumber\\ &\quad - \frac{1}{D_R} \left[ \frac{1}{r} \left(D_{rr,0}\frac{\partial }{\partial r}+ \textrm{i} \alpha D_{rz,0}+2 \textrm{i} m D_{r\psi,0}\frac{\partial }{\partial r}+\textrm{i} m \frac{\partial D_{r\psi,0}}{\partial r}-2 \alpha m D_{\psi z,0} \right) \right. \nonumber\\ &\quad + \frac{\partial D_{rr,0}}{\partial r}\frac{\partial }{\partial r}+2 \textrm{i} \alpha \frac{\partial D_{rz,0}}{\partial r}+\textrm{i} \alpha D_{rz,0}\frac{\partial }{\partial r} \nonumber\\ &\quad + \left. D_{rr,0}\frac{\partial^2 }{\partial r^2}-\alpha^2 D_{zz,0} - \frac{m^2}{r^2}D_{\psi \psi,0} \right]. \end{align}
The boundary condition at the wall is
 \begin{equation} \hat{u}|_{r=1} =\hat{v}|_{r=1}=\hat{w}|_{r=1}= 0 \end{equation}
and
 \begin{equation} N \hat{v}+ N \langle e_{r} \rangle' + {\langle e_{r} \rangle}_0 \hat{n}=\frac{1}{D_R} \left(D_{rr}' \frac{\partial N}{\partial r}+D_{rr,0} \frac{\partial \hat{n}}{\partial r}+\textrm{i} \alpha D_{rz,0} \hat{n}+\textrm{i} m \frac{D_{r\psi,0}}{r}\hat{n} \right). \end{equation}
The compatibility conditions at the centre of the pipe are
 \begin{gather} \hat{u}=\hat{v}=\hat{w}=\hat{p}=\frac{\partial \hat{n}}{\partial r}=0 \quad \mathrm{when}\ m \geq 2; \end{gather}
 \begin{gather}\hat{v}+\textrm{i}\hat{w}=0, \quad\hat{u}=\frac{\partial \hat{n}}{\partial r}=\hat{p}=0 \quad \mathrm{when}\ m = 1; \end{gather}
 \begin{gather}\hat{v}=\hat{w}=0, \quad\frac{\partial \hat{u}}{\partial r}=\frac{\partial \hat{n}}{\partial r}=0\quad \mathrm{when} \ m = 0. \end{gather}
These equations can now be discretised in the radial direction and solved as an eigenvalue problem, as mentioned in § 2.6.