I. INTRODUCTION
As compared with other carbides, tungsten carbide combines favorable properties, such as high hardness, high strength, high wear resistance, and good wettability. Reference Gassmann1 Among them, tungsten carbide (WC) is the most widely used hard material in manufacturing cemented carbides for components used in various wear applications, especially in cases where hot hardness and thermal shock resistance are required. Reference Lou, Hellman, Luhulima, Liimatainen and Lindroos2 The interface of composite involved the reinforcing particles and matrix, which has a notable cushion mechanics and affects the mechanical properties of composites profoundly. Composites with well-bounded interface can maintain high strength of particles and good toughness of metal matrix simultaneously. That's the reason why composites possess an excellent performance than a single material. Reference Fan, Shi, Zhang and Wu3,Reference Liuzhang, Chengping, Zhuoxuan and Xiandong4 Therefore, it is vital to control the interface of composites, because it is not only the “heart” of composites, but also the “ties” linking reinforcement and matrix. Reference Liu and Liu5–Reference Arsenault, Wang and Feng8
In recent years, the development of carbide particle reinforced metal matrix composites has made a great progress. For instance, Zhang et al. Reference Zhang, Xing and Gao9 have developed WC/Hadfield steel composite and its results revealed that the elements W, C, and Fe in steel could react to form new carbides Fe3W3C, and the interface (i.e., Fe3W3C) between WC particles and Hadfield steel matrix was a strong metallurgical bonding. Laser surface melting was used to treat electro-metallurgic WC/steel composites by You et al., Reference You, Zhang, Liu, Huang and Ma10 and they found out that the precipitated phase was the herringbone-like eutectic carbide, i.e., Fe3W3C. Gao et al. Reference Gao, Li, Wei, Zhang and Long11 researched the effect of sintering temperature on WC steel-bonded composite and the results showed that elements diffused in the interface and the structure of the cladding layer was WC, Fe3W3C, ferrite, and the transition layer pearlite; a metallurgical bonding with high bonding strength was produced between WC steel-bonded cemented carbide and carbide steel. Wei et al. Reference Wei, Li, Gao, Ji and Long12 researched WC steel bond hard alloy and carbon steel, and the results revealed that the structures were the pearlites and ferrites in the side of the carbon steel near the interface but globular carbides, whose phase was Fe3W3C. The results of these studies have revealed that the interphase of WC particles reinforced metal matrix composites is mainly Fe3W3C, but these studies have failed to reveal the formation mechanism of Fe3W3C phase and so far there are only few studies of the formation mechanism of Fe3W3C. Therefore, it has become one of the urgent needs to explore the formation mechanism of Fe3W3C.
In this work, firstly, the stability of Fe3W3C and possible synthesis route was calculated using first principles. Secondly, the experiment adopted the rapid spark plasma sintering (SPS) equipment for the preparation of the tungsten carbide particles reinforced iron matrix composites, then the composites are remelted by vacuum tube furnace (SPS sintering + remelting process). By some modern testing methods [such as differential scanning calorimetry (DSC), X-ray diffraction (XRD), scanning electron microscopy (SEM), and energy-dispersive X-ray spectroscopy (EDS)], the interfacial reaction and formation mechanism between tungsten carbide particles and the matrix are discussed. It is expected that the research will provide a theoretical guidance in controlling the interface of tungsten carbide particles reinforced iron matrix composites.
II. METHODS AND DETAILS
A. First principle calculations
The first principle calculations to investigate the cohesive energy and formation enthalpy of Fe3W3C compound were based on the density function theory and the generalized gradient approximation (GGA). Reference Perdew, Burke and Ernzerhof13 The exchange-correction energy was estimated by the GGA of Perdew–Burke–Ernzerh scheme. Reference Perdew, Burke and Ernzerhof13 The max cut-off value of kinetic energy of the plane wave expansions in reciprocal space was 450 eV. Monkhorst–Pack scheme was used for k-point sampling in the first irreducible Brillouin zone, as 8 × 8 × 8 for WC and W2C structures, while 2 × 2 × 2 for Fe3W3C structure. The equilibrium crystal structures of carbides were obtained by Broyden–Fletcher–Goldfarb–Shannon Reference Pfrommer, Côté, Louie and Cohen14 optimization method. The total energy changes during the optimization process were finally converged to 1.0 × 10⁻⁶ eV and the force per atom was reduced to 0.01 eV/Å. The valence electron structures of C, Fe, and W were 2s 22p 2, 3d 64s 2, 4f 145d 46s 2, respectively.
To investigate the thermodynamical stability of Fe3W3C compound, the cohesive energy and formation enthalpies were calculated using Reference Matar, Weihrich, Kurowski and Pfitzner15 :
 $${E_{{\rm{coh}}}}\left( {{\rm{F}}{{\rm{e}}_3}{{\rm{W}}_3}{\rm{C}}} \right) =\; {E_{{\rm{total}}}}\left( {{\rm{F}}{{\rm{e}}_3}{{\rm{W}}_3}{\rm{C}}} \right) - 3{E_{{\rm{iso}}}}\left( {{\rm{Fe}}} \right) - 3{E_{{\rm{iso}}}}\left( {\rm{W}} \right) - {E_{{\rm{iso}}}}\left( {\rm{C}} \right)$$
 $${\Delta _{\rm{r}}}{H_{\rm{m}}}\left( {{\rm{F}}{{\rm{e}}_3}{{\rm{W}}_3}{\rm{C}}} \right) = \;{E_{{\rm{coh}}}}\left( {{\rm{F}}{{\rm{e}}_3}{{\rm{W}}_3}{\rm{C}}} \right) - 3{E_{{\rm{coh}}}}\left( {{\rm{Fe}}} \right) - 3{E_{{\rm{coh}}}}\left( {\rm{W}} \right) - {E_{{\rm{coh}}}}\left( {\rm{C}} \right)\quad ,$$
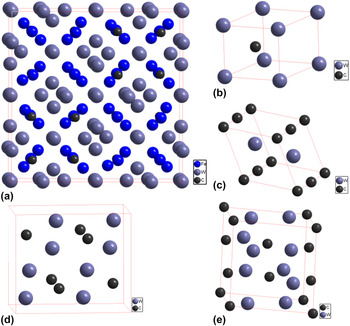
where E coh(Fe3W3C) was the cohesive energy of the transition metal carbides; Δr H m(Fe3W3C) was the formation enthalpy of the transition metal carbides; E tot(Fe3W3C) was the total energy of the transition metal carbides; E iso(Fe) was the total energy of a Fe atom, E iso(W) was the total energy of a W atom, and E iso(C) was the total energy of a C atom; E coh(Fe) was the cohesive energy of a Fe atom, E coh(W) was the cohesive energy of a W atom, and E coh(C) was the cohesive energy of a C atom. Figure 1 shows the cubic crystal structure of carbides.
The crystal structures of (a) Fe3W3C, (b) h-WC, (c) h-W2C, (d) o-W2C, and (e) t-W2C compounds, respectively.

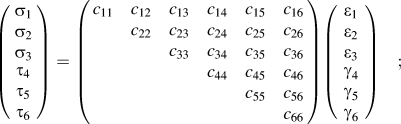
The elastic constants of the Fe3W3C compounds are calculated using the stress–strain method based on the generalized Hooker's law. Several different strain modes are imposed on the crystal structure, and then the Cauchy stress tensor for each strain mode is estimated. Finally, the related elastic constants are identified as the coefficients in strain–stress relations as shown in Eq. (3) Ref. Reference Feng, Xiao, Chen, Du, Yu and Zhou16:
 $$\left( {\matrix{ {{\sigma _1}} \cr {{\sigma _2}} \cr {{\sigma _3}} \cr \matrix{ {\tau _4} \hfill \cr {\tau _5} \hfill \cr {\tau _6} \hfill \cr} \cr} } \right) = \left( {\matrix{ {{c_{11}}} & {{c_{12}}} & {{c_{13}}} & {{c_{14}}} & {{c_{15}}} & {{c_{16}}} \cr {} & {{c_{22}}} & {{c_{23}}} & {{c_{24}}} & {{c_{25}}} & {{c_{26}}} \cr {} & {} & {{c_{33}}} & {{c_{34}}} & {{c_{35}}} & {{c_{36}}} \cr {} & {} & {} & {{c_{44}}} & {{c_{45}}} & {{c_{46}}} \cr {} & {} & {} & {} & {{c_{55}}} & {{c_{56}}} \cr {} & {} & {} & {} & {} & {{c_{66}}} \cr} } \right)\left( {\matrix{ {{\varepsilon _1}} \cr {{\varepsilon _2}} \cr {{\varepsilon _3}} \cr \matrix{ {\gamma _4} \hfill \cr {\gamma _5} \hfill \cr {\gamma _6} \hfill \cr} \cr} } \right)\quad ;$$
here, c ij is the elastic constant, τ i and σ j are the shear stress and normal stress, respectively. The total number of independent elastic constants is determined by the symmetry of the crystal. For high symmetry point group, the required different strain patterns for the c ij calculations can be greatly reduced. Reference Feng, Xiao, Chen, Du, Yu and Zhou16
B. Experimental approach
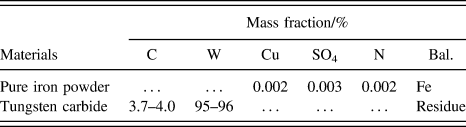
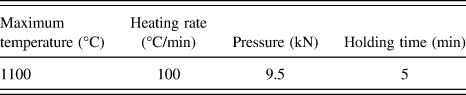
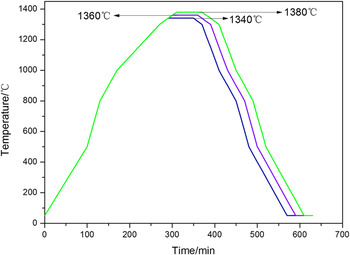
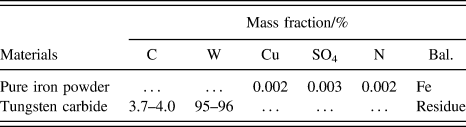
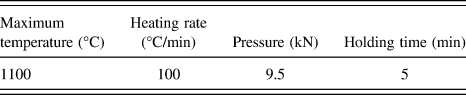
In this work, firstly, we mixed pure iron powder (43–55 μm) and spherical cast tungsten carbide particles (180–250 μm) by volume ratio of 1:1 and the composition of the experimental materials was shown in Table I. Secondly, these powders were mixed for 30 min (100 rpm) with a model for XQM-4L of planetary ball mill (Tencan, Nanjing, China). Thirdly, the powders were placed into mold of SPS and then were sintered (the sintering parameters were shown in Table II). Finally, the samples were placed into the vacuum tube furnace for interface remelting, whose heating temperature was set as 1340, 1360, and 1380 °C, respectively, and the temperature change curves of the tube furnace were shown in Fig. 2. The metallographic structure of the samples was observed using Leica EZ4D (Leica Microsystems, Solms, Germany). The phases of samples were analyzed using XRD diffraction meter (D/max-3B, Ricoh Co., Tokyo, Japan). The microstructure of composites was investigated using scanning electron microscope (XL30 ESEM-TMP, FEI Company, Amsterdam, The Netherlands). And EDS analysis was carried out to analyze the element distribution of composite materials. DSC curve was used to characterize the phase transition obtained from DSC with the model of NETZSCH STA 449 F3 (NETZSCH Group, Selb, Germany).
The chemical composition of the powders.
The parameters of SPS.
Temperature variation curves of tube furnace.

III. RESULTS AND DISCUSSIONS
A. Interface structure
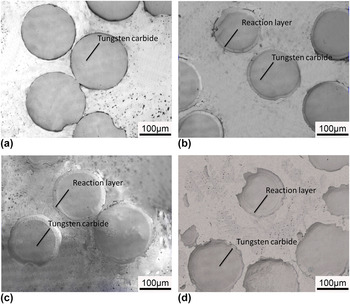
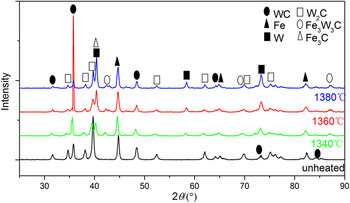
Figure 3 shows the optical microscope photographs of the unheated and remelted samples. One could see that tungsten carbide particles and matrix had a clear boundary for unheated sample, while, for remelting samples, tungsten carbide particles and matrix had an annular transition zone. It could be speculated that the transition region was interfacial reaction zone of tungsten carbide particles and matrix. It could also be concluded that with the increase of remelting temperature, the width of the interface reaction zone increased to about 8, 15, and 20 μm, respectively, as shown in Figs. 3(b)–3(d). To test the phase composition of the reaction zone, the samples were analyzed by XRD. Figure 4 shows the XRD spectrum of composite material at different remelting temperatures. The unheated sample contained only Fe, WC, and W2C phase, indicating that tungsten carbide particles and matrix did almost not react to each other. M6C phase appeared at the remelting temperature of 1340 °C and the content of M6C tended to increase with the increasing remelting temperature.
The microstructures of test samples under different temperatures: (a) unheated, (b) 1340 °C, (c) 1360 °C, (d) 1380 °C.

The XRD spectrum of test samples under different temperatures.

B. Stability of phases
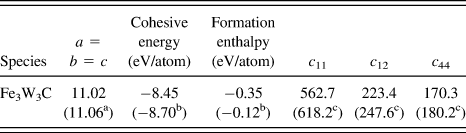
In this section, the stability of a typical M6C compound, i.e., Fe3W3C, is discussed. We depicted the calculated lattice parameters, cohesive energy, formation enthalpy and elastic constants c ij of Fe3W3C compound in Table III. In general, the calculated result of the compound was in good agreement with previous studies and experimental results. The cohesive energy and formation enthalpy were used to determine the relative stability. As shown in Table III, the cohesive energy and formation enthalpy of Fe3W3C compound were negative values −8.45 and −0.35 eV/atom. The smaller the negative values of cohesive energy and formation enthalpy, the more stable the compound. Reference Zhao, Wang, Meng and Wu17,Reference Li, Gao, Xiao, Min, Fan, Ma and Xu18 And the elastic constants c ij provided more information on the mechanical stability. In this work, the elastic constants were calculated by using the stress–strain approach based on the generalized Hooke's law, and the results were also illustrated in Table III. As we know, for the cubic crystal, the conditions of mechanical stability were Reference Patil, Khare, Tuttle, Bording and Kodambaka19,Reference Wu, Zhao, Xiang, Hao, Liu and Meng20
 $${c_{11}} > 0,\;{c_{11}} - {c_{12}} > 0,\;{c_{44}} > 0,\;2{c_{12}} > 0$$
The calculated cohesive energy, formation enthalpy and elastic constants of Fe3W3C.
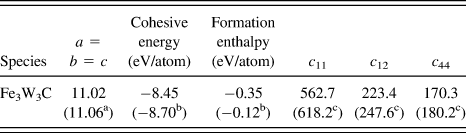
From Table III, it was obvious that the calculated elastic constants of Fe3W3C compound satisfied the corresponding criterions, which implied that it was mechanically stable.
C. Thermodynamics analysis
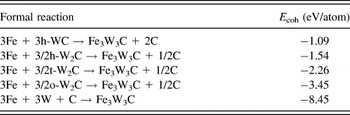
To provide an insight into the fundamental aspects of phase equilibrium in the Fe–W–C systems and determine the synthetic route of the Fe3W3C compound, its cohesive energy (E coh) was estimated for some possible preparation routes, which was based on our total energy calculations (Table IV). In this way, the formal reaction 3Fe + 3h-WC → Fe3W3C + 2C was treated, and the corresponding cohesive energy was defined as: E coh(Fe3W3C) = E tot(Fe3W3C) − 3E tot(Fe) − 3E tot(h-WC) + 2E tot(C). Reference Suetin, Shein and Ivanovskii21 Of course, other several synthetic routes of the Fe3W3C were also suitable for this estimation method. And the results were illustrated in Table V. In general, the smaller the values of the cohesive energy, the easier the reaction proceeds. So we could find (in Table V) that the reactions 3Fe + 3/2W2C → Fe3W3C + 1/2C and 3Fe + 3W + C → Fe3W3C were easier than that of 3Fe + 3WC → Fe3W3C + 2C. It is found that the formation enthalpy of h-WC is much lower than that of W2C, so h-WC have a higher stability than W2C.Reference Liu, Jiang, Zhou and Feng22 Therefore, the reaction of 3Fe + 3WC → Fe3W3C + 2C is unfavorable than that of 3Fe + 3/2W2C → Fe3W3C + 1/2C. Though the reaction of 3Fe + 3W + C → Fe3W3C has the lowest value of formation energy, the contents of elements W and C is rather low. Therefore, we can deduce that the reaction 3Fe + 3/2W2C → Fe3W3C + 1/2C dominates.
The calculated total energy of simple substance and compound.

Calculated some possible synthetic routes for formation energy (eV/atom) of Fe3W3C.

The experiment chosen cast tungsten carbide particles composed of WC and W2C, they may react as follows:
 $${\rm{WC}} \to {\rm{W}} + {\rm{C}}\quad ,$$
 $${{\rm{W}}_2}{\rm{C}} \to 2{\rm{W}} + {\rm{C}}\quad ,$$
 $$2{\rm{WC}} \to {{\rm{W}}_2}{\rm{C}} + {\rm{C}}\quad ,$$
 $${{\rm{W}}_2}{\rm{C}} \to {\rm{WC}} + {\rm{W}}\quad .$$
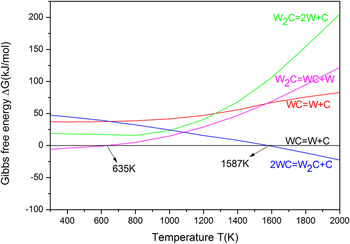
According to the thermodynamic data of WC, W2C, W, and C, Reference Liang and Che23 we could obtain Gibbs free energy curves when each reaction occurred, as shown in Fig. 5. With the increasing temperature from 0 K to 2000 K, the reaction (8) occurred easier at low temperature, while reaction (7) occurred easier at high temperature. Therefore, for tungsten carbide iron matrix composite in high temperature stage, the first main reaction (7) occurred inside the particles of tungsten carbide, and then its reaction product W2C accelerates the reaction 3Fe + 3/2W2C → Fe3W3C + 1/2C in interface, ultimately promoting the generation of Fe3W3C phase.
Change of ΔG of possible reaction with temperature in tungsten carbide.

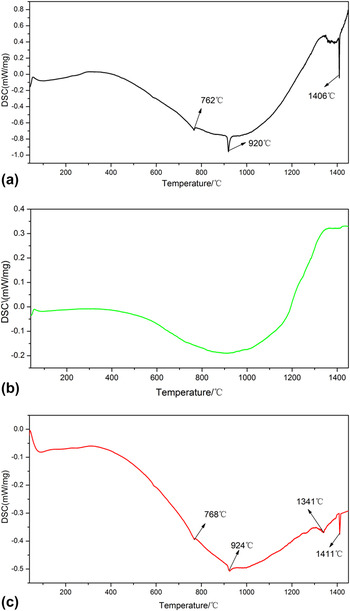
To determine the specific temperature of the tungsten carbide reacted with the matrix, the powders were analyzed by DSC. Figure 6(a) was DSC curve of Fe powders, in which there were three endothermic peaks. Combination with the characteristics of Fe, it could be concluded that the first endothermic peak (762 °C) was the Curie point of Fe powder; the second endothermic peak (920 °C) was the transition temperature of γ-Fe to α-Fe; the third endothermic peak (1406 °C) was the melting point of Fe. Figure 6(b) was the DSC curve of tungsten carbide particles, in which there is not any obvious phase transition point. Figure 6(c) was the DSC curve of mixture powders and the curve had four endothermic peaks. The first endothermic peak (768 °C) was Curie point of Fe powders; the second endothermic peak (924 °C) was transition temperature of γ-Fe to α-Fe; the third endothermic peak (1341 °C) was caused by the reaction of tungsten carbide particles and matrix; the fourth endothermic peak (1411 °C) was the melting point of Fe.
The DSC curves of powder: (a) Fe powder, (b) tungsten carbide, (c) mixture.

D. Dynamics analysis
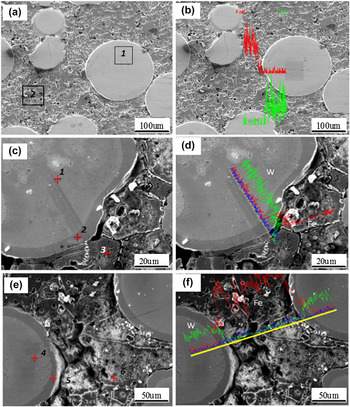
To clarify the formation mechanism of the interface, we used EDS line scan, shown in Fig. 7. Figures 7(a) and 7(b) are SEM images of an unremelted sample. We can see that elements distribution of Fe and W around the tungsten carbide particles showed a significant jump, i.e., there is no smooth transition. The element Fe is concentrated in Fe matrix, while element W is concentrated in the tungsten carbide particles, which can be considered that elements were difficult to diffuse mutually in such a short duration. Therefore, it could be inferred that there was a typical mechanical bonding for the interface between WC particles and Fe matrix. The mapping of area 1, marked with a rectangle box, indicated a uniform distribution of element W and C; while the mapping of area 2 indicated typical characteristics of Fe matrix.
The SEM images of samples without and with remelting under different temperatures. (a) and (b) unheated, (c) and (d) 1340 °C, (e) and (f) 1380 °C.

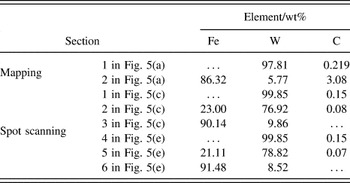
Figures 7(c)–7(f) shows typical SEM images of samples at the remelting temperatures of 1340 and 1380 °C. It was clear that element W was mainly concentrated in the side of tungsten carbide particles, while, element Fe was concentrated in the side of matrix, but, the most important, in the annular transition region, elements W and Fe indicated a smooth transition, shown in Figs. 5(d) and 5(f). Moreover, combined with the EDS microanalysis results listed in Table VI, we can see that mutual diffusion occurred at the interface between tungsten carbide particles and Fe matrix.
The EDS microanalysis in the composites.

IV. CONCLUSIONS
It was clear that Fe3W3C compound was stable from the perspective of both thermodynamics and mechanicals based on our calculations. Interfacial reaction product of tungsten carbide particles reinforced iron matrix composites was M6C. The mutual diffusion occurred at the interface between tungsten carbide particles and Fe matrix. W2C and Fe matrix reacts directly to obtain Fe3W3C when the temperature was over 1341 °C. Its formation mechanism was 3Fe + 3/2W2C → Fe3W3C + 1/2C. Experimental results indicated that the samples prepared by SPS did not appear interfacial reaction zone; interfacial reaction zone appeared for the remelted samples. It is expected that our research will provide a theoretical guidance in controlling the interface of tungsten carbide particles reinforced iron matrix composites.
ACKNOWLEDGMENT
This work is supported by the National Natural Science Foundation of China (Nos: 51361019 and 51561018).