Introduction
Coccidiosis is an infectious disease with great impact on poultry production worldwide (Chapman et al., Reference Chapman, Barta, Blake, Gruber, Jenkins, Smith, Suo and Tomley2013; Blake and Tomley, Reference Blake and Tomley2014; Witcombe and Smith, Reference Witcombe and Smith2014). The disease is caused by protozoan parasites of the genus Eimeria, phylum Apicomplexa [reviewed in (Chapman et al., Reference Chapman, Barta, Blake, Gruber, Jenkins, Smith, Suo and Tomley2013; Blake and Tomley, Reference Blake and Tomley2014; Witcombe and Smith, Reference Witcombe and Smith2014)]. Eimeria parasites are obligate intracellular and all the seven Eimeria species that infect domestic fowl invade, and replicate in, intestinal epithelial cells. Infections may cause a range of symptoms in chickens from death and severe clinical signs to subclinical manifestations such as decreased growth rates and decreased feed conversion depending on the Eimeria species, infection dose and immune status of the birds. It is well recognized that Eimeria infections in chickens induce strong Eimeria species-specific immunity (Pierce et al., Reference Pierce, Long and Horton-Smith1962; Rose and Long, Reference Rose and Long1962; Leathem and Burns, Reference Leathem and Burns1967; Leathem and Burns, Reference Leathem and Burns1968; Rose, Reference Rose1974; Rose et al., Reference Rose, Lawn and Millard1984; Rose and Hesketh, Reference Rose and Hesketh1987; Blake et al., Reference Blake, Hesketh, Archer, Carroll, Shirley and Smith2005). It is also well accepted that Eimeria protection is mediated by T-cells rather than antibodies [reviewed in (Chapman et al., Reference Chapman, Barta, Blake, Gruber, Jenkins, Smith, Suo and Tomley2013; Blake and Tomley, Reference Blake and Tomley2014; Witcombe and Smith, Reference Witcombe and Smith2014)] although the exact immune mechanisms involved in parasite inhibition still remain largely unidentified. For chickens, it has, e.g. been shown that immunity to E. maxima may be transferred from an immune to a naïve bird with lymphocyte preparations (Rose and Hesketh, Reference Rose and Hesketh1982) and that immunity to, e.g. E. tenella re-infection could be abrogated by in vivo depletion of CD8+ or T-cell receptor (TCR) α/β+ cells (Trout and Lillehoj, Reference Trout and Lillehoj1996). Thus, studies on chicken immunity to Eimeria focus on T-cells and relevant in vitro methods to assess Emeria-specific T-cell activity is a valuable asset to evaluate immune responses. Assessment of lymphocyte proliferation is a basic method to study cell activation in vitro that may be used to detect antigen-specific T-cell responses [reviewed in (Kruisbeek et al., Reference Kruisbeek, Shevach and Thornton2004; Muul et al., Reference Muul, Heine, Silvin, James, Candotti, Radbruch and Worm2011)]. Even though proliferation is not a direct effector function of T-cells, the methodology has advantages such as being easy to set up and evaluate and has been widely used in many animal species and different experimental settings. To detect proliferation upon stimulation of cultured cells, one may for instance use incorporation of 3H-thymidine into DNA that usually gives a good correlation with cell division. This method gives a measure of proliferation in the whole cell culture during the period of the 3H-thymidine pulse. This method does however not allow further identification of the proliferating cells. We used this methodology as a straightforward readout of Eimeria-induced proliferation of cultured chicken spleen cells in several experiments in the present study. For further phenotypic identification of lymphocytes proliferating/activated upon in vitro stimulation, a number of methods may be used, for instance identification and quantification of lymphoblasts by flow cytometry combined with immunofluorescence labelling of the activated cells (Gaines and Biberfeld, Reference Gaines and Biberfeld2000; Svahn et al., Reference Svahn, Linde, Thorstensson, Karlen, Andersson and Gaines2003). We also evaluated this methodology for the assessment of Eimeria-induced activation of cultured chicken spleen cells.
In the current work, we have used Eimeria tenella, which is one of the most pathogenic species that infect domestic fowl and one of its distinctive features is that it only replicates in the caecal epithelium. This species is considered one of the least immunogenic of the Eimeria species infecting chickens (Rose and Long, Reference Rose and Long1962; Bumstead et al., Reference Bumstead, Bumstead, Rothwell and Tomley1995) but solid immunity is nevertheless observed after re-infection (Rose and Long, Reference Rose and Long1962; Bumstead et al., Reference Bumstead, Bumstead, Rothwell and Tomley1995; Wattrang et al., Reference Wattrang, Magnusson, Näslund, Thebo, Hagström, Smith and Lundén2016a, Reference Wattrang, Thebo, Lunden and Dalgaard2016b). Moreover, in vitro proliferative responses of leukocytes collected from primary E. tenella-infected birds have previously been demonstrated upon stimulation with E. tenella antigen (Lillehoj, Reference Lillehoj1986; Bumstead et al., Reference Bumstead, Bumstead, Rothwell and Tomley1995; Breed et al., Reference Breed, Dorrestein and Vermeulen1996, Reference Breed, Dorrestein, Schetters, Waart, Rijke and Vermeulen1997a, Reference Breed, Schetters, Verhoeven and Vermeulen1997b; Huang et al., Reference Huang, Zou, Xu, Ding, Yin, Liu and Suo2011). However, none of those protocols have come into wide use. We have set up a well-defined experimental infection model using the E. tenella Houghton strain (Chapman and Shirley, Reference Chapman and Shirley2003) that we have used to examine in vivo immune responses of naïve and immune chickens (Wattrang et al., Reference Wattrang, Magnusson, Näslund, Thebo, Hagström, Smith and Lundén2016a, Reference Wattrang, Thebo, Lunden and Dalgaard2016b). The aim of the present study was to establish a protocol to monitor E. tenella-specific T-cell responses by in vitro re-stimulation of primary cells obtained from this animal model. Focus was on defining optimal culture conditions, readouts and sampling time points after primary infection for this methodology. We used spleen leukocytes as the source of parasite-specific T-cells and the time interval 6–16 days after primary infection. This time interval was chosen based on earlier published work (Lillehoj, Reference Lillehoj1986; Bumstead et al., Reference Bumstead, Bumstead, Rothwell and Tomley1995; Breed et al., Reference Breed, Dorrestein and Vermeulen1996, Reference Breed, Dorrestein, Schetters, Waart, Rijke and Vermeulen1997a, Reference Breed, Schetters, Verhoeven and Vermeulen1997b; Huang et al., Reference Huang, Zou, Xu, Ding, Yin, Liu and Suo2011). Moreover, we have in earlier studies using this infection model observed that activated cytotoxic T-cells were recruited at the site of parasite replication in this time frame (Wattrang et al., Reference Wattrang, Thebo, Lunden and Dalgaard2016b).
Materials and methods
Chickens and experimental design
The authors assert that all procedures contributing to this work comply with the ethical standards of the relevant national and institutional guides on the care and use of laboratory animals. Experiments were approved by the Uppsala regional Ethical Committee for Animal Experiments, permits nos. C94/8, C 141/11 and C44/16.
All chickens used were female Bovans Robust Leghorn layer hybrids purchased from Swedfarm AB (http://www.swedfarm.se) and reared from day-old under SPF-conditions at the animal facilities at the National Veterinary Institute, Uppsala, Sweden. Chickens were group housed in cages in rooms under negative pressure ventilation and after E. tenella infection infected and uninfected chickens were kept in separate rooms.
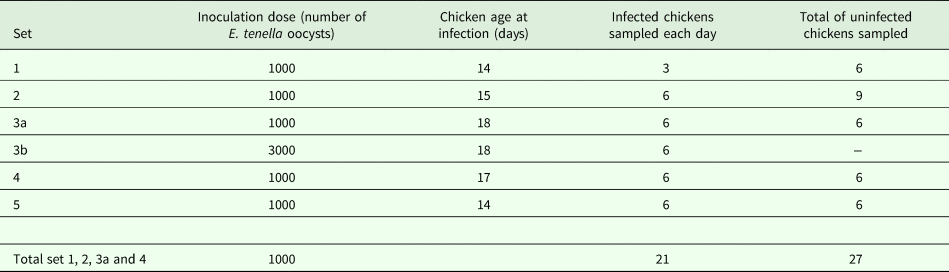
Experimental E. tenella infections were performed in five sets, described in Table 1. Prior to each infection, chickens were weighed and blood samples were collected for E. tenella serology. Chickens were then allocated to seven groups in sets 1, 2 and 4, to 13 groups in set 3 and to four groups in set 5, with respect to an even distribution of weight and levels of maternal antibodies to E. tenella in serum. Chickens in six groups (sets 1, 2 and 4), or 12 groups (set 3), or three groups (set 5), were inoculated with E. tenella, while one group in each set was left uninfected. On days 6, 8, 10, 12, 14 and 16 after infection, chickens in one (sets 1, 2, and 4), or two (set 3), infected groups were killed along with one or two chickens from the uninfected groups. In set 5, infected chickens in one group were killed on days 8, 10 and 13 after infection along with two chickens from the uninfected group.
Inoculation dose and the numbers of chickens sampled, i.e. spleens collected, during the five sets of experimental E. tenella infections

In sets 1–4, infected chickens were killed on days 6, 8, 10, 12, 14 and 16 after inoculations, in set 5, infected chickens were killed on days 8, 10 and 13 after inoculation, one or two uninfected chickens were also killed at each of these days.
Fecal, serum and spleen sample collection
All chickens were housed in specially designed cages with interchangeable flooring. Most of the time, chickens were kept on solid floors with wood shavings as bedding. For fecal collection, chickens were kept on wire floors without bedding and feces were collected onto plastic sheeting in trays underneath the wire floor. In all sets, all feces produced during 24 h intervals were collected from day 5 (120 h) post-infection to day 9 (218 h) post-infection.
Before infection, blood samples for E. tenella serology were collected from the jugular vein into plastic micro centrifuge tubes.
Chickens were killed by cervical dislocation on the days indicated in Table 1 and spleens were collected into test tubes with sterile phosphate-buffered saline (PBS; without Ca2+ and Mg2+ at pH 7).
Preparation of E. tenella inoculum and detection of oocysts in fecal samples
A pure E. tenella Houghton strain (Chapman and Shirley, Reference Chapman and Shirley2003) isolate was maintained and sporulated oocysts prepared as described earlier (Wattrang et al., Reference Wattrang, Magnusson, Näslund, Thebo, Hagström, Smith and Lundén2016a). In sets 1, 2, 4 and 5, each infected bird was inoculated orally with 1000 live E. tenella oocysts resuspended in water, while in set 3, half (n = 36) of the infected birds were inoculated with 1000 live oocysts each and the other half were inoculated with 3000 live oocysts each. Viability of oocysts was estimated based on our experience that approximately 12% of oocysts loose infectivity per month of storage in 2% dichromate at 4 °C and oocysts used had been stored for a maximum of 6 months.
From days 5 to 9 (120–218 h) after the experimental infections, all feces produced by chickens in each cage during a 24 h period was collected, weighed and thoroughly mixed. Numbers of oocysts per gram feces (OPG) were determined using a modified McMaster technique earlier described (Waldenstedt et al., Reference Waldenstedt, Elwinger, Lunden, Thebo, Bedford and Uggla2000). Chickens used in the present study were part of larger groups of chickens infected with E. tenella and therefore feces samples were from a total of 73 (in five cages; set 1), 110 (in five cages; set 2), 112 (in three cages; set 4), 45 (in three cages; set 5) and 63 chickens for each oocyst dose (in three cages for each dose; set 3), respectively. OPG was determined in technical replicates of five (one per cage; set 1), 15 (three per cage; set 2), nine (three per cage; sets 4 and 5) and nine for each oocyst dose (three per cage for each dose; set 3), respectively. A sensitive centrifugal saturated sodium chloride flotation method (Anonymous, 1971) to detect potential small amounts of oocysts was also applied on all samples and Eimeria species identity was verified using DNA-typing according to earlier described methods (Haug et al., Reference Haug, Thebo and Mattsson2007).
ELISA for the detection of E. tenella antibodies
An in house ELISA described earlier (Wattrang et al., Reference Wattrang, Magnusson, Näslund, Thebo, Hagström, Smith and Lundén2016a) was used for the detection of maternal antibodies to E. tenella in chicken serum for the initial group assignment.
Preparation of E. tenella sporozoite antigen
Sporozoites were purified from sporulated E. tenella oocysts according to Schmatz et al. (Reference Schmatz, Crane and Murray1984). In brief, sporulated oocysts were prepared as described earlier (Wattrang et al., Reference Wattrang, Magnusson, Näslund, Thebo, Hagström, Smith and Lundén2016a), mechanically disrupted with glass beads after which sporocysts were opened using taurocholic acid and trypsin and sprorozoites subsequently purified using DE-52 anion exchange chromatography matrix (Whatman®, Sigma-Aldrich Merck, http://www.sigmaaldrich.com). The sporozoites were then stored at −20 °C until preparation of the lysate when the sporozoites were resuspended in distilled water, subjected to two freeze–thaw cycles and then further disrupted by probe-sonication on ice (8 × 15 s with an amplitude of 16–20 µ peak to peak). The preparation was centrifuged at 2500 × g for 20 min to exclude pelleted debris and the protein concentration was determined by Bradford protein assay. This E. tenella antigen preparation was stored as a stock solution at −20 °C until use when diluted in growth medium, i.e. RPMI 1640 (National Veterinary Institute) supplemented with 200 IU penicillin mL−1, 100 µg streptomycin mL−1, 2 mm l-glutamine, 5 × 10⁻⁵ M 2-mercaptoethanol and 5% fetal calf serum (FCS; Gibco® #10082147, ThermoFisher Scientific https://www.thermofisher.com), and used at final concentrations of 5, 2.5 or 1.25 µg mL−1 in cell cultures.
Preparation of spleen cells for the detection of proliferation by uptake of 3H-thymidine
From spleen, a single cell suspension in PBS was generated by mashing through a cell strainer (Falcon® #352350, 70 µm, Corning Inc., http://www.corning.com). Cells were washed twice in PBS (150 × g for 5 min) and resuspended in growth medium. Live mononuclear cells were counted by trypan blue exclusion and the cell concentration adjusted to 1 × 10⁷ mL. One hundred microlitres of cell suspension and 100 µL of growth medium with or without E. tenella antigen were added per well in round-bottomed microtiter plates (Nunc™, ThermoFisher Scinetific). Cultures were set up in quadruplicate and cultured at 40 °C, 5% CO2 in a humid atmosphere, for a total of 96 h, the last 24 h cells were pulsed with 0.5 µCi 3H-thymidine (Perkin Elmer, http://www.perkinelmer.com). Plates were then frozen and stored at −20 °C until harvested using a 96-well system and the uptake of 3H-thymidine was measured in a liquid scintillation β-counter (Wallac 1450 MicroBeta Trilux, Perkin Elmer). Mean counts per minute (cpm) was calculated for quadruplicate cultures for each chicken and proliferation was expressed as net cpm values (i.e. induced culture – growth medium control culture) for each chicken.
Immunomagnetic depletion of TCRγ/δ expressing cells
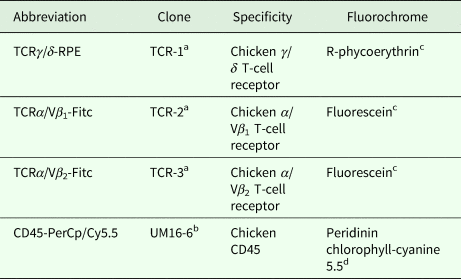
Magnetic depletion of spleen cells expressing the TCRγ/δ was preformed using an EasySep® PE Selection Kit (StemCell Technologies, http://www.stemcell.com) according to a procedure adapted from the manufacturer's depletion protocol (EasySep® protocol no. 28898). In brief, ⩽4 × 10⁸ total spleen cells (i.e. including red blood cells) were suspended in PBS with 1 mm EDTA and 2% FCS, labelled with a murine monoclonal antibody to chicken TCRγ/δ (TCRγ/δ–RPE; for details see Table 2; 1 µg mL−1) and coupled to magnetic nanoparticles according to the kit instructions. Cells were incubated twice for 10 min on the magnet and the non-magnetic cells from the final incubation were used as the depleted population. The depleted cells were counted and cells for proliferation assays were re-suspended in complete growth medium at a concentration of 1 × 10⁷ live mononuclear cells per millilitre and induction cultures were set up as described above. The purity of the TCRγ/δ depleted cell preparation was determined by direct immunofluorescence labelling described below.
Monoclonal antibodies used for immunolabelling used for freshly isolated, set 4, and cultured, set 5, chicken spleen cells, respectively

a Purchased from Southern Biotech (http://www.southernbiotech.com).
b Purchased from BIO-RAD AbD Serotec (http://www.abdserotec.com).
c Fluorochrome conjugated by manufacturer.
d Fluorochrome conjugated using Lightning-Link™ conjugation kits (Innova Biosciences, http://www.innovabiosciences.com) according to the manufacturer's protocol.
Preparation of spleen cells for the detection of blast transformation
A single spleen cell suspension was generated as described above, layered onto Ficoll-Paque PLUS (GE Healthcare Life Sciences, http://www.gelifesciences.com) and centrifuged at 400 × g for 25 min. Interphase cells were collected and washed twice in PBS and resuspended in growth medium. The suspension was subsequently incubated at 37 °C for 1 h to clump dead cells (Protocols for cell handling, Mabtec Knowledge Center, http://www.mabtech.com/knowledge-center/). After incubation, the suspension was vortexed briefly, and clumped cells left to sediment for 5 min and thereafter the supernatant was collected and live mononuclear cells were counted by trypan blue exclusion. The final mononuclear cell concentration was adjusted to 107 live cells mL−1. Cultures were set up as described above with growth medium, E. tenella antigen (final concentration 5 µg mL−1) and concanavalin A (Con A; final concentration 20 µg mL−1; Sigma-Aldrich Merck), respectively. Cultures were incubated for 72 h and cells were subsequently labelled for flow cytometry as described below.
Immunofluorescence labelling of spleen cells
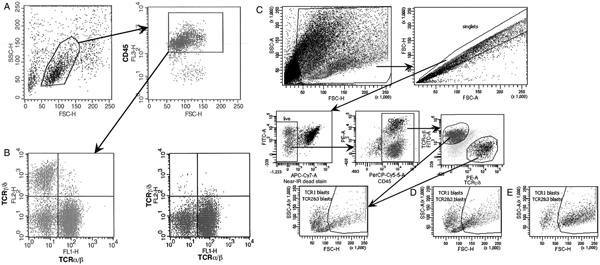
Labelling was performed according to a protocol described earlier (Wattrang et al., Reference Wattrang, Dalgaard, Norup, Kjaerup, Lunden and Juul-Madsen2015). In brief, either freshly isolated spleens cells, unseparated or subjected to immunomagnetic depletion, from set 4 or cultured spleen cells from set 5 were incubated with the antibody panel described in Table 2 for 20 min at room temperature in the dark. Cells were subsequently washed and either analysed directly, set 4, or fixed with 1.25% paraformaldehyde and stored at 4 °C until analysis, set 5. The TCRα/Vβ 1 and TCRα/Vβ 2 antibodies were used in combination and the collective FITC-labelled cells were designated TCRα/β+. In set 5, LIVE/DEAD® fixable Near-IR dead stain (#L10120, Life Technologies, http://www.lifetechnologies.com) was used for dead cell exclusion. Labelled cells were analysed by flow cytometry. In set 4, a BD FACScan™ (BD Biosciences, http://www.bdbiosciences.com) equipped with a 488 nm blue laser was used and results were analysed with the CellQuest (BD Biosciences) software. In set 5, a BD FACSCanto™ (BD Biosciences) equipped with a 488 nm blue and a 633 nm red laser was used and results were analysed with the FACSDiva software (BD Biosciences). Single-stained compensation controls and fluorescence minus one negative controls were included and the gating strategies are shown in Fig. 1. Titrations of all antibodies to determine optimal labelling conditions were performed prior to the experiment. As recommended by Gaines and Biberfeld (Reference Gaines and Biberfeld2000) and Svahn et al. (Reference Svahn, Linde, Thorstensson, Karlen, Andersson and Gaines2003), blast transformation in cultures stimulated with E. tenella antigen (set 5) was expressed as percentage stimulation which was calculated as 100 × (proportion of blasts in E. tenella antigen-stimulated cultures – proportion of blasts in medium cultures)/(proportion of blasts in Con A-stimulated cultures – proportion of blasts in medium cultures).
Gating strategies for flow cytometry in set 4 (A and B) and set 5 (C, D and E). (A) Phenotyping of TCRα/β+ and TCRγ/δ+ spleenocytes, respectively, through mononuclear and CD45+ gating using CD45-PerCp/Cy5.5, TCRα/β-Fitc and TCRγ/δ-RPE. A representative unseparated spleen sample from an E. tenella-infected chicken day 8 after infection is shown. (B) TCRα/β+ and TCRγ/δ+ spleenocytes in the same sample as in A after immunomagnetic depletion of TCRγ/δ+ cells. (C) Phenotyping of TCRα/β+ and TCRγ/δ+ spleenocytes, respectively, and detection of blast transformation through mononuclear, singlet, live cell and CD45+ gating using CD45-PerCp/Cy5.5, TCRα/β-Fitc and TCRγ/δ-RPE. A representative spleen sample cultured in medium from an E. tenella-infected chicken day 10 after infection is shown. (D) blast transformation in the same sample as in C after stimulation with E. tenella antigen or (E) after stimulation with Con A. For details see Materials and methods.

Data analysis
Data were analysed as mean values ±95% confidence intervals (CI) and mean values with non-overlapping CI were interpreted as being statistically different. Statistical power calculations were performed in R 3.5.0 with the pwr package using a two-sided t-test with a significance level of 0.05. Experimentally observed means and standard deviations of treatment and control groups were used to calculate the approximate sample sizes needed for 80% power with a hypothetical effect on proliferation of +50%, as well as with the experimentally observed effect size.
Results
Outcome of experimental E. tenella infections
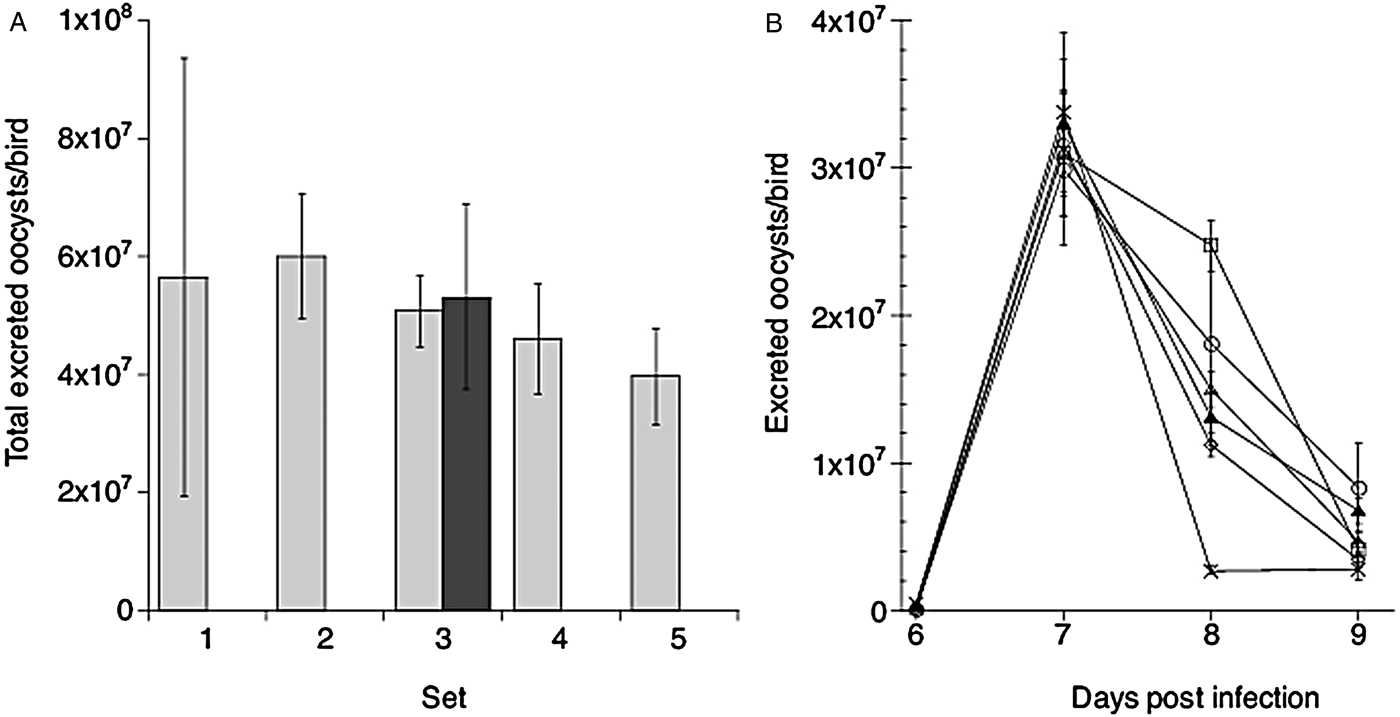
Chickens in all sets were monitored for clinical signs of disease and oocyst excretion in feces. During the daily recording of health status, blood in feces was observed on days 5–6 after E. tenella infection in all sets. No other signs of disease were observed during the experiments. Feces were collected from day 5 to 9 after infection and the mean total excretion during this period was approximately 5 × 10⁷ oocysts per chicken in all five sets of E. tenella infections (Fig. 2A). The 3-fold increase in inoculation dose for half of the birds in set 3 did not have a significant effect on oocyst excretion. Likewise, the kinetics of oocyst excretion (Fig. 2B) was similar in all sets and seemed unaffected by inoculation dose, with peak excretion recorded in feces samples collected on day 7 after infection.
Excretion of oocysts in feces collected from day 5 to day 9 (120–218 h) after experimental infection of chickens with E. tenella. (A) The total number of oocysts excreted per bird from day 5 to day 10 after infection in the five experimental sets. Chickens were inoculated with 1000 oocysts/bird (light grey bars) or with 3000 oocysts/bird (dark grey bars). Results are mean values ± 95% CI for replicate sample preparations, n = 5 for set 1, n = 15 for set 2, n = 9 for each oocyst dose in set 3 and n = 9 in set 4 and set 5, respectively (for details see Materials and methods). (B) Kinetics of oocyst excretion from day 5 to 9 after infection in the five experimental sets; set 1 open circles, set 2 open squares, set 3 open triangles for chickens inoculated with 1000 oocysts/bird and filled triangles for chickens inoculated with 3000 oocysts/bird, set 4 open diamonds and set 5 crosses. Results show the mean number of oocysts excreted per bird from feces collected for 24 h intervals. Note, due to a technical failure results from feces collected day 6 in set 2 are missing.

In sets 3 and 4, caecal lesion scores were determined for chickens killed on day 6 after E. tenella infection according to the scoring system of Johnson and Reid (Reference Johnson and Reid1970). In set 3, caeca from the six chickens inoculated with 1000 oocysts received scores of 1 (n = 3), 2 (n = 1) and 3 (n = 2); mean 1.8, median 1.5, while all caeca from chickens inoculated with 3000 oocysts received a score of 3. In set 4, all chickens were inoculated with 1000 oocysts and caecal lesions were scored to 1 (n = 1), 2 (n = 2), 3 (n = 3); mean 2.3, median 2.5.
Thus, E. tenella infection was established in all five experimental sets and the oocyst excretion did not differ significantly between sets. In set 3, the 3-fold increase in inoculation dose did not affect oocyst excretion but chickens inoculated with the higher dose displayed less variation in mucosal tissue damage than those infected with the standard dose.
Eimeria tenella-induced proliferation of spleen cells – sets 1–4
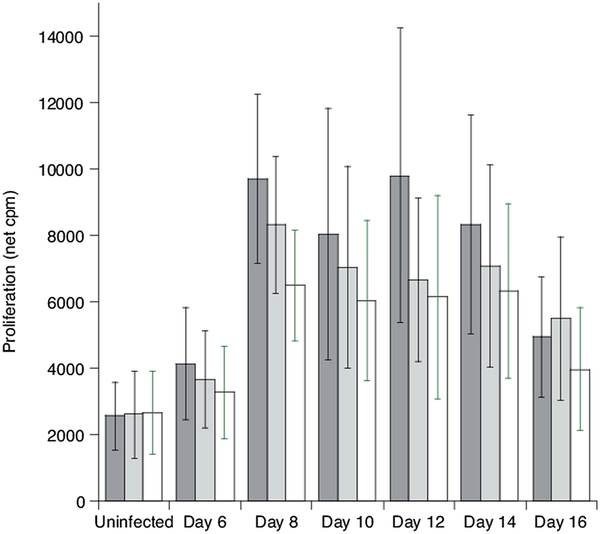
The combined results from all chickens inoculated with 1000 E. tenella oocysts per bird in sets 1–4, where uptake of 3H-tymidine was measured, are shown in Fig. 3. This analysis showed that proliferation was induced upon stimulation with E. tenella sporozoite antigen when using spleen cells collected from chickens on days 8–14 after parasite infection. This proliferative response was significantly higher than proliferation in cultures of spleen cells from uninfected chickens on days 8–14 in cultures stimulated with 5 or 2.5 µg antigen mL−1 and on day 8 for cultures stimulated with 1.25 µg mL−1 antigen. However, large variation was observed between individuals in the magnitude of proliferation, and although significant E. tenella antigen-induced proliferation was observed at least on some days in the days 8–14 ‘window’ in all sets, the days with high proliferative responses varied between sets (as seen in the following sections). Moreover, high background proliferation was often observed in unstimulated/medium controls (examples shown in the following sections), especially in cultures from uninfected chickens. To achieve a statistical power of 80% and the observed effect size (i.e. approximately +300% increase in net proliferation) and variability in cultures stimulated with E. tenella antigen at 5 µg mL−1, treatment and control groups would need to each consist of 7, 21 and 15 birds for analysis on days 8, 10 and 12, respectively. However, the substantial variability observed would make detection of smaller effects difficult; assuming an effect size of +50% with the observed variability and control group mean would require group sizes of 181, 363 and 461 birds to achieve the same power on the respective analysis days.
Proliferation in cultures of spleen cells collected from uninfected chickens (n = 27) or collected from E. tenella-infected chickens at the indicated days (n = 21 on each day) after inoculation with 1000 oocysts per bird (sets 1–4). Cultures were stimulated with E. tenella sporozoite antigen at a concentration of 5 µg mL−1 (grey bars), 2.5 µg mL−1 (light grey bars) or 1.25 µg mL−1 (open bars), respectively, and proliferation was detected by incorporation of 3H-thymindine. Results are mean values ± 95% CI of net cpm values and mean values with non-overlapping CI were interpreted as being statistically different.
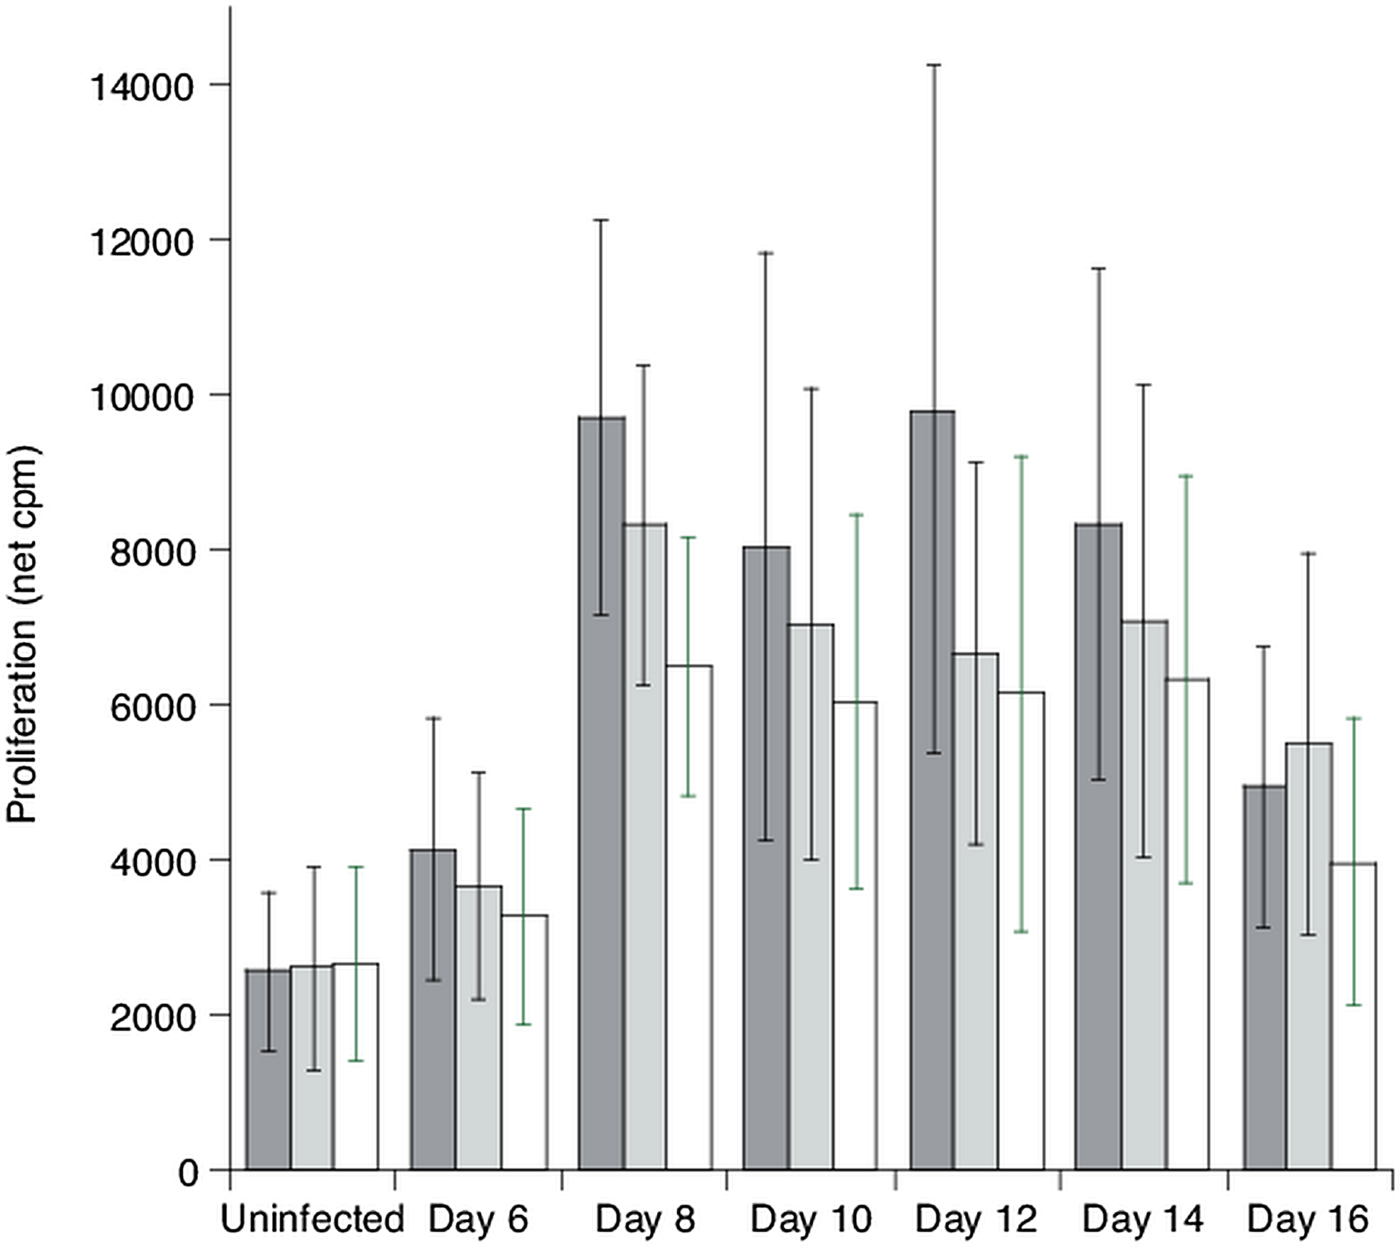
Hence, a significant E. tenella-specific proliferative response was observed upon in vitro stimulation of spleen cells collected from chickens 8 to 14 days after infection if a large enough number of individuals were sampled.
Eimeria tenella-induced proliferation of spleen cells from chickens infected with 1000 or 3000 oocysts per bird – set 3
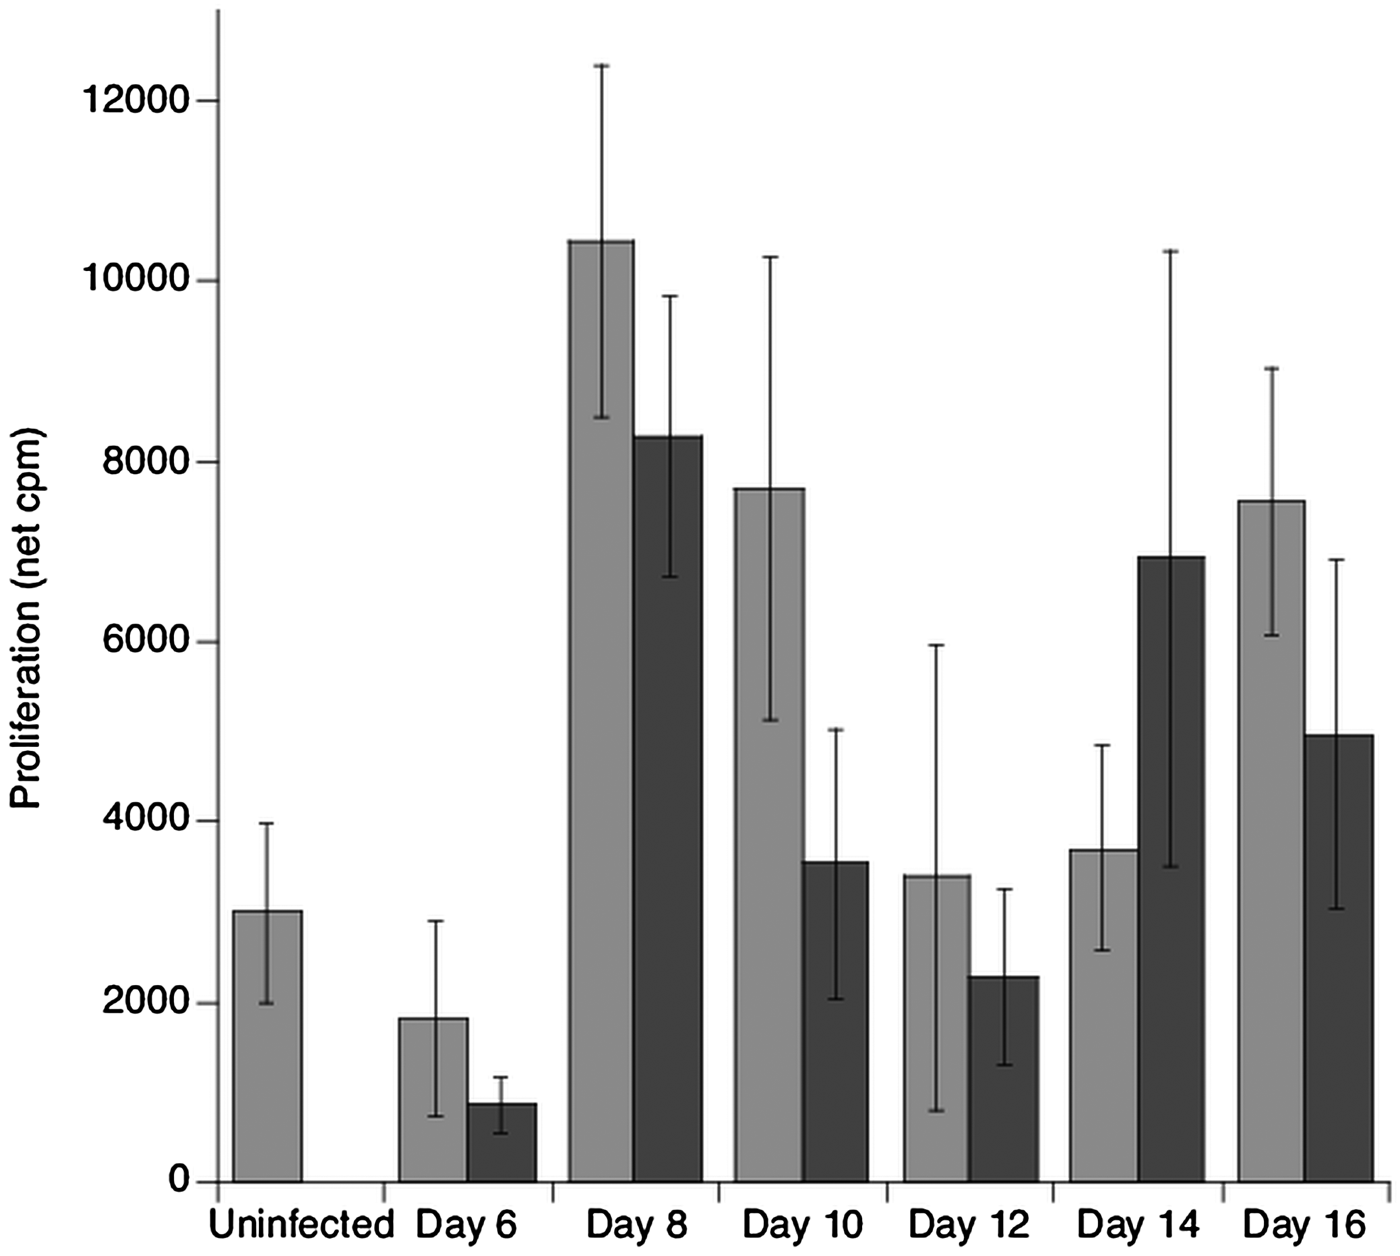
Chickens in this set were infected with the standard 1000, or with 3000 E. tenella oocysts per bird and proliferation of spleen cells upon in vitro antigen stimulation was compared (Fig. 4). In this set, the highest proliferation in response to the sporozoite antigen was recorded on day 8 post E. tenella infection of chickens. However, no consistent effect on the proliferative responses of the three times higher inoculation dose was observed.
Proliferation in cultures of spleen cells collected from uninfected chickens (n = 6) or collected from E. tenella-infected chickens at the indicated days (n = 6 on each day) after inoculation with 1000 (grey bars) or 3000 (dark grey bars) oocysts per bird (set 3). Cultures were stimulated with E. tenella sporozoite antigen at a concentration of 5 µg mL−1. Results are mean values ± 1 standard error of net cpm values.

Depletion of TCRγ/δ+ spleen cells before set up of cultures for E. tenella-induced proliferation – set 4
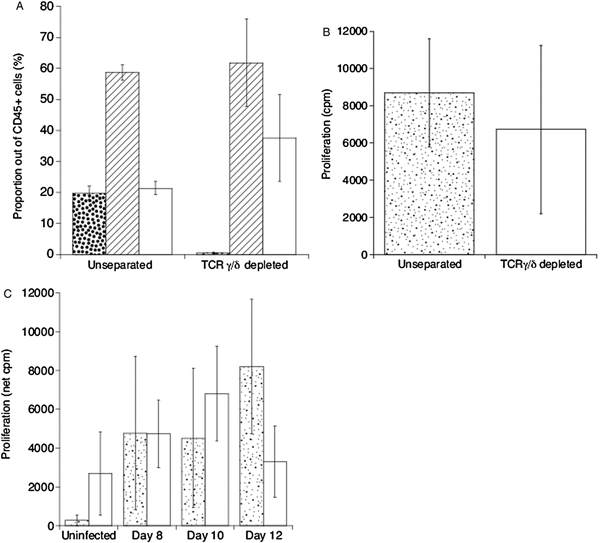
In this set, additional analyses were performed on some spleen samples collected on days 8, 10 and 12 post-infection where immunomagnetic depletion of TCRγ/δ+ spleen cells was performed prior to in vitro induction of proliferation with E. tenella antigen. In these unseparated spleen cell preparations, TCRγ/δ+ cells constituted approximately 20% and TCRα/β+ approximately 60% of CD45+ cells, while approximately 20% of the CD45+ cells were TCR− (Fig. 5A). After the depletion procedure, only approximately 0.5% TCRγ/δ+ cells remained in these cell preparations (Figs 1B and 5A) and proportionally the TCR− population increased most in depleted compared with unseparated cell preparations.
Immunomagnetic depletion of TCRγ/δ+ spleen cells collected from uninfected chickens (n = 3), or collected from E. tenella-infected chickens (n = 9; set 4). (A) Proportions of TCRγ/δ+ (dotted bars), TCRα/β+ (hatched bars) and TCR− (open bars) among CD45+ spleen cells in unseparated and TCRγ/δ+ cell depleted cell preparations. Results are presented as mean of all cell preparations used (n = 12) ± 95% CI. (B) Proliferation (cpm) in unstimulated spleen cell cultures of unseparated and TCRγ/δ + cell depleted cell preparations. Results are presented as mean of all cell preparations used (n = 12) ± 95% CI. (C) Proliferation (net cpm) in cultures of spleen cells collected from uninfected chickens (n = 3) or from chickens at the indicated days (n = 3 on each day) after inoculation with 1000 E. tenella oocysts per bird. Cultures were set up with unseparated (dotted bars) and TCRγ/δ + cell depleted (open bars) cell preparations. Results are presented as mean values ± 1 standard error.

The spontaneous proliferation in unstimulated cultures of unseparated spleen cells from all tested chickens was at a relatively high level, as expected from the result from set 1–3. Although this spontaneous proliferation in mean was slightly lower for TCRγ/δ+ cell depleted cell preparations, it was not significantly different from that of unseparated spleen cells (Fig. 5B).
Spleen cells isolated from three uninfected chickens and E. tenella-infected chickens on days 8, 10 and 12 after infection (n = 3 each day), respectively, were subjected to the depletion of TCRγ/δ+ cells. Results from cultures of these cells showed the highest E. tenella antigen-induced proliferation on day 12 after infection for unseparated spleen cells and on day 10 after infection for TCRγ/δ+ cell depleted spleen cells (Fig. 5C). However, no consistent effect of the depletion of TCRγ/δ+ cells on the parasite-induced proliferation was observed.
Thus, even though near-complete depletion of TCRγ/δ+ cells was achieved, this did not seem to affect either background proliferation or E. tenella-induced proliferation of spleen cells.
Eimeria tenella-induced blast transformation of spleen cells – set 5
In this set, spleen cell cultures were induced with either E. tenella antigen or the mitogen Con A for 72 h and blast transformation was assessed in TCRα/β+ or TCRγ/δ+ cells, respectively. Overall for cells cultured in medium alone, TCRα/β+ cells dominated over TCRγ/δ+ cells among live CD45+ cells after 72 h of culture; TCRα/β+ 53 ± 6% vs TCRγ/δ+ 12 ± 1% (mean values ± 95% CI, n = 24). The proportion of TCRα/β+ cells among live CD45+ cells was not significantly altered in E. tenella antigen or Con A-stimulated cultures. Corresponding proportions of TCRγ/δ+ cells were also unaltered in E. tenella antigen-stimulated cultures but was increased to 27 ± 5% in Con A-stimulated cultures.
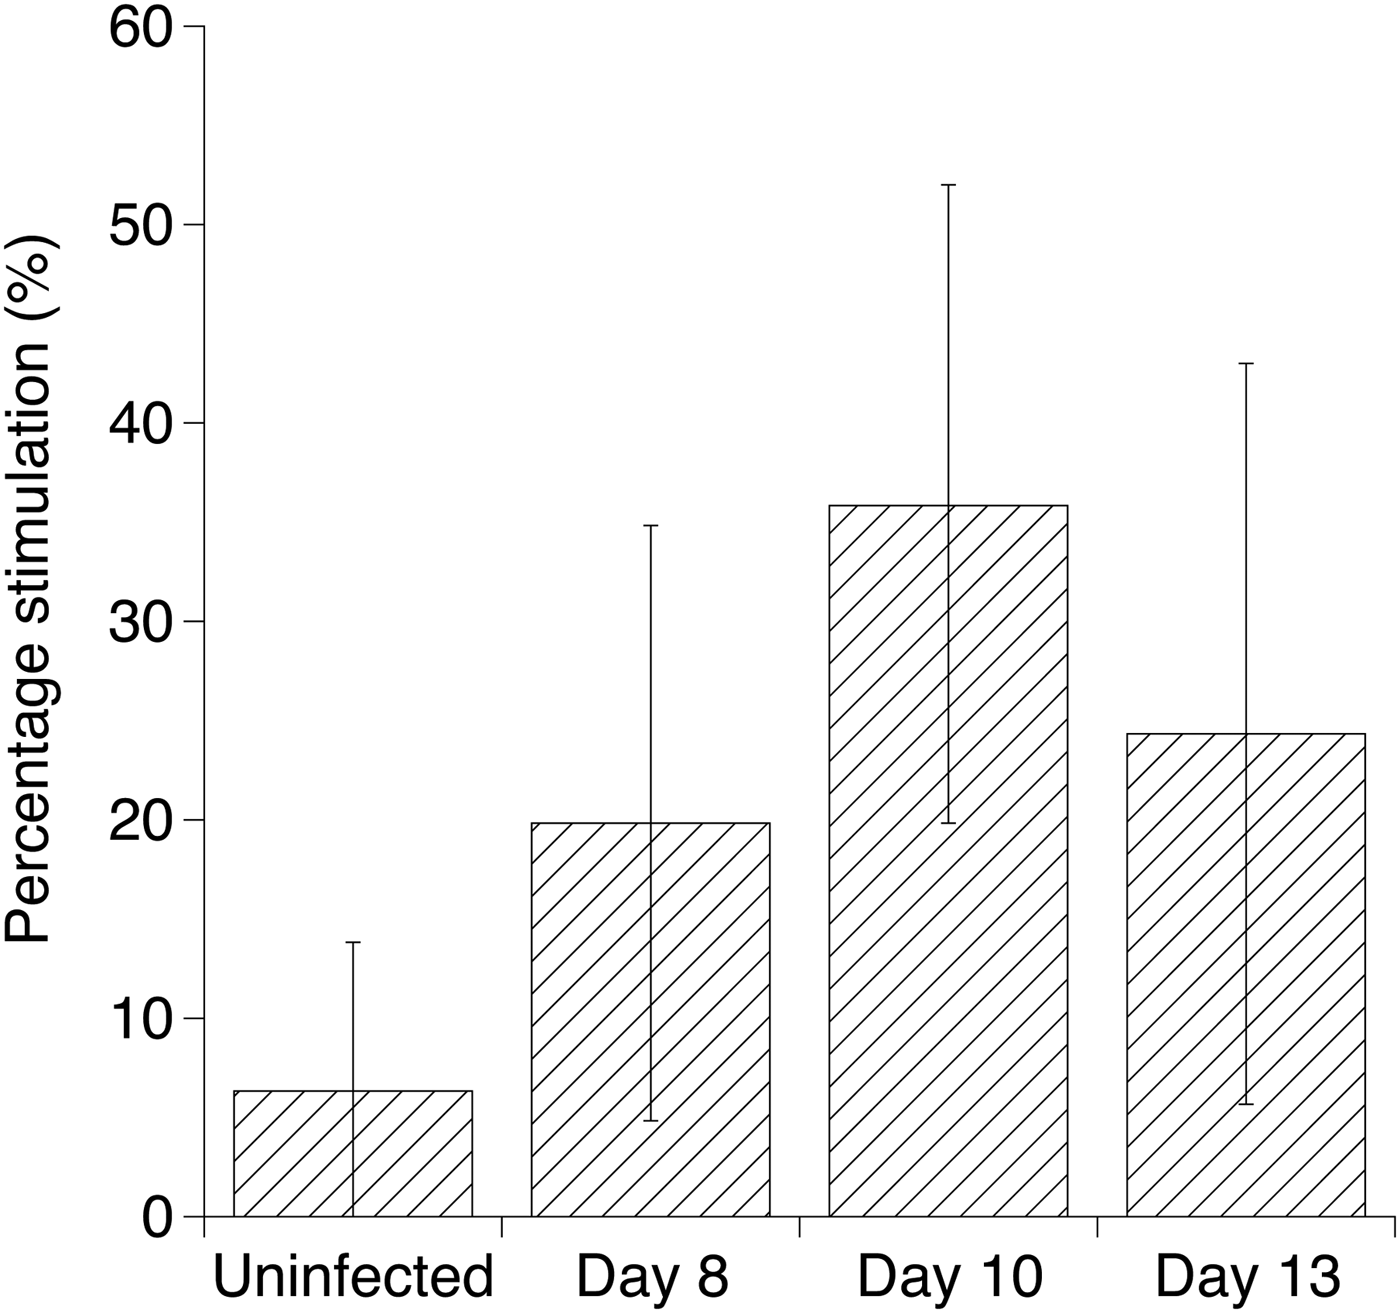
Among TCRα/β+ cells, the proportion of cells with blast characteristics was overall 20 ± 4% for cells cultured in medium alone and was increased to 76 ± 5% upon Con A stimulation in spleen cells from all chickens with a net induction (Con A – medium) of 56 ± 5% (mean values ± 95% CI, n = 24). Upon stimulation with E. tenella sporozoite antigen, the proportion of TCRα/β+ blast cells was significantly increased in spleen cells from chickens day 10 after E. tenella infection both expressed as net induction (data not shown) and as percentage stimulation (Fig. 6) compared with those from uninfected chickens. Among TCRγ/δ+ cells, the proportion of cells with blast characteristics was overall 44 ± 7% for cells cultured in medium alone (mean value ± 95% CI, n = 24). The corresponding value for Con A-stimulated cultures was 64 ± 6% with a mean net induction of 21 ± 5% (mean values ± 95% CI, n = 24). Upon stimulation with E. tenella sporozoite antigen, the net induction of TCRγ/δ+ blast cells was 16 ± 12, 6 ± 5, 3 ± 3 and 16 ± 11% for cells collected from uninfected chickens, and from chickens days 8, 10 and 13 after E. tenella infection, respectively, with five out of 24 chickens not showing an induction above responses in medium cultures. Hence, the E. tenella sporozite protein did not induce any significant antigen-specific blast responses in TCRγ/δ+ spleen cells and due to the low induction of TCRγ/δ+ blasts above those in medium cultures in either E. tenella antigen or Con A-stimulated cultures, the calculation of percentage stimulation was not meaningful.
Blast transformation of TCRα/β + spleen cells in cultures of spleen cells collected from uninfected chickens (n = 6) or collected from E. tenella-infected chickens at the indicated days (n = 6 on each day) after inoculation with 1000 oocysts per bird (set 5). Cells were cultured in growth medium without additives or stimulated with E. tenella sporozoite antigen at a concentration of 5 µg mL−1 or Con A at 20 µg mL−1, respectively. Blast transformation is presented as mean percentage stimulation (Gaines and Biberfeld, Reference Gaines and Biberfeld2000; Svahn et al., Reference Svahn, Linde, Thorstensson, Karlen, Andersson and Gaines2003), calculated as 100 × (proportion of blasts in E. tenella antigen-stimulated cultures – proportion of blasts in medium cultures)/(proportion of blasts in Con A-stimulated cultures – proportion of blasts in medium cultures). Results are mean group values ± 95% CI and mean values with non-overlapping CI were interpreted as being statistically different.

Thus, an E. tenella antigen-induced blast response was observed for TCRα/β+ cells on day 10 after parasite infection while there was no evidence for antigen-specific blast responses in TCRγ/δ+ cells.
Discussion
The present study was undertaken in order to establish methodology to monitor chicken T-cell responses to E. tenella in vitro. The main finding was that E. tenella-specific proliferation could be induced in spleen cell cultures in a ‘window’ from 8 to 14 days after primary parasite infection. This is consistent with results from a number of previous studies where E. tenella-specific proliferation in vitro has been shown on one or multiple occasions in the time interval from 8 to up to 21 days after primary infection in PBMC (Lillehoj, Reference Lillehoj1986; Bumstead et al., Reference Bumstead, Bumstead, Rothwell and Tomley1995; Breed et al., Reference Breed, Dorrestein and Vermeulen1996, Reference Breed, Dorrestein, Schetters, Waart, Rijke and Vermeulen1997a, Reference Breed, Schetters, Verhoeven and Vermeulen1997b) or spleen cells (Huang et al., Reference Huang, Zou, Xu, Ding, Yin, Liu and Suo2011) stimulating with sonicated sporozoite antigen (Bumstead et al., Reference Bumstead, Bumstead, Rothwell and Tomley1995; Breed et al., Reference Breed, Dorrestein and Vermeulen1996, Reference Breed, Dorrestein, Schetters, Waart, Rijke and Vermeulen1997a, Reference Breed, Schetters, Verhoeven and Vermeulen1997b; Huang et al., Reference Huang, Zou, Xu, Ding, Yin, Liu and Suo2011) or whole purified sporozoites or merozoites (Lillehoj, Reference Lillehoj1986). Very similar observations have also been reported for E. maxima (Lillehoj, Reference Lillehoj1986; Bumstead et al., Reference Bumstead, Bumstead, Rothwell and Tomley1995; Talebi and Mulcahy, Reference Talebi and Mulcahy1995) and E. acervulina (Martin et al., Reference Martin, Lillehoj, Kaspers and Bacon1993). Also in some mammalian host species in vitro proliferative responses of immune cells upon stimulation with Eimeria antigen have been observed in this time interval after primary infection, e.g. in cattle infected with E. bovis (Hermosilla et al., Reference Hermosilla, Burger and Zahner1999; Suhwold et al., Reference Suhwold, Hermosilla, Seeger, Zahner and Taubert2010) and in rabbits infected with E. intestinalis (Renaux et al., Reference Renaux, Quere, Buzoni-Gatel, Sewald, Le Vern, Coudert and Drouet-Viard2003). Thus, the conditions used in the current protocol produced results that were clearly compatible with earlier observations and the methodology should be useful for studies of, e.g. vaccine-induced responses to E. tenella.
A drawback with the current protocol was however that high numbers of observations were necessary to achieve clear results. It is for instance not always practical, ethical or economically possible to house large numbers of chickens and to perform repeated samplings in experimental settings. This may be an explanation why the earlier established protocols for in vitro evaluation of Eimeria-specific T-cell proliferation so far not have been widely used. The main reasons for this problem was a large variation between individuals in proliferation responses and high levels of spontaneous background proliferation, particularly in uninfected chickens. A large variation between individuals has also been reported by others for in vitro E. tenella-induced proliferation of chicken PBMC (Breed et al., Reference Breed, Dorrestein and Vermeulen1996, Reference Breed, Dorrestein, Schetters, Waart, Rijke and Vermeulen1997a, Reference Breed, Schetters, Verhoeven and Vermeulen1997b). We therefore conducted additional experiments to pursue some potential means to improve the protocol. One of these was to alter the numbers of oocysts used for infection. Our standard dose of 1000 live E. tenella oocysts per bird was initially chosen as ‘maximally producing dose’ (Williams, Reference Williams2001), optimal for oocyst production to maintain the pure isolate. This dose was tested out to achieve maximum oocyst output in our experimental chickens and higher doses were not expected to give higher oocysts yields, due to the ‘crowding effect’ on parasite replication in the intestinal tissues (Williams, Reference Williams2001). We had however observed that this dose gave lesion scores that varied between individual chickens and hypothesized that differences in parasite replication causing the lesions could give varying exposure of immune cells to E. tenella antigens resulting in varying proliferative responses. Indeed, a 3-fold increase in oocyst dose did as expected not increase the oocyst yield but more consistent lesion scores were observed. This did however not result in more homogeneous proliferative responses. Thus, it seems that massive parasite replication resulting in severe lesions is not a crucial factor for initiation of T-cell responses. This was also in agreement with earlier observations where even low numbers of E. tenella oocysts were sufficient to achieve full or partial immunity to subsequent re-infection (Rose and Long, Reference Rose and Long1962; Leathem and Burns, Reference Leathem and Burns1968; Joyner and Norton, Reference Joyner and Norton1973; Bumstead et al., Reference Bumstead, Bumstead, Rothwell and Tomley1995). Hence, it seems likely that other factors than the parasites, either intrinsic traits of the chickens, e.g. variations in innate or specific immune responsiveness, or/and technical factors, e.g. variations in the proportion of dead cells in spleen cell preparations, were involved in the high variation between individuals. Differences between inbred chicken lines in proliferation by PBMC from naïve as well as infected chickens upon in vitro stimulation with E. tenella antigens have for instance been reported (Lillehoj, Reference Lillehoj1986; Bumstead et al., Reference Bumstead, Bumstead, Rothwell and Tomley1995).
As mentioned, another problem we experienced with the current protocol was high spontaneous background proliferation that also varied between individuals. This is a feature we frequently have encountered with chicken cells (Dalgaard et al., Reference Dalgaard, Norup, Rubbenstroth, Wattrang and Juul-Madsen2010; Norup et al., Reference Norup, Dalgaard, Pedersen and Juul-Madsen2011). In the current system, we additionally tested use of several commercial serum free growth media to try and reduce background proliferation without positive results (data not shown). It has been described that chicken TCRγ/δ+ are easily activated in vitro and may contribute to ‘background’ proliferation when cultured (Dalgaard et al., Reference Dalgaard, Norup, Rubbenstroth, Wattrang and Juul-Madsen2010; Braukmann et al., Reference Braukmann, Methner and Berndt2015). In addition, freshly isolated chicken spleen TCRγ/δ + CD8αβ+ cells showed significant proportions of proliferating cells (Pieper et al., Reference Pieper, Methner and Berndt2008). Indeed, results from the current experiment showed that TCRγ/δ+ cells had a high level of blasting cells in medium cultures compared with TCRα/β+ cells. Moreover, for cattle cells it has also been suggested that TCRγ/δ+ cells have regulatory properties and may suppress antigen-specific responses in in vitro cultures (Hoek et al., Reference Hoek, Rutten, Kool, Arkesteijn, Bouwstra, Van Rhijn and Koets2009). We therefore set up a pilot experiment, set 4, where TCRγ/δ+ cells were removed from cultures to evaluate their effect on background proliferation and E. tenella-induced responses. Our results showed, however, that in the current system TCRγ/δ + cells contributed very little to the background proliferative responses recorded and they did not seem to influence E. tenella-induced responses. In the current spleen cell preparations TCRγ/δ+ cells constituted a fairly small population, approximately 20% of CD45+ cells at setup and approximately 10% after 3 days of culture, which may explain their lack of influence on the total proliferative outcome when removed from the cultures.
In an attempt to achieve clearer results, we also evaluated another approach to monitor E. tenella-specific T-cell responses, i.e. through detection of blast transformation in phenotypically characterized T-cell populations. In the current pilot experiment, we used a very basic characterization of T-cells into TCRα/β+ and TCRγ/δ+ cell subsets. The results on E. tenella-induced blast transformation in TCRα/β+ cells corresponded well with what we had observed for proliferation assessed by 3H-thymidine incorporation, i.e. statistically significant parasite-specific responses were observed on day 10 after infection within the identified ‘window’. Moreover, a large variation between individuals was recorded, and as a result, the E. tenella-induced responses were not prominent on all days within the ‘window’ which is in analogy with what we had observed for proliferation assessed by 3H-thymidine incorporation with this number of chickens in current sets 1–4. These results on E. tenella induction of blast transformation in TCRα/β+ cells and not in TCRγ/δ+ cells and the results on E. tenella-induced proliferation despite depletion of the TCRγ/δ+ cells clearly indicate that TCRα/β+ cells were responsible for the observed E. tenella-induced proliferation of spleen cells. This suggests that the current in vitro system reflects activation of E. tenella-specific classical T-cells and corresponds well with the report suggesting CD4 + CD8α+ cells as the proliferating cells amid E. tenella-stimulated PBMC using blocking with monoclonal antibodies (Breed et al., Reference Breed, Schetters, Verhoeven and Vermeulen1997b). Moreover, this is also in analogy with the early observation that in vivo depletion of TCRα/Vβ 1+ cells abrogated immunity upon re-infection of chickens with E. tenella (Trout and Lillehoj, Reference Trout and Lillehoj1996).
In conclusion, we have set up methodology to monitor the activation of E. tenella-specific T-cells in vitro as a reflection of primary infection responses of chickens. The protocol requires a large number of observations to achieve clear results. However, the use of an activation trait (blastogenisis) in phenotypically identified T-cells populations to detect E. tenella-specific responses showed promise. The use of a more detailed T-cell characterization, including, e.g. CD4 and CD8αβ in addition to TCRα/β and TCRγ/δ, and evaluating more activation markers and cytokine production in the panel may prove the way forward to clearer and more informative results.
Acknowledgements
The authors wish to thank the staff at the animal facilities at the National Veterinary Institute for excellent animal care, David Morrison for chicken sorting and statistical insights, Robert Söderlund for power analysis and Eva-Britt Jakubek, Sofia Magnusson, Anna-Karin Palm and Oranous F. Moeen for expert technical assistance.
Author ORCIDs
Eva Wattrang http://orcid.org/0000-0002-9804-169X
Financial support
This study received financial support from the Swedish Research Council Formas (grant numbers 221-2006-2262, 942-2015-494), the Swedish Farmers’ Foundation for Agricultural Research (grant number H0943179) and Agria Research Fund (grant number 2007/0736).
Conflict of interest
None.