Implications
Energy expenditure (EE) can be estimated based on measurements of respiratory gas exchange. This is traditionally done by indirect calorimetry in respiration chambers. However, the horse has to be confined to the chamber during measurements, which might affect its normal behaviour. Moreover, this technique requires expensive research facilities and skilled personnel. The minimal invasive stable isotope 13C technique for measuring EE in the field was evaluated successfully in ponies. The present study developed this technique further and the results provide new information on how it can be used under field conditions.
Introduction
Energy expenditure (EE) of animals and humans is affected by both physiological and environmental factors. Nutrient and energy requirements for different types of horses in different physiological stages have been published, for example, NRC (2007). Traditionally, EE is measured by the use of indirect calorimetry (IC), which is considered as the ‘gold standard’ method for estimating EE in both animals and humans (Blaxter, Reference Blaxter1989). By IC, the oxygen (O2) consumption and carbon dioxide (CO2) production are continuously measured and by that, when assuming that the energy lost in methane (CH4) and urine was negligible, the EE can be calculated according to Brouwer Reference Brouwer(1965). However, the use of IC requires confinement of the horse to a respiration chamber and this might affect the normal behaviour of the horse.
As an alternative, the EE can be estimated by the use of stable isotope techniques, which allow for measurements under free-living conditions with minimal interference with the animal (Junghans et al., Reference Junghans, Voigt, Jentsch, Metges and Derno2007). These techniques include the doubly labelled water (DLW) method and the 13C-bicarbonate technique (13C-BT). The DLW method is relatively expensive because of the high cost of the isotope 18O. Moreover, the DLW method is not appropriate in short-term experiments because of its slow rate of isotope elimination, resulting in a long measuring period of days or weeks (Butler et al., Reference Butler, Green, Boyd and Speakman2004). The 13C-BT is based on 13C kinetics in expired CO2 after administration of 13C-labelled sodium bicarbonate (NaH13CO3). The isotope ratio between 13C and 12C in samples of expired CO2 can be used for the calculations of the CO2 production rate (Elia, Reference Elia1991). In contrast to DLW, the 13C-BT has a faster elimination rate of 13C, which enables a short measuring period varying from minutes to hours, depending on the body size of the subject (Junghans and Chwalibog, Reference Junghans and Chwalibog2001).
The 13C-BT has successfully been used to estimate EE in humans (Junghans et al., Reference Junghans, Jentsch and Derno2008) and different animal species, including goats (Junghans et al., Reference Junghans, Derno, Gehre, Höfling, Kowski, Strauch, Jentsch, Voigt and Henning1997; Prieto et al., Reference Prieto, Lachica, Nieto and Aguilera2001), bulls (Junghans et al., Reference Junghans, Voigt, Jentsch, Metges and Derno2007), dogs (Larsson et al., Reference Larsson, Jensen, Junghans and Tauson2014) and it has been validated against IC in ponies (Jensen et al., Reference Jensen, Larsson, Junghans and Tauson2015). Administration of 13C-bicarbonate has been done as a single intravenous (IV) bolus dose (Junghans et al., Reference Junghans, Voigt, Jentsch, Metges and Derno2007; Jensen et al., Reference Jensen, Larsson, Junghans and Tauson2015) or by continuous IV infusion (Prieto et al., Reference Prieto, Lachica, Nieto and Aguilera2001; Urschel et al., Reference Urschel, Smith, Drake, Harris and Geor2009). However, oral administration of 13C-bicarbonate has also been used (Junghans et al., Reference Junghans, Jentsch and Derno2008; Larsson et al., Reference Larsson, Jensen, Junghans and Tauson2014; Jensen et al., Reference Jensen, Larsson, Junghans and Tauson2015), meaning that the 13C-BT may be used as a non-invasive method for measuring CO2 production and hence EE.
Feeding and diet composition will influence the measurements of EE (Vermorel et al., Reference Vermorel, Vernet and Martin-Rosset1989). Therefore, the main objective of the present study was to clarify at what time point in relation to feeding it is most appropriate to measure CO2 production and hence estimating EE with the 13C-BT. Furthermore, it was the aim to determine if oral administration of 13C-bicarbonate gave as accurate results as IV administration in ponies.
Material and methods
Experimental design
The experimental procedures followed the Danish National Legislation and guidelines approved by the member States of the Council of Europe for the protection of vertebrate animals (Anonymous, 1986). All measurements took place in respiration chambers to compare IC with the 13C-BT for estimation of CO2 production and EE. The ponies were fed 3 h before (T −3), at the same time (T 0) or 3 h after (T +3) measurements started to study the effect of feeding time in relation to measurements of CO2 production and EE. IV and oral administration of 13C-bicarbonate were compared to evaluate if administration route affected the results. Each pony was then measured twice (IV and oral) at each of the different feeding times (T −3, T 0 and T +3) giving a total of six measurements per pony. Before the experiment started, the ponies were trained to walk in and out of the respiration chambers as well as to stay in them. During the experimental period, they were measured every second day in the chambers.
Animals and management
Four Shetland ponies, one stallion (5 years old) and three mares (3 years old), with an average BW of 160±17 kg (weighed each week on a weigh bridge) were recruited from private owners, and returned after the experiment. The ponies were housed in individual 3×3 m stalls with wood shavings as bedding. The average temperature in the barn was 11.7±1.2°C (measured daily at 1100 h). The ponies were allowed access to a paddock for about 4 h 2 to 3 days a week during the experiment. The ponies were fed 6 kg haylage per day (chemical composition: dry matter: 60%; in % of dry matter analysed by NIRS: ash: 8.5%; NDF: 64.1%; ADF: 36.2%: crude fibre: 31.8%; CP: 8.7% sugars: 8.0% (BLGG AgroXpertus, Vejen, Denmark)) divided into two meals and they had free access to water at all time.
Collection of data
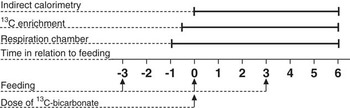
The ponies were placed in open-air-circuit respiration chambers (volume: 3.5 m3, floor area: 1.7 m2, air flow: 6000 l/h) for determination of CO2 production and O2 consumption in the morning 1 h before measurements started (Figure 1). Construction and function of the chambers have been described previously by Chwalibog et al. (Reference Chwalibog, Tauson and Thorbek2004). The temperature in the respiration chambers was ∼16°C during the measurements. An 13C/12C isotope ratio infrared spectrometer (IRIS; Wagner Analysen Technik GmbH, Bremen, Germany) was connected to the respiration chambers and samples of chamber air were taken when CO2 concentration had stabilized after ∼30 min for determination of baseline 13C to 12C ratio before administration of 13C-bicarbonate. The concentrations of O2 and CO2 in the outgoing air from the respiration chambers were recorded automatically every third minute and the 13C to 12C ratio was measured by the IRIS analyser every 5 to 6 min. The measurements continued for 6 h after administration of 13C-bicarbonate.
The experimental setup used in the present experiment: feeding 3 h before (T −3), at the same time (T 0) or 3 h after (T +3) administration of an IV or oral dose of 13C-bicarbonate. Ponies were placed in respiration chambers 1 h before administration of the dose of 13C-bicarbonate, and the 13C enrichment in breath CO2 was measured 30 min before (baseline) and until 6 h after administration of the dose of 13C-bicarbonate. The CO2 production and O2 consumption were measured by indirect calorimetry for 6 h.

The ponies were given 2 mg 13C-labelled sodium bicarbonate (NaH13CO3; 98 atom % 13C; Hanseaten-Apotheke, Bremen, Germany) per kg BW. For oral administration, the dose of 13C-bicarbonate was dissolved in a sugar solution (∼10 ml) and was given as far back as possible in the mouths of the ponies. For IV administration, the dose of 13C-bicarbonate was dissolved in a sterile isotonic saline solution (50 mg NaH13CO3/ml saline) and injected directly into the jugular vein. The chamber was quickly opened and the 13C-bicarbonate was given inside the respiration chamber for oral administration, while when the IV injection was used, the ponies were quickly taken out of the respiration chambers and administered the 13C-bicarbonate and then immediately returned to the respiration chambers.
The ponies were fed at three different time points (T −3, T 0 and T +3) in relation to the measurements to study the effect of feeding on CO2 production and hence the estimate of EE. The ponies were fed in their individual stalls 3 h before administration of 13C-bicarbonate (T −3), or the respiration chamber was opened briefly when the ponies were fed simultaneously with (T 0) or 3 h after (T +3) administration of 13C-bicarbonate (Figure 1).
Calculations
The mean O2 consumption (RO2) and CO2 production (RCO2; l/day) measured by IC during the 6 h were converted to l/kg BW per h or extrapolated to 24 h (l/kg BW per day), as was the respiratory quotient (RQ). EE (kJ/day) was calculated according to Brouwer Reference Brouwer(1965):
 $$\eqalignno{\rm EE\,\left( {{{kJ} \over {day}}} \right)= & 5.02 {\times} R \rm CO_{{2 }} {\plus} 16.18 {\times} {\it R} O_{{2 }} {\minus} 2.17{\times} {\it R}CH_{{4 }} \cr & {\minus} 5.99{\times} {\it R}{{\rm N_U}} $$
where RNU is urinary nitrogen excretion (g N/day) and RCH4 is the methane production (l/day). However, urine excretion and methane production are not estimated with the 13C-BT, and therefore both were omitted from the equation as the contribution of each normally is smaller than 1% (Vermorel et al., Reference Vermorel, Vernet and Martin-Rosset1997; Junghans et al., Reference Junghans, Voigt, Jentsch, Metges and Derno2007).
The ratio between 13C to 12C in breath CO2 was converted to the delta value of 13C (δ 13C, ‰). Thereafter, the δ 13C data were converted into the 13C abundance (A, ppm) by the following equation:
 $$A\,(\rm ppm)={{{\it R}\left( {{{\delta ^{{13}} \rm C} \over {1000{\plus}1}}} \right)} \over {1{\plus}{\it R}\left( {{{\delta ^{{13}} \rm C} \over {1000{\plus}1}}} \right)}}{\times}10^{6} $$
where R is the ratio of 13C to 12C of the international Pee Dee Belemnite (PDB) standard (R=0.0112372) and δ 13C is the relative 13C to 12C ratio of the samples collected every 5 to 6 min from the respiration chambers. The 13C enrichment (E, ppm) of CO2 was calculated as follows:
 $$E\,{(\rm ppm)}=A_{t} {\minus}A_{0} $$
where A t is the 13C abundance of the sample at the time t (min) after administration of 13C-bicarbonate, and A 0 is the abundance before administration of 13C-bicarbonate. The RCO2 (mol/min) was calculated from the 13C data by means of equation (3) (Elia, Reference Elia1991):
 $$R{\rm CO_{2}} \,\left( {{{\rm mol} \over {\rm min}}} \right)={D \over {\rm AUC}}{\times}{\rm RF}$$
where D is the dose of administered 13C-bicarbonate (mol), AUC is the area under the 13C enrichment-time curve (ppm·min) and recovery factor (RF) is the fractional recovery of labelled CO2 (13CO2) in breath. The RF was calculated by means of equation (5), where RCO2(IC) is the CO2 production measured by IC:
 $$\rm RF={{{\it R}CO_{{2(IC)}} } \over {\it D/ {\rm AUC}}}$$
To express CO2 production (l/day), the following equation was used:
 $${\it R}{\rm CO_{2}} \,\left( {{l \over {\rm day}}} \right)={{(D/{\rm AUC}) {\times} 60{\times} 24} \over {85 {\times}10^{{{\minus}3}} }}{\times} 22.4{\times}{\rm RF}$$
where 85 g/mol is the molar mass of NaH13CO3 and 22.4 l/mol is the volume of 1 mol gas produced. The EE (kJ/day) was estimated by use of equation (7) (Junghans et al., Reference Junghans, Voigt, Jentsch, Metges and Derno2007):
 $$\rm EE\,\left( {{{kJ} \over {day}}} \right)=5.02{\times}{\it R}CO_{{2 }} {\plus} 16.18{\times} {{{\it R}CO_{2} } \over {RQ}}$$
where RO2 was substituted by RCO2/RQ as the 13C-BT does not estimate O2 consumption and RQ is the RQ measured by IC.
Area under the 13C enrichment-time curve
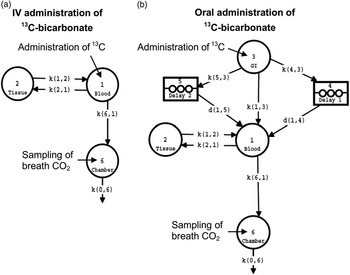
The AUC is the basis for the determination of CO2 production and can be calculated by modelling the 13C enrichment-time curve using the compartmental modelling module in SAAM II software (Barrett et al., Reference Barret, Bell, Cobelli, Golde, Schumitzky, Vicini and Foster1998). Each model varies depending on the specific experimental situation and hence the number of compartments differs. The models, shown in Figure 2, mimic the two experimental situations occurring in the present study: respiration chamber and IV administration of 13C-bicarbonate (Figure 2a), and respiration chamber and oral administration of 13C-bicarbonate (Figure 2b).
The compartmental models used for analysing the 13C excretion in breath CO2 after (a) intravenous (IV) or (b) oral administration of 13C-bicarbonate. Compartments and delay elements: 1: bicarbonate in blood and well-perfussed tissues; 2: bicarbonate in less well-perfused tissues and carbon in long-lived compounds; 3: gastrointestinal tract; 4: delay 1; 5: delay 2; 6: respiration chamber; k(j,i): rate constants from compartment i to j; d(j,i): auxiliary parameters (detailed in the SAAM II software).

Each circle in Figure 2 represents a compartment where the 13C can be localized, that is, blood, tissues and other body compounds such as protein, fat, etc., gastrointestinal (GI) tract or respiration chamber, the arrows represent the transfer of 13C between the compartments and the 13C excretion from the system. In the model with oral administration of 13C-bicarbonate, two delay elements were included to improve the fit of the curve as the excretion of 13C was not as smooth with oral administration as with IV administration. By adding the delay elements, it was possible to model the differently delayed absorption of 13C from the GI tract.
Statistical analyses
All statistical analyses were performed using PROC MIXED in SAS® (Version 9.3, SAS Institute Inc., Cary, NC, USA). The measurements of O2 consumption (l/kg BW per h), CO2 production (l/kg BW per h) and RQ for 1 h intervals in the respiration chamber were analysed as repeated measurements. The model comprised the fixed effect feeding (T −3, T 0 or T +3) and time (1 to 6 h) and the random effect of pony. Serial correlation over time was modelled using a spatial Gaussian correlation structure.
Feeding time (T −3, T 0 or T +3) and administration route of 13C-bicarbonate (IV or oral) were included in the model as fixed effects and pony as random effect, when the response variables were mean O2 consumption (l/kg BW per day), CO2 production (l/kg BW per day), RQ or RF. For the analysis of the EE data the model comprised the fixed effect of feeding (T −3, T 0 or T +3), method (IC or 13C-BT), their interactions and the random effect of pony.
Results are presented as least square means (LS means) with 95% confidence intervals. Pairwise comparisons were made using the PDIFF option, and effects were considered significant if P<0.05 and a tendency if P<0.10. The Bland–Altman plot was also used to compare the CO2 production measured by IC and the 13C-BT. The difference between the paired measurements was plotted against the average of the paired measurements. The 95% confidence interval is the expected range of the difference between measurements in which 95% of the measurements will lie (Bland and Altman, Reference Bland and Altman1983).
Results
All ponies accepted the experimental procedures. However, one measurement with IV and two with oral administration of 13C-bicarbonate were excluded due to technical problems with the respiration chambers.
Measurements of CO2 production, O2 consumption and RQ
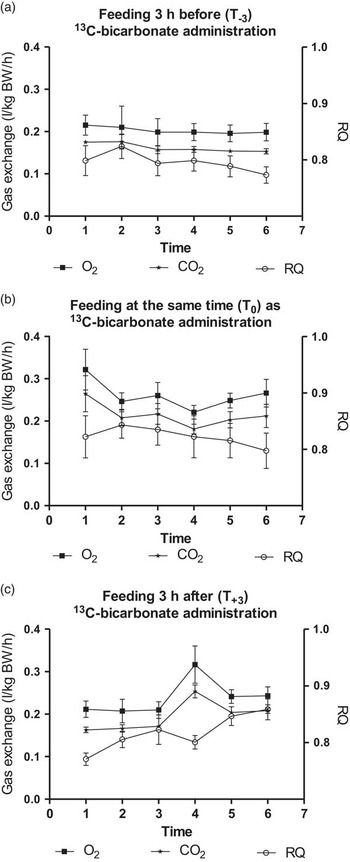
An interaction between feeding and time was present for CO2 production (P<0.001), O2 consumption (P<0.001) and RQ (P<0.01) as shown in Figure 3. Feeding 3 h before administration of 13C-bicarbonate resulted in a more stable CO2 production, O2 consumption and RQ during the 6 h of measurements (Figure 3a) than when feeding at the same time (Figure 3b) or 3 h after (Figure 3c) administration of 13C-bicarbonate. The CO2 production and O2 consumption were highest the 1st hour after feed was offered as shown in Figure 3b (at time 1 h) and Figure 3c (at time 4 h).
Effect of feeding 3 h before (T −3), at the same time (T 0) or 3 h after (T +3) a dose of 13C-bicarbonate on O2 consumption (l/kg BW per day), CO2 production (l/kg BW per day) and respiratory quotient (RQ) measured hourly by indirect calorimetry for 6 h.

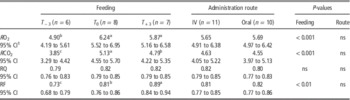
The mean CO2 production (P<0.001) and O2 consumption (P<0.001), but not the RQ, were lower when feeding 3 h before than feeding at the same time or 3 h after administration of 13C-bicarbonate as shown in Table 1. There was no effect of administration route on the mean CO2 production, O2 consumption or RQ. An average RQ of 0.81 was therefore used in equation (7) when calculating EE measured with the 13C-BT.
The effect of feeding 3 h before (T −3), at the same time (T 0) or 3 h after (T +3) 13C-bicarbonate administration, and the effect of administration route (IV or oral) of 13C-bicarbonate on O2 consumption (RO2; l/kg BW per day), CO2 production (RCO2; l/kg BW per day), respiratory quotient (RQ) and recovery factor (RF) measured by indirect calorimetry in respiration chambersFootnote 1

a,b,cValues in the same row with different notations are significantly different (P<0.05).
1 Values are presented as least square means with 95% confidence intervals (CI).
The 13C enrichment of breath CO2
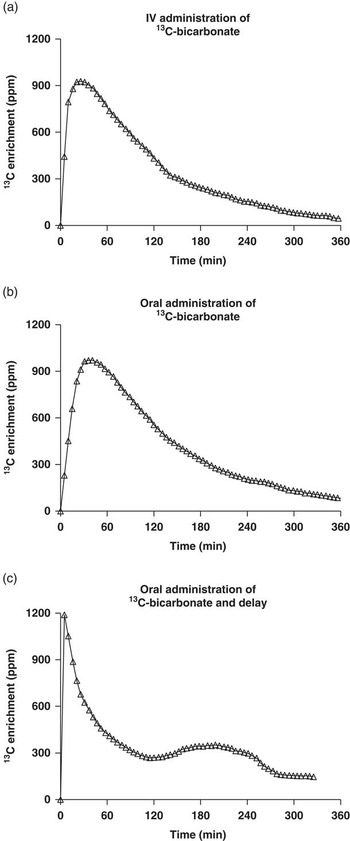
Examples of the 13C enrichment-time curves with IV and oral administration are presented in Figure 4a and b, respectively. The examples show that when 13C-bicarbonate was administered IV the peak occurred ∼20 min after administration, while the peak occurred later when oral administration was used. Thus, the peak value on the 13C enrichment-time curve occurred faster with IV administration. Baseline values were reached after ∼6 h in the respiration chamber. However, occasionally with oral administration the 13C enrichment-time curves were ‘bumpy’, that is, it showed several maxima or shoulders and it took longer time to return to baseline values as shown in Figure 4c.
Examples of 13C enrichment-time curves after (a) intravenous (IV) or (b) oral administration of 13C-bicarbonate, (c) an example of a bumpy 13C enrichment-time curve after oral administration of 13C-bicarbonate.

The 13C enrichment-time curves were modelled by the SAAM II software, which also enables to calculate the AUC and to estimate RF by means of equation (4). Feeding (P<0.01), but not administration route of 13C-bicarbonate, was found to affect the RF as shown in Table 1. This resulted in three different RF (0.73 for T −3, 0.81 for T 0 and 0.89 for T +3), and each of them was used in equation (6) when calculating CO2 production depending on when the pony had been fed.
Bland–Altman analysis of CO2 production
A Bland–Altman plot was used to illustrate the agreement between the two methods (IC and 13C-BT) for measuring CO2 production. The difference between IC and the 13C-BT was plotted against the average of the two methods, as illustrated at Figure 5. All data points were within the 95% confidence interval (mean±2 s.d.: −3.1±105.3 l/day), and thereby showed excellent agreement between the two methods independent of administration route of 13C-bicarbonate.
Bland–Altman plot of CO2 production (RCO2; l/day) measured with the 13C-bicarbonate technique (13C-BT) and indirect calorimetry (IC). The y-axis denotes the difference between the two methods (mean±2 s.d.: −3.1±105.3 l/day), and the x-axis the average of the two methods. The dotted lines represent the 95% confidence interval. The open (○) and closed (●) circles represent oral and intravenous administration of 13C-bicarbonate, respectively.

Energy expenditure
The EE of each pony was estimated by means of equation (6) using an average RQ of 0.81, and the respective RF (0.73 for T −3, 0.81 for T 0 and 0.89 for T +3). The ponies differed in size and BW and therefore the estimated EE was adjusted to metabolic body size (BW0.75). The estimated EE measured by both IC and the 13C-BT are shown in Figure 6. There was no effect of method, but there was an effect of feeding (P<0.001) and EE was lowest when the ponies were fed 3 h before (347 kJ/kg BW0.75 per day), highest when fed at the same time (454 kJ/kg BW0.75 per day) and intermediate when fed 3 h after (424 kJ/kg BW0.75 per day) administration of 13C-bicarbonate.
Energy expenditure (EE; kJ/kg BW0.75 per day) measured with the 13C-bicarbonate technique (13C-BT) and indirect calorimetry (IC) when feeding 3 h before (T −3), at the same time (T 0) or 3 h after (T +3) administration of a dose of 13C-bicarbonate. Bars with different notations are significantly different (P<0.05). The lines represent the 95% confidence interval.

Discussion
The present experiment is the first to examine the effect of feeding on CO2 production and EE in equines using the 13C-BT. These findings are of importance for standardization of the 13C-BT measurements so that the method can be used in the field. Measurements in the field are based on spot sampling of breath air with a mask and breath bags before and after 13C-bicarbonate administration as described by Jensen et al. (Reference Jensen, Larsson, Junghans and Tauson2015). During the measurements in this study, not all ponies consumed the hay that was offered in the respiration chambers, and it was previously found that confinement of ponies in respiration chambers may affect their natural behaviour, and it was suggested that nutritional influences on the measurements of CO2 production and EE could be avoided in fasted animals (Jensen et al., Reference Jensen, Larsson, Junghans and Tauson2015). The present results clearly demonstrated that feeding affects the CO2 production and EE and highlights that feeding must be standardized when measurements are performed in the field.
The 13C-BT only estimates the CO2 production and therefore an estimate of RQ is necessary to calculate EE. In previous studies, RQ values were found to be 0.85 in fasted humans (Junghans et al., Reference Junghans, Jentsch and Derno2008) and in fasted bulls (Junghans et al., Reference Junghans, Voigt, Jentsch, Metges and Derno2007). For ponies fed simultaneously with administration of 13C-bicarbonate (similar to T 0 in this study) RQ values of 0.79 were found, independent of administration route (IV or oral; Jensen et al., Reference Jensen, Larsson, Junghans and Tauson2015). This is in agreement with the present results, where an average RQ of 0.81 was found regardless of administration route. The average RQ must be estimated better than with 10% error to avoid erroneous estimation of EE (Junghans et al., Reference Junghans, Jentsch and Derno2008). An error of +0.1 in absolute RQ units (if the ‘true’ RQ is assumed to be 0.81) would underestimate EE with 8.5% in the present experiment, which is in accordance with Junghans et al. (Reference Junghans, Voigt, Jentsch, Metges and Derno2007) and Jensen et al. (Reference Jensen, Larsson, Junghans and Tauson2015), who, with a similar error in RQ, estimated the error in EE to be 8% to 9% in bulls and ponies, respectively. To reduce factors influencing RQ, Jensen et al. (Reference Jensen, Larsson, Junghans and Tauson2015) suggested that feeding the animals immediately before and during measurements ought to be avoided in future studies. In the present experiment, the mean RQ was not affected by time of feeding and the RQ remained stable when the ponies were fed 3 h before administration of 13C-bicarbonate. In this study and in that by Jensen et al. (Reference Jensen, Larsson, Junghans and Tauson2015), the ponies were fed forage only. Feeding mixed rations might affect the RQ (Jansson et al., Reference Jansson, Nyman, Lindholm and Lindberg2002), and the effect of dietary composition on RQ requires further studies.
In addition to RQ, the 13C-BT also requires an estimate of RF to calculate EE. Previous studies have reported the RF to be between 0.69 and 0.77 (Prieto et al., Reference Prieto, Lachica, Nieto and Aguilera2001; Junghans et al., Reference Junghans, Voigt, Jentsch, Metges and Derno2007; Junghans et al., Reference Junghans, Jentsch and Derno2008; Larsson et al., Reference Larsson, Jensen, Junghans and Tauson2014) or as high as 0.94 in dogs that were stressed/active during the measurements (Larsson et al., Reference Larsson, Jensen, Junghans and Tauson2014). In the present experiment, administration route did not affect the RF in contrast to the results by Jensen et al. (Reference Jensen, Larsson, Junghans and Tauson2015), where IV and oral administration of 13C-bicarbonate resulted in RF values of 0.69 and 0.76, respectively. However, feeding time affected the RF significantly (0.73 for T −3, 0.81 for T 0 and 0.89 for T +3). The inconsistency in RF may be explained by differences among measured subjects (humans or animals), nutritional state, behaviour and method for administration of 13C-bicarbonate. An error of +0.1 in absolute RF units, assuming that the ‘true’ RF is 0.73, would overestimate the EE with 12% in the present experiment, which illustrates how much an inaccurate estimation of RF influences the results. Both the RF and the RQ are needed in the estimation of EE, and the larger variation in RF than RQ, underlines the importance of using a correct estimate for RF in future experiments. It is clear that the RF is affected by factors such as feeding time in relation to 13C-bicarbonate administration (this study), and administration route of 13C-bicarbonate (Jensen et al., Reference Jensen, Larsson, Junghans and Tauson2015). Measurement of actual CO2 production by IC simultaneously with the 13C-BT is necessary for estimating RF accurately. Not all factors affecting the RF can be studied in the respiration chamber (e.g. the effect of locomotor activity) but some factors can (e.g. feeding and administration route of the isotope). The factors that can be controlled should be studied further to improve the estimate of RF to be used under free living conditions.
The Bland–Altman plot showed excellent agreement between methods and confirmed that CO2 production can be measured accurately with the 13C-BT and that the results were not affected by administration route of 13C-bicarbonate. However, time of feeding affected CO2 production measured hourly by IC. When the ponies were fed simultaneously with (T 0) and 3 h after (T +3) administration of 13C-bicarbonate (Figure 3), the CO2 production varied clearly with time, which demonstrates how the heat increment of feeding influences the CO2 production. When the ponies were fed hay, the CO2 production increased on average by 47% in the present experiment, which is in agreement with Vermorel et al. (Reference Vermorel, Vernet and Martin-Rosset1989) where EE increased by 45% when horses were fed hay. Dansen et al. (Reference Dansen, Pellikaan, Hendriks, Dijkstra, Jacobs, Everts and van Doorn2015) measured higher EE values at or directly after feeding time, however, it was suggested that this was related to increased locomotion and attentiveness in relation to feeding. The heat increment of feeding is considered to be the main reason for the increased EE measured in this study when feeding the ponies in the respiration chamber, as the space did not allow for much movement in the respiration chambers.
Our data also showed that EE was affected by time of feeding and was lowest when the ponies were fed 3 h before (347 kJ/kg BW0.75 per day), highest when fed at the same time (454 kJ/kg BW0.75 per day) and intermediate when fed 3 h after (424 kJ/kg BW0.75 per day) administration of 13C-bicarbonate. There was no effect of method (IC or 13C-BT) on EE estimates, and the 13C-BT was sensitive enough to detect the effects of time of feeding. Similar values of EE were measured by IC over 24 h in four Welsh ponies (233±11 kg BW) fed two iso-energetic diets of hay or hay supplemented with concentrate and EE was 482 and 451 kJ/kg0.75 per day (Dansen et al., Reference Dansen, Pellikaan, Hendriks, Dijkstra, Jacobs, Everts and van Doorn2015). Likewise, the EE value of 435 kJ/kg BW0.75 per day, measured in four ponies (178±46 kg BW) fed simultaneously with administration of 13C-bicarbonate (similar to T 0; Jensen et al., Reference Jensen, Larsson, Junghans and Tauson2015) corroborates with the value of 454 kJ/kg BW0.75 per day in the present experiment.
As pointed out above, our data showed that administration method had no effect on RQ, CO2 production and EE, but had significant effect on RF. Presumably, there are no concerns regarding IV administration as it was easy to ensure that the entire dose was injected into the bloodstream. However, oral administration may give some concerns. In the present experiment and in a previous experiment (Jensen et al., Reference Jensen, Larsson, Junghans and Tauson2015), 13C-bicarbonate was administered in a sugar solution to ponies. Although the ponies accepted the sugar solution in both experiments, it was not possible to make sure that the entire dose reached the stomach of the pony. Oral administration has been successfully used in humans, which drank the dose in a water solution (Junghans et al., Reference Junghans, Voigt, Jentsch, Metges and Derno2007) and in dogs which were given the dose in a small piece of meat (Larsson et al., Reference Larsson, Jensen, Junghans and Tauson2014). Although the 13C-BT has potential of being completely non-invasive, the practical aspects of oral administration for equines need to be considered further.
Furthermore, the oral administration occasionally caused bumpy 13C enrichment-time curves (Figure 4c). This may be due to delayed absorption of 13C-bicarbonate causing one or more peaks/shoulders, a phenomenon not observed with IV administration of the dose. Nevertheless, it was possible to fit the data points to a compartment model with delay elements by the SAAM II software, when using oral administration and calculate the AUC of the bumpy curves. Samples were collected every 5 min when the ponies were in the respiration chambers and it was possible to follow the 13C enrichment-time curve accurately even if the curves were bumpy. However, it is not possible to predict the complex shape of each individual 13C enrichment-time curve and therefore it can be challenging when measuring in the field to collect samples at correct time points allowing for accurate modelling of bumpy 13C enrichment-time curves. Therefore, IV administration of 13C-bicarbonate is recommended in future studies.
Acknowledgements
The authors would like to express their gratitude to Janny Sørensen and Stine Mandrup Andreasen for lending their ponies, and to Abdalla Ali for providing technical assistance with operating the respiration chambers and the IRIS unit. This research was financially supported by the Swedish-Norwegian Foundation for Equine Research, funds that the authors gratefully acknowledge.