





Non-technical Summary
Over 6500 fossils of non-mammalian vertebrates from 56 fossil sites spanning the Cretaceous/Paleogene (K/Pg) boundary (approximately 66 million years ago) have not previously been described in a publication. New geological and paleontological interpretations suggest that the K/Pg boundary is 50 m higher in the stratigraphic section than was previously suggested, but its precise location is unknown because an iridium layer has not yet been located. In the Cretaceous section, sharks and rays increase in abundance and taxonomic richness through the stratigraphic succession prior to a decrease during the final ca. 94 ky. Dinosaurs by contrast decrease in abundance and taxonomic richness during the final ca. 500 ky of the Cretaceous, but the cause of the decrease remains uncertain. The decrease in dinosaur fossils towards the K/Pg boundary may represent a preservational bias, not an ecological signal. A previous study concluded that dinosaurian taxonomic richness remained high throughout the section and that non-mammalian vertebrate abundance and richness did not change, but neither conclusion is supported by analysis of the collection.
Introduction
A burst of interest in the Cretaceous/Paleogene (K/Pg) extinction event has ushered in a new era of paleontological and sedimentological analyses of fossil sites in the North American Western Interior, or Laramidia (Hartman et al., Reference Hartman, Butler, Weiler and Schumaker2014; Moore et al., Reference Moore, Wilson, Sharma, Hallock, Braman and Renne2014; DePalma et al., Reference DePalma, Burnham, Martin, Larson and Bakker2015, Reference DePalma, Smit, Burnham, Kuiper and Manning2019, Reference DePalma, Oleinik, Gurche, Burnham and Klingler2021; Sprain et al., Reference Sprain, Renne, Wilson and Clemens2015; Jasinski et al., Reference Jasinski, Sullivan and Dodson2020; During et al., Reference During, Smit, Voeten, Berruyer, Tafforeau, Sanchez, Stein, Verdegaal-Warmerdam and van der Lubbe2022, Reference During, Voeten, Van der Lubbe and Ahlberg2024; Weaver et al., Reference Weaver, Tobin, Claytor, Wilson Deibel, Clemens and Wilson Mantilla2022; Hilton and Grande, Reference Hilton and Grande2023; Hilton et al., Reference Hilton, During, Grande and Ahlberg2023; Irizarry et al., Reference Irizarry, Witts, Garb, Rashkova, Landman and Patzkowsky2023; Wilson et al., Reference Wilson, Huang, Lyson and Bever2024). Fossil-rich deposits in Montana, North Dakota, and South Dakota have received the bulk of research attention. A lesser-known formation in south-central Wyoming’s Hanna Basin (Fig. 1.1) offers additional insight into changing paleoenvironments and paleofaunas across the K/Pg boundary (Eberle and Lillegraven, Reference Eberle and Lillegraven1998a, Reference Eberle and Lillegravenb; Lillegraven and Eberle, Reference Lillegraven and Eberle1999; Wroblewski, Reference Wroblewski2004, Reference Wroblewski2008, Reference Wroblewski2025). Although not as fossil rich as some other formations, the Ferris Formation has yielded a moderate diversity of non-mammalian vertebrate fossils that have until now remained largely undescribed and unfigured in the published literature.
Location and stratigraphy of fossil sites. (1) Map of southern Wyoming with outcrop belt of the Ferris Formation indicated in brown (base of the unit is to the west and south while top is to the east). Numbers denote collecting areas in order of most productive to least productive. Strike and dip symbols at the base of the formation indicate direction of bed orientation. (2) Stratigraphy of latest Cretaceous and Paleocene Ferris Formation correlated to age-equivalent strata in the Powder River, Williston, and Denver basins. Chronostratigraphic data from Lynds and Slattery (Reference Lynds and Slattery2017) and Wroblewski and Steel (Reference Wroblewski and Steel2022).

Figure 1. Long description
Panel 1 is a geographical map. An inset at the top right shows the United States with a red star on Wyoming. The main map shows southern Wyoming with a North arrow at the top left. A brown-shaded region represents the Ferris Formation outcrop belt, situated south of the Seminoe Reservoir. The belt is labeled Base Ferris on its western/southern edge and Top Ferris on its eastern edge. White circles with numbers 1 through 4 mark fossil collecting areas. A scale bar at the bottom indicates 0 to 20 k m.
Panel 2 is a stratigraphic correlation chart. The vertical Y-axis on the left shows geological time from 70 to 64 million years ago, divided into Cretaceous and Paleogene periods. Four columns represent basins from left to right: Hanna Basin, Powder River Basin, Denver Basin, and Williston Basin, M T.
* Hanna Basin: Shows Lewis Shale at the base, followed by Fox Hills F m, Medicine Bow F m, and Ferris F m at the top.
* Powder River Basin: Shows Pierre Shale, Fox Hills F m, Lance F m, and Fort Union F m.
* Denver Basin: Shows Pierre Shale, Fox Hills F m, Laramie F m, Arapahoe F m, and Denver F m.
* Williston Basin, M T: Shows Pierre Shale, Fox Hills F m, Hell Creek F m, and Fort Union F m.
A legend at the bottom identifies four depositional environments: light green for Fluvial/Coastal Plain, brown for Brackish/Deltaic, yellow for Strandplain, and gray for Open Marine.
New dinosaurian and euselachian discoveries from Late Cretaceous formations in Laramidia have emphasized the variability and taxonomic utility of isolated teeth and bones (Carpenter and Young, Reference Carpenter and Young2002; Williamson and Carr, Reference Williamson and Carr2002; Samman et al., Reference Samman, Powell, Currie and Hills2005; Smith et al., Reference Smith, Vann and Dodson2005; Bakker et al., Reference Bakker, Sullivan, Porter, Larson and Sulsbury2006; Longrich, Reference Longrich, Sankey and Baszio2008; Sankey, Reference Sankey, Sankey and Baszio2008; Boyd et al., Reference Boyd, Brown, Scheetz and Clarke2009; Evans et al., Reference Evans, Larson and Currie2013, Reference Evans, Vavrek and Larsson2015; Gates et al., Reference Gates, Zanno and Makovicky2013, Reference Gates, Gorscak and Makovicky2019; Kirkland et al., Reference Kirkland, Eaton, Brinkman, Titus, Loewen, Titus and Lowen2013; Boyd, Reference Boyd2014; Cook et al., Reference Cook, Newbrey, Brinkman and Kirkland2014; DePalma et al., Reference DePalma, Burnham, Martin, Larson and Bakker2015; Mallon et al., Reference Mallon, Evans, Tokaryk and Currie2015; Wynd et al., Reference Wynd, DeMar and Wilson2020; Woodruff et al., Reference Woodruff, Schott and Evans2023; Atkins-Weltman et al., Reference Atkins-Weltman, Simon, Woodward, Funston and Snively2024). Bolstered by this work, re-examination of the collections from the Ferris Formation led to the realization that taxonomic revisions to identifications published in earlier works (Lillegraven and Eberle, Reference Lillegraven and Eberle1999; Wroblewski, Reference Wroblewski2004) are required. Additionally, the biostratigraphy and patterns of taxonomic richness of the Ferris Formation warrant review and, when needed, revision in light of the new and growing dataset.
The purposes of this paper are to: (1) describe the non-mammalian vertebrate fossil record of the latest Cretaceous (Lancian North American Land Mammal “age” or NALMA: approximately 67–66 Ma) and earliest Paleogene (Puercan NALMA: 66–65 Ma) Ferris Formation in south-central Wyoming’s Hanna Basin; (2) re-assess the lithostratigraphic position of the K/Pg boundary based on a review of the biostratigraphic data and new lithostratigraphic interpretations of the deposits surrounding the boundary; (3) quantify trends in euselachian and dinosaurian numerical abundance and taxonomic richness across the K/Pg transition; and (4) test previous claims that dinosaurian taxonomic diversity remained high through the section.
Stratigraphy
The latest Cretaceous–early Paleocene (67–63 Ma) Ferris Formation is an approximately 2000-m-thick clastic unit that is exposed in south-central Wyoming’s Hanna and Carbon basins (Eberle and Lillegraven, Reference Eberle and Lillegraven1998a). It overlies the deltaic Medicine Bow Formation and is unconformably overlain by the Paleocene through early Eocene (63–54 Ma) Hanna Formation (Fig. 1.2). The combined Medicine Bow and Maastrichtian part of the Ferris Formation is approximately 2925 m thick in the study area and is correlative with the upper part of the Pierre Shale, Fox Hills, and Lance Formation and its equivalents elsewhere in the region (Fig. 1.2). The Ferris Formation is chronostratigraphically equivalent to parts of the Denver, Hell Creek, and Lance formations in Colorado, North Dakota, Montana, South Dakota, and Wyoming in the USA (Wroblewski and Steel, Reference Wroblewski and Steel2022; Wroblewski, Reference Wroblewski2025). The Maastrichtian part of the Ferris Formation is lithologically identical to but thicker than the Red Rim Member of the Lance Formation in the Washakie and Great Divide basins to the southwest, suggesting they are correlative (Lynds and Xie, Reference Lynds and Xie2019).
The thickness of the Ferris Formation varies considerably across the region (Dobbin et al., Reference Dobbin, Bowen and Hoots1929). The base of the formation is diachronous across the Hanna and Carbon basins because it is marked by the first appearance of extraformational pebbles in the sandstone bodies (Bowen, Reference Bowen1918). These pebbles are found in fluvial channel bodies, and the discontinuous nature of the bodies makes identification of a single surface representing the basal contact of the formation impossible.
The combined latest Maastrichtian (Lancian NALMA) and earliest Danian (Puercan NALMA) Ferris Formation in the main study area, west of Seminoe Reservoir is 1236 m thick. The latest Maastrichtian part of the formation is 626 m-thick and when combined with the 2300-m-thick deltaic Medicine Bow Formation, represents approximately 4 million years of sediment accumulation in a generally progradational setting of deltaic and fluvial environments (Flores et al., Reference Flores, Cararoc and Bader1999; Wroblewski Reference Wroblewski2004, Reference Wroblewski and Dalrymple2006, Reference Wroblewski2008; Boyd and Lillegraven, Reference Boyd and Lillegraven2011; Lynds and Slattery, Reference Lynds and Slattery2017; Wroblewski and Steel, Reference Wroblewski and Steel2022). The age of the K/Pg boundary is generally agreed to be approximately 66 Ma, thereby providing an age for the top of the Maastrichtian section (Renne et al., Reference Renne, Deino, Hilgen, Kuiper, Mark, Mitchell, Morgan, Mundil and Smit2013). The precise location of the K/Pg boundary in the Ferris Formation remains elusive because an iridium layer has not yet been located, so the Maastrichtian part of the Ferris Formation in the study area may be 50 m thinner than the 626 m measured in this study. All age estimates calculated for fossil sites therefore include a low and a high range to account for this uncertainty.
By dividing the 2925 m thickness of Upper Maastrichtian deposits by 4 million years, an average sediment accumulation rate of 0.73 mm/yr is calculated, while with a thickness of 2875 m to account for the possibly lower stratigraphic location of the K/Pg boundary, the average sediment accumulation rate is 0.72 mm/yr. As expected, such estimates do not reflect the episodic rates of sediment accumulation in clastic environments, but they provide an approximation for ages of fossil localities and stratigraphic horizons within a thick succession such as the Ferris Formation.
Based on the calculated average sediment accumulation rates of 0.73 mm/yr for the Maastrichtian, the Cretaceous part of the Ferris Formation accumulated in 858 ky. At the lower rate of 0.72 mm/yr, the time encompassed is approximately 869 ky. Sediment accumulation rates varied in the Late Cretaceous and Paleocene, with a dramatic decrease during the earliest Paleocene (Supplemental Fig. 1). This coincides with a regional unconformity between the latest Cretaceous Lance and early Paleocene Fort Union formations (Winterfeld, Reference Winterfeld1982; Lynds and Xie, Reference Lynds and Xie2019) and suggests that a similar discontinuity or its conformable, lateral equivalent could be present in the Ferris Formation. The increased abundance and degree of amalgamation of fluvial channels in the Puercan part of the Ferris Formation record the relatively lower rates of accommodation relative to sediment supply and progradation of fluvial deposits (Wroblewski, Reference Wroblewski and Dalrymple2006).
The Puercan section of the Ferris Formation is approximately 610 m thick and accumulated in 1.2–2.2 million years, depending on how long the Puercan NALMA is estimated to have lasted (Williamson et al., Reference Williamson, Nichols and Weil2008; Barnosky et al., Reference Barnosky, Holmes, Kircholtes, Lindsey and Maguire2014). The average sediment accumulation rate, calculated from these figures was about 0.27–0.51 mm/yr during this time, with accumulation rates lowest in Pu1 and accelerated in Pu2–Pu3.
Vertebrate fossils are most abundantly preserved in fluvial channel bodies and abandoned channel fills in the Ferris Formation. The most complete and best-preserved specimens were collected from fine- to medium-grained fluvial channel bodies of the Puercan section, which accumulated when subsidence rates were at their lowest. Resumed high rates of subsidence in the Torrejonian coincided with marine flooding and a decrease in the abundance of continental body fossils but an increase in plant fossils and marine ichnofossils (Wroblewski and Steel, Reference Wroblewski and Steel2022).
Previous work
Crews from the University of Wyoming collected vertebrate fossils from the Ferris Formation between 1991 and 1995, resulting in several key publications and theses. Mammalian fossils and their biostratigraphic zonation were reported by Eberle and Lillegraven (Reference Eberle and Lillegraven1998a, Reference Eberle and Lillegravenb). They suggested that the K/Pg boundary was located somewhere in a 15-m-thick fluvial channel sandstone body that contains dinosaur fossils and teeth they identified as the Paleocene index taxon Protungulatum donnae Sloan and Van Valen, Reference Sloan and Van Valen1965. Lillegraven and Eberle (Reference Lillegraven and Eberle1999) published a summary of changes in taxonomic composition across the local K/Pg boundary that incorporated data on non-mammalian vertebrates from an unpublished master’s thesis (Wroblewski, Reference Wroblewski1997). A taxonomic revision of euselachian specimens, their biostratigraphic ranges, and paleoenvironmental significance was published by Wroblewski (Reference Wroblewski2004). A review of the pachycephalosaurine material with an emphasis on its paleobiogeographic implications was presented by Wroblewski (Reference Wroblewski2025), who also suggested that the K/Pg boundary was located stratigraphically above the interval proposed by Eberle and Lillegraven (Reference Eberle and Lillegraven1998a). Finally, a recent review of nodosaur material from the Ferris Formation led to the suggestion that a section of sacral armor might represent the northernmost occurrence of Gargoylopelta Ford, Reference Ford2000, or a previously unreported morphotype of Denversaurus Bakker, Reference Bakker1988 (Green et al., Reference Green, Cavigelli, Vietti and Wroblewski2024).
Materials and methods
The collection of non-mammalian vertebrate fossils from the Ferris Formation comprises over 6500 individual dental, skeletal, and epidermal elements collected from 56 fossil localities (Figs. 2–13, Supplemental Text 1, Appendix 1), which are reposited in the paleontological collections of the University of Wyoming (UW). These specimens were collected from 1991–1995 using a combination of surface collecting, quarrying, dry screen washing of matrix on site, and wet screen washing of matrix followed by microscopic picking of fossils from the resulting material at the University of Wyoming. A minimum of 446 individual animals is represented by these elements. This estimate was calculated based on the number of non-overlapping elements from individual sites and probably underestimates the number of lepisosteids and alligatoroids, both of which are represented by thousands of shed teeth and other elements (Appendix 1).
Stratigraphic occurrence of vertebrate fossil sites in the Ferris Formation that were used in this study. NALMA data from Eberle and Lillegraven (Reference Eberle and Lillegraven1998a). Dashed black lines denote NALMA interval zone boundaries. Thick red dashed line denotes location of the K/Pg boundary proposed in this study. Thin red dotted line denotes the location of the K/Pg boundary proposed by Eberle and Lillegraven (Reference Eberle and Lillegraven1998a).

Figure 2. Long description
A vertical stratigraphic chart organized into four main columns.
* The first column on the left is a vertical scale in meters, ranging from 0 at the bottom to 1200 at the top in increments of 100.
* The second column, lithology, displays colored blocks representing rock types. A legend at the bottom right identifies these as: brown for Channel Sandstone with conglomerate, yellow for Channel Sandstone, gray for Silty Mudstone, pink/purple for Oxidized Mudstone, and black for Carbonaceous Shale. The sequence begins with thick brown sandstone at the base, transitioning to alternating gray mudstone and brown sandstone up to 300 meters, followed by thick yellow sandstone and dark shale layers between 400 and 600 meters, and predominantly yellow sandstone from 600 to 1200 meters.
* The third column, U W vertebrate fossil sites, contains black dots mapped to specific heights, with leader lines pointing to site labels. Dense clusters occur between 400 and 500 meters (including sites V-92046 through V-93002) and between 550 and 600 meters (including sites V-91031 through V-91033). Higher sites include V-91018 at 850 meters and V-92026 at 1020 meters.
* The fourth column, N A L M A (North American Land Mammal Ages), is divided by horizontal dashed lines. The bottom section from 0 to approximately 630 meters is labeled La. Above this is a narrow zone labeled Pu1, followed by Pu2 up to 860 meters, and Pu3 at the top.
* A thick red dashed line at approximately 625 meters marks the proposed K / P g boundary. A thin red dotted line below it at approximately 575 meters marks the boundary proposed by Eberle and Lillegraven. The area between these two lines is labeled K / P g boundary zone.
Photographs of euselachian teeth from the Maastrichtian Ferris Formation: (1, 2) Restesia americana (UW 26476) in labial view; (3, 4) Restesia monocuspilatus (UW 26476) in labial view; (5–8) Lonchidion selachos (UW 26478): (5) occlusal view; (6, 8) lingual view; (7) basal view; (9–15) Myledaphus pustulosus Cook et al., Reference Cook, Newbrey, Brinkman and Kirkland2014 (UW 26476, 26601); (16, 17) Dasyatis sp. (UW 27207): (16) lingual view; (17) labial view. Scale bars are (1–4) 0.5 mm; (5–17) 1 mm.

Figure 3. Long description
The photo is organized into four horizontal rows of fossilized teeth.
Row 1 contains four triangular teeth. Panels 1 and 2 show Restesia americana in labial view, featuring a broad base and a central vertical ridge. Panels 3 and 4 show Restesia monocuspilatus in labial view, with a more slender, pointed central cusp. Scale bars for 1 through 4 represent 0.5 mm.
Row 2 contains four low-crowned teeth of Lonchidion selachos. Panel 5 is an occlusal view showing a wide, dark crown. Panels 6 and 8 are lingual views, and panel 7 is a basal view showing the underside of the tooth. Scale bars for 5 through 17 represent 1 mm.
Row 3 and the left side of Row 4 contain panels 9 through 15, which are teeth of Myledaphus pustulosus. These specimens show varied textures, including striated surfaces in panels 10, 11, 13, 14, and 15, and a pitted, pustulose texture in panel 9. Panel 12 is a significantly larger, dark, rectangular tooth fragment with vertical striations.
Row 4, on the far right, contains panels 16 and 17 showing Dasyatis species. Panel 16 is a lingual view showing a light-colored, textured occlusal surface. Panel 17 is a labial view of a similar tooth with a reddish-brown, rounded crown.
Photographs of representative turtle fossils from the Ferris Formation. (1) Carapace fragment of Basilemys sp. (UW 26586); (2, 3) Baenidae indet. carapace fragment (UW 26477) in (2) ventral; and (3) dorsal view, showing possible damage from a crocodilian bite indicated by arrows; (4–9) Paleocene Baenidae indet. specimens preserved as steinkerns; (4, 5) UW 25343 in dorsal (4) and ventral (5) views; (6, 7) UW 25351 in dorsal view; (7–9) UW 25341 in dorsal (7), lateral (8), and ventral (9) views. Scale bars are (1) 5 mm; (2, 3) 2 cm; (4–9) 10 cm.

Figure 4. Long description
The nine panels are arranged in a 3 by 3 grid.
Top Row:
* Panel 1: A light tan carapace fragment of Basilemys species showing a distinct pitted, honeycomb-like surface texture. A 5 mm scale bar is at the bottom left.
* Panel 2: A ventral view of a Baenidae indet. carapace fragment (U W 26477) with a smooth, light-colored surface.
* Panel 3: A dorsal view of the same fragment (U W 26477). Two white arrows point to circular indentations on the brown surface, indicating possible crocodilian bite marks. A 2 cm scale bar is at the bottom left.
Middle Row (Paleocene Baenidae indet. steinkerns with a 10 cm scale bar below panel 5):
* Panel 4: Specimen U W 25343 in dorsal view, showing a rounded, dark brown internal mold with visible vertebral and pleural suture patterns.
* Panel 5: Specimen U W 25343 in ventral view, showing a flatter, more uniform texture with a small white identification label.
* Panel 6: Specimen U W 25351 in dorsal view, displaying a clear central ridge and symmetrical lateral segments.
Bottom Row (Specimen U W 25341 with a 10 cm scale bar below panel 8):
* Panel 7: Dorsal view of the steinkern, showing a rough, bulbous texture.
* Panel 8: Lateral view of the same specimen, highlighting its vertical thickness and irregular profile.
* Panel 9: Ventral view of the specimen, revealing a highly textured, lumpy surface composed of sediment and fossilized internal structures.
Photographs of crocodilian specimens from the Ferris Formation. (1, 2) cf. Borealosuchus sp. incisiform tooth in (1) posterior view and (2) lateral view; (3–5) skull of Navajosuchus mooki (Simpson, Reference Simpson1930) (UW 26302) in (3) dorsal, (4) lateral, and (5) ventral views. Scale bars are (1, 2) 5 mm; (3–5) 5 cm.

Figure 5. Long description
The figure contains five numbered panels showing fossilized specimens.
* Panel 3 at the top shows the skull of Navajosuchus mooki (U W 26302) in dorsal view. The skull is brown with a heavily pitted, rugose texture. A black scale bar representing 5 cm is positioned below it.
* Panel 4 in the middle shows the same skull in lateral view, highlighting the elongated snout and the depth of the jaw bone. A 5 cm scale bar is located to the bottom right.
* Panel 5 at the bottom shows the skull in ventral view, revealing the palate and large circular tooth sockets (alveoli) along the jaw margin. A small white label with the text U W dash 26302 is adhered to the fossil. A 5 cm scale bar is at the bottom right.
* An inset box on the middle-left contains panels 1 and 2. Panel 1 shows a Borealosuchus sp. incisiform tooth in posterior view, and panel 2 shows the same tooth in lateral view. The tooth is dark brown, conical, and slightly curved. A small black scale bar representing 5 mm is placed between the two tooth views.
Photographs of tyrannosaurid teeth from the Ferris Formation. (1, 2) Nanotyrannus lancensis (Gilmore, 1946) maxillary or dentary tooth (UW 26310) in (1) lingual view and (2) labial view; (3–6) Nanotyrannus lancensis maxillary or dentary tooth (UW 26285) in (3) lingual, (4) labial, (5) proximal, and (6) distal views; (7–9) Nanotyrannus lancensis premaxillary tooth (UW 26250) in (7) right lateral, (8) distal, and (9) left lateral views; (10–12) Tyrannosaurus rex Osborn, Reference Osborn1905, premaxillary tooth (UW 26626) in (10) left lateral, (11) distal, and (12) right lateral views; (13–16) Tyrannosaurus rex maxillary or dentary tooth (UW 26624) in (13) lingual, (14) labial, (15) proximal, and (16) distal views. Scale bars are 10 mm.

Figure 6. Long description
The photo contains 16 numbered panels arranged in three rows.
Row 1:
1 and 2 show a Nanotyrannus lancensis tooth U W 26310 in lingual and labial views. The tooth is curved and light brown with a textured surface.
3 through 6 show Nanotyrannus lancensis tooth U W 26285 in lingual, labial, proximal, and distal views. This tooth is darker brown and more slender than the first.
Row 2:
7 through 9 show a Nanotyrannus lancensis premaxillary tooth U W 26250 in right lateral, distal, and left lateral views. It has a distinct triangular profile.
10 through 12 show a Tyrannosaurus rex premaxillary tooth U W 26626 in left lateral, distal, and right lateral views. It features visible serrations along the edge and a white identification label on panel 12.
Row 3:
13 through 16 show a Tyrannosaurus rex tooth U W 26624 in lingual, labial, proximal, and distal views. These views show a large, dark, robust tooth with a white label on panel 14.
Black horizontal scale bars representing 10 mm are placed under panels 1-2, 5-6, 7-9, 11-12, and 14-15.
Photographs of ornithomimid pedal phalanges and ungual from the Ferris Formation. (1–4) Struthiomimus sedens (Marsh, Reference Marsh1892) phalanx from pedal digit IV (UW 26318) in (1) dorsal, (2) ventral, (3) proximal, and (4) lateral views; (5–8) Struthiomimus sedens phalanx from pedal digit IV (UW 26305) in (5) dorsal, (6) anterior, (7) proximal, and (8) lateral views; (9–13) Struthiomimus sedens right pedal ungual II (UW 26316) in (9) medial, (10) lateral, (11) dorsal, (12) distal, and (13) proximal views; (14–17) associated pedal phalanx and ungual (UW 26303) in (14) lateral, (15) dorsal, (16) ventral, and (17) medial views. Scale bars are 10 mm.

Figure 7. Long description
A multi-panel photo containing 17 numbered views of fossilized dinosaur toe bones.
Row 1 (Panels 1 to 4): Struthiomimus sedens phalanx U W 26318.
1. Dorsal view showing a rectangular bone with a central depression.
2. Ventral view with a flatter, textured surface.
3. Proximal view showing a triangular cross-section.
4. Lateral view showing a curved, C-shaped profile.
A 10 mm scale bar is positioned under panel 3.
Row 2 (Panels 5 to 8): Struthiomimus sedens phalanx U W 26305.
5. Dorsal view showing a deeply notched proximal end.
6. Anterior view showing a rounded, bulbous surface.
7. Proximal view showing a wide, flat articular surface.
8. Lateral view showing a deep circular depression.
A 10 mm scale bar is positioned under panel 6.
Row 3 (Panels 9 to 13): Struthiomimus sedens right pedal ungual U W 26316.
9. Medial view of a large, triangular claw fragment.
10. Lateral view showing the opposite side of the claw with handwritten catalog numbers.
11. Dorsal view showing the narrow top ridge.
12. Distal view showing the tapered tip.
13. Proximal view showing the broad base.
A 10 mm scale bar is positioned under panel 11.
Row 4 (Panels 14 to 17): Associated pedal phalanx and ungual U W 26303.
14. Lateral view of two bone fragments.
15. Dorsal view of the fragments showing white catalog labels.
16. Ventral view showing the underside of the fragments.
17. Medial view showing the inner surfaces.
A 10 mm scale bar is positioned at the bottom center.
Comparison of the weathering pattern of UW 26303 to subaerially weathered artiodactyl phalanges collected from a hillside in central Wyoming. (1–3) Lateral, (10–12) dorsal, (4–6) ventral, and (7–9) medial views. Scale bar is 10 mm.

Figure 8. Long description
The photo displays twelve numbered panels against a black background.
Left Column:
* Panel 1 shows two brown, porous bone fragments in lateral view.
* Panel 2 shows a single, light-colored weathered phalanx with a longitudinal crack.
* Panel 3 shows a larger, heavily weathered white phalanx.
* Panel 4 shows two brown bone fragments in ventral view.
* Panel 5 shows a white phalanx with a constricted middle section.
* Panel 6 shows a long, weathered white phalanx with rough surface texture.
Right Column:
* Panel 7 shows two brown bone fragments in medial view, with white identification labels adhered to the surface.
* Panel 8 shows a white phalanx with a rounded articular end.
* Panel 9 shows a white phalanx with a tapered shape.
* Panel 10 shows two brown bone fragments in dorsal view, with a white label on the left fragment.
* Panel 11 shows a white phalanx with a distinct longitudinal fissure.
* Panel 12 shows a white phalanx with a relatively smooth but weathered surface.
A white scale bar representing 10 mm is located at the bottom center of the image.
Photographs of representative deinonychosaur teeth from the Ferris Formation. (1–6) Archaeoraptor temertyorum Evans, Larson, and Currie, Reference Evans, Larson and Currie2013 (1, 2) UW 27302 in (1) labial view, and (2) lingual view; (3, 4) UW 26275 in (3) labial view, and (4) lingual view; (5, 6) UW 27305 in (5) labial view, and (6) lingual view; (7–10) Dakotaraptor steini DePalma et al., Reference DePalma, Burnham, Martin, Larson and Bakker2015 (7, 8) UW 26308 in (7) lingual view, and (8) labial view; (9, 10) UW 27366 in (9) labial view, and (10) lingual view; (11–14) Pectinodon bakkeri Carpenter, Reference Carpenter1982 (11, 12) UW 26247 in (11) labial view, and (12) lingual view; (13, 14) UW 26249 in (13) labial view, and (14) lingual view. Scale bars are 2 mm.

Figure 9. Long description
The 14 panels are arranged in three rows. Each pair of numbers represents the labial and lingual views of a single specimen.
Top row:
- Panels 1 and 2: Archaeoraptor temertyorum specimen U W 27302. Small, curved, light brown teeth with fine serrations on the posterior edge.
- Panels 3 and 4: Archaeoraptor temertyorum specimen U W 26275. Darker brown, more slender curved teeth with visible serrations.
- Panels 5 and 6: Archaeoraptor temertyorum specimen U W 27305. Dark, almost black, robust curved teeth.
Middle row:
- Panels 7 and 8: Dakotaraptor steini specimen U W 26308. Large, tan-colored teeth with prominent vertical cracks and fine serrations.
- Panels 9 and 10: Dakotaraptor steini specimen U W 27366. Pale, cream-colored teeth with a more elongated, straighter profile.
Bottom row:
- Panels 11 and 12: Pectinodon bakkeri specimen U W 26247. Brown teeth with very large, distinct, hooked serrations on the posterior edge.
- Panels 13 and 14: Pectinodon bakkeri specimen U W 26249. Fragmentary light brown teeth showing the same characteristic large serrations.
Black scale bars representing 2 mm are placed between or below each specimen pair.
Photographs of representative small theropod teeth and digital elements from the Ferris Formation. (1, 2) Paronychodon lacustris Cope, Reference Cope1876a (UW 26313) in (1) lingual view, and (2) labial view; (3–6) Richardoestesia isosceles Sankey, Reference Sankey2001 (3, 4) UW 29014 in (3) lingual view, and (4) labial view; (5, 6) UW 26279 in (5) lingual view, and (6) labial view; (7–11) Coelurosauria indet. (7) distal metapodial (UW 25195); (8, 9) manual ungual (UW 27442) in (8) right lateral view, and (9) left lateral view; (10, 11) manual ungual (UW 58261) in (10) left lateral view, and (11) right lateral view. Scale bars are (1–6) 2 cm; (7–11) 1 cm.

Figure 10. Long description
The photo contains eleven numbered panels arranged in two rows.
Top Row (Teeth):
* Panels 1 and 2: Paronychodon lacustris tooth U W 26313. Panel 1 shows the lingual view with a curved, dark brown crown. Panel 2 shows the labial view. A 2 cm scale bar is positioned between them.
* Panels 3 and 4: Richardoestesia isosceles tooth U W 29014. Panel 3 is the lingual view and panel 4 is the labial view, showing a lighter, translucent tan color and a triangular shape. A 2 cm scale bar is below them.
* Panels 5 and 6: Richardoestesia isosceles tooth U W 26279. Panel 5 is the lingual view and panel 6 is the labial view, showing a tall, slender, dark brown crown with visible serrations on the distal edge. A 2 cm scale bar is between them.
Bottom Row (Digital Elements):
* Panel 7: Coelurosauria indet. distal metapodial U W 25195. A large bone fragment with a porous, cancellous texture on the left side and a white identification label. A 1 cm scale bar is below it.
* Panels 8 and 9: Coelurosauria indet. manual ungual U W 27442. Panel 8 is the right lateral view showing a curved claw with a white label. Panel 9 is the left lateral view. A 1 cm scale bar is between them.
* Panels 10 and 11: Coelurosauria indet. manual ungual U W 58261. Panel 10 is the left lateral view and panel 11 is the right lateral view of a dark, heavily fossilized, strongly curved claw. A 1 cm scale bar is below panel 10.
Representative ornithischian teeth from the Ferris Formation. (1–3) Edmontosaurus annectens (Marsh, Reference Marsh1892) tooth (UW 27310): (1) left lateral, (2) proximal, and (3) right lateral views; (4–7) Thescelosaurus sp. (4, 5) UW 26612 (4) in lingual view, and (5) labial view; (6, 7) UW 26613 (6) in lingual view, and (7) labial view. Scale bars are (1–3) 5 mm; (4–7) 2 mm.

Figure 11. Long description
The photo is organized into two rows.
Top row (Panels 1 to 3): Three views of a single U W 27310 tooth.
* Panel 1 shows the left lateral view, a long, dark brown, slender fossil with a textured surface.
* Panel 2 shows the proximal view, revealing the narrow edge of the tooth.
* Panel 3 shows the right lateral view, featuring a white specimen label with the handwritten number V-92018 over 27310.
* A 5 mm scale bar is located to the right of panel 2.
Bottom row (Panels 4 to 7): Two different Thescelosaurus specimens.
* Panels 4 and 5 show U W 26612. Panel 4 is the lingual view and panel 5 is the labial view. The tooth has a broad, fan-shaped crown with vertical ridges and a thick, cylindrical root.
* Panels 6 and 7 show U W 26613. Panel 6 is the lingual view and panel 7 is the labial view. This specimen is lighter in color, appearing tan or off-white, with a more worn, rounded crown.
* A 2 mm scale bar is positioned between panels 4 and 5, and another 2 mm scale bar is to the right of panel 6.
Examples of Chasmosaurinae indet. material from the Ferris Formation. (1–3) Tooth with partial root (UW 27435): (1) left lateral, (2) anterior, and (3) right lateral views; (4, 5) caudal vertebra (UW 26261) in (4) lateral view, and (5) anterior view; (6) quarry map of UW 26256; (7–9) left dentary (UW 26252) in (7) occlusal, (8) lateral, and (9) views; (10–12) braincase (UW 26253) in (10) posterior, (11) lateral, and (12) anterior views. Scale bars (1–3) 5 mm; (4, 5) 10 cm; (6) 1 m; (7–12) 10 cm.

Figure 12. Long description
The figure consists of twelve numbered panels.
* Panels 1 through 3: Three views of a fossilized tooth with a partial root. 1 shows the left lateral view, 2 shows the anterior view, and 3 shows the right lateral view. A 5 millimeter scale bar is positioned below panel 2.
* Panels 4 and 5: A caudal vertebra specimen U W 26261. 4 is a lateral view and 5 is an anterior view. A 10 centimeter vertical scale bar is placed between the two views.
* Panel 6: A black and white quarry map of specimen U W 26256. At the center is a large black silhouette labeled ilium. To the right and top are curved lines labeled ribs. Below the ilium are small rectangular blocks labeled neural spines and small circular fragments to the left labeled centra. A 1 meter scale bar is at the bottom.
* Panels 7 through 9: Three views of a left dentary specimen U W 26252. 7 is the occlusal view, 8 is the lateral view, and 9 is a third view. A 10 centimeter scale bar is located below panel 8.
* Panels 10 through 12: Three views of a braincase specimen U W 26253. 10 is the posterior view showing a rounded occipital condyle, 11 is the lateral view, and 12 is the anterior view. A 10 centimeter scale bar is located below panel 11.
Photographs of ankylosaur specimens from the Ferris Formation. (1–4) Nodosauridae indet. teeth; (1, 2) in (1) lingual view, and (2) labial view; (3, 4) UW 26292 in (3) lingual view, and (4) lingual view; (5, 6) Ankylosauridae indet. tooth (UW 26289) in (5) lingual view, and (6) labial view; (7–11) Nodosauridae indet. osteoderms; (7–9) UW 26294 in (7) dorsal, (8) anterior, and (9) ventral views; (10, 11) UW 25188 in (10) dorsal view, and (11) anterior view; (12) UW 34391, dermal armor from an unidentified nodosaurid; (13) Nodosauridae indet. cervical osteoderm (UW 26291); (14–17) Ankylosauridae indet. right metacarpal I (UW 25283) in (14) anterior, (15) posterior, (16) lateral, and (17) medial views. Scale bars are (1–6) 5 mm; (7–13) 5 cm; (14–17) 1 cm.

Figure 13. Long description
A multi-panel collection of fossil specimens.
Row 1: Panels 1 through 6 show small fossilized teeth. Panels 1 and 2 are dark grey Nodosauridae indet. teeth in lingual and labial views. Panels 3 and 4 are brownish U W 26292 teeth in lingual views. Panels 5 and 6 are light brown Ankylosauridae indet. teeth (U W 26289) in lingual and labial views. A 5 mm scale bar is provided for this row.
Row 2 and 3: Panels 7 through 11 show Nodosauridae indet. osteoderms. Panels 7, 8, and 9 show U W 26294 in dorsal, anterior, and ventral views, appearing as large, fragmented tan-colored plates. Panels 10 and 11 show U W 25188 in dorsal and anterior views, appearing as a rounded, conical fossil. Panel 12 shows U W 34391, a large section of dark brown dermal armor with a pebbled texture. Panel 13 shows a large, triangular cervical osteoderm (U W 26291). A 5 cm scale bar is provided for these panels.
Row 4: Panels 14 through 17 show an Ankylosauridae indet. right metacarpal I (U W 25283) in anterior, posterior, lateral, and medial views. The bone is robust and light tan with visible joint surfaces. A 1 cm scale bar is provided for this row.
The locations of the fossil sites were mapped in the field and correlated to stratigraphic sections that were logged using trigonometric calculations from aerial photographs and ground-based measurements using a Jacob’s staff with Brunton compass. Specimen numbers were assigned to individual fossils that were identifiable to family level and below and as lot numbers for groups of specimens, such as some euselachian teeth, gar scales, turtle shell fragments, crocodilian teeth, and worn hadrosaur and ornithischian teeth. Some of these are in the process of receiving new UW numbers as a result of this study.
Renewed fieldwork in 2018 focused on remapping the fossil sites and constructing detailed measured stratigraphic sections to aid in lithological and biostratigraphic correlations around the outcrop belt. Grain size, sedimentary structures, stratal surfaces, bed characteristics, and ichnofossils were recorded. The geographic and stratigraphic locations of the fossil sites were recorded using on-the-ground measurements calibrated with GPS and satellite imagery. Key outcrops surrounding the K/Pg boundary were correlated using a combination of satellite imagery, measured sections, and by walking out marker beds when possible. Fine-grained carbonaceous shale and mudstone beds were the focus of this effort because they represent laterally continuous overbank deposits, while the discontinuous channel bodies and crevasse-splay deposits offer only limited correlation potential.
Reviewing and when necessary, revising the taxonomic assignment of specimens in the collections was facilitated by comparing them to published specimens, photographs of original specimens in other collections, and cast replicas at the University of Wyoming and other institutions. Photographs of the specimens were taken on an Apple iPhone 14 Pro Max. Detailed images of small specimens were captured on a Keyence digital microscope.
Age estimates of the fossil sites were calculated using points of biostratigraphic control in the Puercan section and below the Maastrichtian part of the formation because radiometric dates are not available.
Repositories and institutional abbreviations
Specimens described and figured in this study are reposited at the University of Wyoming (UW). Types, figured, and other specimens examined in this study are deposited in the following institutions: American Museum of Natural History (AMNH), New York, USA; Black Hills Institute of Geological Research (BHI), Rapid City, USA; Brazos Valley Museum of Natural History (BVMNH), College Station, USA; Burpee Museum of Natural History (BMRP), Rockford, Illinois, USA; Carnegie Museum of Natural History (CM), Pittsburgh, USA; Canadian Museum of Nature (CMN), Ottawa, CA; Cleveland Museum of Natural History (CMNH), Cleveland, USA; Denver Museum of Nature and Science (DMNS), Denver, USA; Houston Museum of Natural Science (HMNS), Houston, USA; Louisiana State University Museum of Geoscience (LSUMG), Baton Rouge, USA; Milwaukee Public Museum (MPM), Milwaukee, USA; The Palm Beach Museum of Natural History (PBMNH), Florida, USA; Princeton University (PU), Princeton, USA; Royal Ontario Museum (ROM), Toronto, CA; The Children’s Museum of Indianapolis (TCMI), Indianapolis, Indiana, USA; Tyrrell Museum of Paleontology (TMP), Drumheller, CA; University of California Museum of Paleontology (UCMP), Berkeley, USA; University of Washington Burke Museum (UWBM), Seattle, USA.
Results
Over 6500 elements representing 42 taxa were identified in the collection (Table 1, Supplemental Text 1, Appendix 1). The collection is dominated by isolated but diagnostic teeth, denticles, osteoderms, bones, and an epidermal shield, with uncommon associated specimens, and a single, partially articulated ceratopsian skeleton (Figs. 3–13, Supplemental Figs. 2–5). Seventeen taxa that were listed by Lillegraven and Eberle (Reference Lillegraven and Eberle1999) are here reassigned to different taxa (Table 1, Supplemental Text. 1). Those newly recognized in the Ferris Formation are: Restesia americana (Estes, Reference Estes1964), R. monocuspilatus Wynd, DeMar, and Wilson, Reference Wynd, DeMar and Wilson2020, Myledaphus pustulatus , Phyllodus paulkatoi Estes and Hiatt, Reference Estes and Hiatt1978, cf. Borealosuchus sp., Navajosuchus mooki (Simpson, Reference Simpson1930), Acheroraptor temertyorum Evans, Larson, and Currie, Reference Evans, Larson and Currie2013, Dakotaraptor steini DePalma et al., Reference DePalma, Burnham, Martin, Larson and Bakker2015, Richardoestesia isosceles Sankey, Reference Sankey2001, Pectinodon bakkeri Carpenter, Reference Carpenter1982, Nanotyrannus lancensis (Gilmore, 1946), Struthiomimus sedens (Marsh, Reference Marsh1892), Edmontosaurus annectens (Marsh, Reference Marsh1892), and Thescelosaurus sp. Some of the specimens listed by Lillegraven and Eberle (Reference Lillegraven and Eberle1999) could not be located, and a search is underway to find them. A single specimen that was previously identified by Lillegraven and Eberle (Reference Lillegraven and Eberle1999) as a tooth of the phyllodont fish, Paralbula casei Estes, Reference Estes1969, is instead a fragment of bone (Supplemental Fig. 2).
Non-mammalian vertebrate taxa from the Lancian and Puercan Ferris Formation identified in this study compared to those listed by Lillegraven and Eberle (Reference Lillegraven and Eberle1999). Number of elements refers to the number of individual bones, teeth, osteoderms, and epidermal specimens, except for the partially articulated chasmosaurine (UW 26256), which is combined as a single element

Table 1. Long description
The table consists of four columns: Taxon Number, This study, Lillegraven and Eberle 1999, and Number of Elements.
* Taxon 1: Lonchidion selachos; Lissodus = Lonchidion selachos; 23 elements.
* Taxon 2: Restesia monocuspilatus; Squatirhina americana; 13 elements.
* Taxon 3: Restesia americana; Squatirhina americana; 72 elements.
* Taxon 4: Myledaphus pustulatus; Myledaphus bipartitus; 82 elements.
* Taxon 5: Myledpahus species; Myledaphus bipartitus; 64 elements.
* Taxon 6: Dasyatis species; Dasyatis species; 9 elements.
* Taxon 7: Amiidae indet.; Cyclurus = Kindleia fragosa; 302 elements.
* Taxon 8: Lepisosteidae indet.; Lepisosteidae indet.; 3314 elements.
* Taxon 9: Phyllodus paulkatoi; Phyllodus toliapicus; 4 elements.
* Taxon 10: Teleostei indet.; Teleostei indet.; 45 elements.
* Taxon 11: Habrosaurus dilatus; Habrosaurus dilatus; 14 elements.
* Taxon 12: Caudata indet.; Caudata indet. and Scapherpeton tectum; 25 elements.
* Taxon 13: cf. Odaxosaurus piger; Odaxosaurus piger and Peltosaurus species; 29 elements.
* Taxon 14: Squamata indet.; Leptochamops denticulatus; element count not listed.
* Taxon 15: Trionychidae indet.; Aspideretoides species, Helopanoplia distincta, Trionychidae indet., and Plastomenus species; 24 elements.
* Taxon 16: Baenidae indet.; Baenidae indet.; 28 elements.
* Taxon 17: Adocus species; Adocus species; 7 elements.
* Taxon 18: Basilemys species; Basilemys sinuosa; 2 elements.
* Taxon 19: Compsemys victus; Compsemys victus; 5 elements.
* Taxon 20: Chelonia indet.; Aves indet. and Ornithomimidae indet.; 5 elements.
* Taxon 21: Champsosaurus species; Champsosaurus species; 33 elements.
* Taxon 22: Alligatoroidea indet.; Brachychampsa species, Allognathosuchus species, and Eusuchia indet. = Leidyosuchus; 1728 elements.
* Taxon 23: cf. Borealosuchus species; Allognathosuchus species, Aublysodon species, Paronychodon lacustris, and Eusuchia indet. = Leidyosuchus; 56 elements.
* Taxon 24: Navajosuchus mooki; Allognathosuchus species; 1 element.
* Taxon 25: Dakotaraptor steini; Aublysodon mirandus, Dromaeosaurus species, and Saurornitholestes species; 8 elements.
* Taxon 26: Acheroraptor temertyorum; Saurornitholestes species; 30 elements.
* Taxon 27: Richardoestesia isosceles; Richardoestesia species and Saurornitholestes species; 16 elements.
* Taxon 28: Paronychodon lacustris; Paronychodon lacustris; 6 elements.
* Taxon 29: Pectinodon bakkeri; Troodon formosus; 4 elements.
* Taxon 30: Nanotyrannus lancensis; Aublysodon mirandus; 8 elements.
* Taxon 31: Tyrannosaurus rex; Tyrannosaurus rex; 6 elements.
* Taxon 32: Tyrannosauridae indet.; no entry for 1999 study; 6 elements.
* Taxon 33: Struthiomimus sedens; Ornithomimus species, cf. O. velox, and cf. Struthiomimus species; 6 elements.
* Taxon 34: Chasmosaurinae indet.; no entry for 1999 study; 1 element.
UW 26303 is a key specimen for determining the location of the local K/Pg boundary (Figs. 7.14–7.17, 8). It consists of an associated ornithomimid pedal phalanx and ungual collected from the surface at V-91004, a locality previously interpreted as Puercan (Eberle and Lillegraven, Reference Eberle and Lillegraven1998a, Reference Lillegraven and Eberle1999) but recently proposed to be latest Maastrichtian (Wroblewski, Reference Wroblewski2025). The elements were within 3 m of each other when collected and were weathering from the carbonaceous shale near the top of a hill. Neither element could have rolled downhill from an overlying outcrop and there are no faults or channelized deposits in the immediate vicinity that would have facilitated reworking of older fossils into a younger deposit. UW 26303 either represents in-situ fossils in a latest Cretaceous deposit, in-situ fossils of a Paleocene ornithomimid, or a set of associated fossils that were transported upward from Cretaceous strata located approximately 50 m stratigraphically below, into a mudstone-dominated, Paleocene site via unknown mechanisms.
Newly interpreted stratigraphic horizons traced out in satellite imagery and calibrated with ground-based observations and measurements provide the foundation for a fresh attempt at correlations between fossil sites in the interval spanning the K/Pg boundary (Fig. 14). From the revised interpretation, it appears that the faunally defined K/Pg boundary horizon proposed by Eberle and Lillegraven (Reference Eberle and Lillegraven1998a) crosses several stratigraphic intervals. None of the fossil-bearing channel sandstone bodies in the southern half of the area can be confidently traced to equivalent channel bodies just 500 m to the north. Likewise, the fossil-rich, mudstone-dominated locality, V-91004, to the north cannot be directly correlated with channel bodies and mudstone-rich outcrops to the south.
Stratigraphy of deposits spanning the K/Pg boundary in the Ferris Formation. (1, 2) Interpreted stratal horizons in the K/Pg boundary section of the Ferris Formation. Dashed lines indicate correlations with some uncertainty and solid lines are horizons that are traceable with higher confidence. The yellow polygons are channel sandstone bodies, and the dashed red line is the faunally defined K/Pg boundary (as depicted by Eberle and Lillegraven, Reference Eberle and Lillegraven1998a, fig. 3). Stars denote fossil sites from which dinosaur teeth and bones were collected. (3) Photograph with interpreted stratigraphic surfaces of the fluvial sandstone body proposed to span the K/Pg boundary by Eberle and Lillegraven (Reference Eberle and Lillegraven1998a). Red line is a scour surface lined with coarse-grained sand, white line is the boundary between two downstream-accreting bars or components of a single bar, and yellow lines depict individual accretion sets in the bars. View is to the east. Scale bar is 1 m.

Figure 14. Long description
A multi-panel figure consisting of two aerial maps and one field photograph.
Panel 1: An aerial view of a desert landscape with a scale bar from 0 to 1000 meters. A white arrow points West, labeled with an N for North. A dashed red line representing the K / P g boundary runs West to East across the center. Several fossil sites are marked with circles and alphanumeric labels, including V-91004 in the West and a cluster in the East containing V-91031, V-91016, V-92012, V-91010, V-91032, V-91009, V-92018, V-92010, and V-91033.
Panel 2: The same aerial view as Panel 1 but with added geological interpretations. Yellow polygons represent channel sandstone bodies distributed across the area. White stars indicate fossil sites where dinosaur teeth and bones were found. Various stratal horizons are traced across the map: solid lines (blue and white) indicate high-confidence horizons, while dashed lines (yellow, black, and white) indicate uncertain correlations.
Panel 3: A field photograph of a fluvial sandstone body. In the foreground, a researcher in a dark shirt and light pants kneels for scale next to a 1 meter white vertical scale bar. The sandstone shows distinct bedding. A solid red line near the top marks a scour surface. A white line in the middle separates two downstream-accreting bars. Numerous thin yellow lines trace individual accretion sets within the sandstone layers. The view is oriented toward the East.
An iridium anomaly has not yet been identified in the Ferris Formation, so location of the K/Pg boundary relies on vertebrate fossils (Lillegraven and Eberle, Reference Eberle and Lillegraven1998a, Reference Eberle and Lillegravenb). Complicating the identification of the K/Pg boundary based on vertebrate fossils alone is the observation that non-avian dinosaur bones and teeth were collected from three of the in-channel fossil sites considered by Eberle and Lillegraven (Reference Eberle and Lillegraven1998a) to be Paleocene (Figs. 14, 15). This suggests either reworking of Cretaceous fossils into Paleocene deposits, the existence of Paleocene non-avian dinosaurs, or the possibility that the mammalian specimens identified as Paleocene index taxa instead represent latest Maastrichtian faunas (Wroblewski, Reference Wroblewski2025).
Three equally probable depositional scenarios for the K/Pg boundary section in the Ferris Formation. The red dashed line represents the location of the K/Pg boundary proposed by Eberle and Lillegraven (Reference Eberle and Lillegraven1998a). Stars denote fossil sites from which dinosaur teeth and bones were collected. Triangles denote fossil sites from which euselachian teeth were collected.

Figure 15. Long description
A multi-panel stratigraphic diagram showing three scenarios. Each panel has a vertical Y-axis labeled meters from 0 to 60. A horizontal scale bar at the top indicates 643 m.
* Top Panel: Single bar complex in channel belt. A large yellow lens spans the K forward slash P g boundary. A red line marks the base of the channel. Fossil sites V-91004 (star) and a triangle are located in silty mudstone and carbonaceous shale on the left. Sites V-91016, V-91010, V-92012, and V-92018 are clustered on the right.
* Middle Panel: Confined, stacked channel bodies. The yellow channel sandstone is more deeply incised into the underlying silty mudstone. Fossil locations remain consistent with the top panel.
* Bottom Panel: Unconfined, stacked channel bodies. Multiple thin yellow sandstone layers are separated by red boundary lines, indicating multiple depositional events spanning the boundary.
In all panels, a red dashed line at 0 meters is labeled K forward slash P g question mark. Fossil sites V-91010, V-91032, and V-91009 are located in a lower sandstone unit below the 10-meter mark.
General Lithology Legend:
* Brown: Channel Sandstone with conglomerate.
* Yellow: Channel Sandstone.
* Grey: Silty Mudstone.
* Black: Carbonaceous Shale.
Numerical abundance and taxonomic richness of euselachians increase through the Maastrichtian section but sharply decline in the upper 69 meters (Figs. 16, 17). UW 25605, a possible orectolobiform tooth, was collected in a chunk of sandstone from V-91004 but has not been prepared. Its presence at this locality, together with the associated ornithomimid pedal elements (UW 26303), is consistent with the site being latest Maastrichtian, although it is also possible they were reworked through unknown mechanisms.
Taxonomic richness of euselachian dental elements through the Maastrichtian Ferris Formation. The horizontal axis depicts elevation relative to the approximate K/Pg boundary as identified in this study. The vertical axis represents the number of taxa. Dashed lines represent general trends and are neither calculated nor statistically based.

Figure 16. Long description
The figure consists of two vertically stacked line graphs. Both share a horizontal axis labeled Stratigraphic Position Relative to K / P g Boundary, ranging from minus 600 to 0.
Top Panel: The vertical axis is Number of Specimens, ranging from 0 to 140. The data line remains low, under 20 specimens, from minus 600 to minus 150. A major spike occurs at approximately minus 70, reaching nearly 120 specimens, before dropping to near zero at the 0 mark. A dashed trend line shows a gradual rise from minus 600, a plateau between minus 400 and minus 200, a steep climb to the peak at minus 70, and a sharp descent to 0.
Bottom Panel: The vertical axis is Number of Taxa, ranging from 0 to 5. The data line shows several sharp peaks. The first peak of 3 taxa occurs at minus 510. A second peak of 4 taxa occurs at minus 300. The highest peak of 5 taxa occurs at minus 70, matching the specimen spike in the top panel. The data then drops to 1 taxon at the 0 mark. A dashed trend line shows a steep initial rise to 3, a gradual increase to 5 at the minus 70 mark, and a sharp final drop toward 1.
Numerical abundance of dinosaur fossil elements through the Maastrichtian Ferris Formation. The horizontal axis depicts elevation relative to the approximate K/Pg boundary as identified in this study. The vertical axis represents the number of specimens. Dashed lines represent qualitative trends and are not calculated or statistically based.

Figure 17. Long description
The image consists of two vertically stacked line graphs. Both share a horizontal axis labeled Stratigraphic Position Relative to K / P g Boundary, ranging from negative 600 to 0.
Top Panel: The vertical axis is Number of Specimens, ranging from 0 to 250. The data shows a sharp peak of approximately 200 specimens near negative 510. Other smaller peaks occur between negative 400 and negative 100, with values mostly below 50. A dashed qualitative trend line forms a steep curve up to the major peak and then gradually tapers down toward 0 as it approaches the boundary.
Bottom Panel: The vertical axis is Number of Taxa, ranging from 0 to 10. The data is highly erratic with multiple sharp peaks and troughs. Significant peaks of 8 or 9 taxa occur at negative 510 and negative 360. Other peaks of 6 to 7 taxa are scattered between negative 250 and negative 50. A dashed qualitative trend line forms a broad arch, peaking around negative 400 and dropping sharply just before reaching the 0 mark on the horizontal axis.
Dinosaurian taxonomic richness decreases upward through the top 360 m of the Maastrichtian section (Figs. 16, 17). A reduction of taxa from nine to six (30% loss) is recorded in deposits that accumulated between 360 and 69 m below the approximate location of the K/Pg boundary (as herein proposed). This corresponds to a calculated time span of 493–95 ky using the current estimate of the K/Pg location and 500–96 ky prior to the end of the Maastrichtian using previous estimates (Eberle and Lillegraven, Reference Eberle and Lillegraven1998a). In the final 59 m of section (9 m using estimates of Eberle and Lillegraven, Reference Eberle and Lillegraven1998a), five of the six remaining taxa are lost (83%). This corresponds to the final 81–82 ky of the Maastrichtian using the newly proposed location of the K/Pg boundary and 12–12.5 ky of the Maastrichtian using the older estimated location.
The absolute number of dinosaur specimens also decreases up-section towards the K/Pg boundary in the Ferris Formation (Fig. 17). This is partly due to the presence of two particularly rich sites low in the section that produced hundreds of ceratopsian teeth and disarticulated and fragmentary remains of nodosaurids. Even if those sites are discounted, there is a strong decrease in the abundance of dinosaur specimens in the upper 90 m of the Maastrichtian part of the formation (Figs. 17, 18).
Stratigraphic occurrence of dinosaurs and euselachians through the Ferris Formation. Dashed black lines indicate approximate boundaries between NALMA interval zones. Heavy dashed red line is the approximate location of the K/Pg boundary as defined in this study and Wroblewski (2005). Estimated K/Pg boundary proposed by Eberle and Lillegraven (Reference Eberle and Lillegraven1998a) is denoted by dotted, light red line. NALMA data from Eberle and Lillegraven (Reference Eberle and Lillegraven1998a). Specimens for which no locality data are available are not included. Asterisk denotes calculated age in ky, of key intervals relative to the approximate location of the K/Pg boundary as proposed in this study.

Figure 18. Long description
A complex stratigraphic diagram organized into vertical columns.
* Vertical Axes: The far left axis measures height in meters from 0 to 1200. Adjacent is a column for calculated age in k y relative to the K / P g boundary, with values ranging from minus 400 at the bottom to 560 at the top. A third column lists specific fossil site codes (e.g., V-93030, V-91014).
* Lithology Column: Displays rock types using color-coded blocks. Brown represents Channel Sandstone with conglomerate; yellow is Channel Sandstone; dark gray is Silty Mudstone; purple is Oxidized Mudstone; and black is Carbonaceous Shale. The sequence is dominated by sandstones and silty mudstones.
* Stratigraphic Boundaries: A heavy dashed red line at approximately 620 meters marks the K / P g boundary. A dotted light red line below it indicates an alternative proposed boundary. Dashed black horizontal lines divide the N A L M A (North American Land Mammal Age) zones.
* Fossil Distribution: Silhouettes of dinosaurs and aquatic species are positioned horizontally across the chart, with vertical lines and dots indicating their stratigraphic range.
* Dinosaurs (Left to Center): Includes Pectinodon bakkeri, Dakotaraptor steini, Richardoestesia isosceles, Paronychodon lacustris, Nanotyrannus lancensis, Acheroraptor temertyorum, Struthiomimus sedens, Tyrannosaurus rex, Chasmosaurinae indet., Nodosauridae indet., Edmontosaurus annectens, Ankylosauridae indet., Thescelosaurus sp., and Stygimoloch spinifer. Most dinosaur occurrences terminate at or just below the K / P g boundary.
* Euselachians (Right): Includes Restesia monocuspilatus, Restesia americana, Lonchidion selachos, Myledaphus pustulosus, Myledaphus sp., and Dasyatis sp. These species generally persist higher into the Pu 2 and Pu 3 zones.
* N A L M A Zones (Far Right): The column is divided into La (Lancian) at the bottom, followed by Pu 1, Pu 2, and Pu 3 (Puercan) moving upward. A gray shaded area between 480 and 580 meters is labeled High Base Level Zone.
Discussion
Location of the K/Pg boundary
Correlation between key fossil sites in the heterogeneous succession straddling the K/Pg boundary in the Ferris Formation is hindered by poor exposure and complex fluvial stratigraphic architecture (Fig. 14). Internal scours within and between fluvial barforms can place chronologically younger fossils lithostratigraphically alongside or even below older specimens if the scour cuts below fossil-bearing deposits. This difficulty was acknowledged by Eberle and Lillegraven (Reference Eberle and Lillegraven1998a) when they suggested that the boundary was located stratigraphically below fossil sites V-91010 and V-91032 within a channel sandstone body (Figs. 14, 15). They referred to a Lancian–Puercan zone of uncertainty that encompassed approximately 10 m of stratigraphic thickness. Consequently, the stratigraphic relationship of V-91004, a key fossil locality reported to represent a Pu1 assemblage, to other sites near the boundary zone has never been established beyond a general approximation (Eberle and Lillegraven, Reference Eberle and Lillegraven1998a).
The recovery of non-avian dinosaur fossils such as UW27310 (hadrosaur teeth), UW 27419 (nodosaurid osteoderm), UW 27427 (ceratopsian teeth), Cretaceous mammals (UW 26497, a right m2 of a palaeoryctid), and specimens identified as Protungulatum donnae , (UW 26196 and 27197) from fossil sites in the same fluvial channel body poses a dilemma for identifying the nature and placement of the local K/Pg boundary (Eberle and Lillegraven, Reference Eberle and Lillegraven1998a; Lillegraven and Eberle, Reference Lillegraven and Eberle1999). The discovery of Protungulatum coombsi Archibald et al., Reference Archibald, Zhang, Harper and Cifelli2011, revealed that a species of Protungulatum similar to, but larger than P. donnae lived in the latest Cretaceous and was previously conflated with the latter. The only description of specimens assigned to P. donnae by Eberle and Lillegraven (Reference Eberle and Lillegraven1998b) was a statement that a tooth from the Ferris Formation was morphologically distinct from those collected in the Hell Creek Formation. This suggests that specimens from the Ferris Formation could represent P. coombsi instead of P. donnae. The status of all specimens from the Ferris Formation that were attributed to P. donnae must therefore be treated as indeterminate, pending review.
Except for the particularly fossil-rich locality V-91004, only a small number of isolated specimens has been recovered across the 50-m-thick interval thought to contain the K/Pg boundary and most of the sites are located in channel sandstone bodies of indeterminate age (Figs. 14, 15). Wroblewski (Reference Wroblewski2025) concluded that the boundary was approximately 60 m stratigraphically higher than the base of the sandstone body containing V-91010 and proposed that V-91004 was a latest Maastrichtian site based on the presence of associated ornithomimid phalanges (UW 26303) at that locality. The new stratigraphic correlations of this interval suggest a revised interpretation and at least three potential depositional scenarios to account for the biostratigraphic and sedimentary observations (Fig. 15).
Complete bars in fluvial channel bodies in the Ferris Formation are generally 4–6 m thick, corresponding to a single channel body thickness and minimum flood-stage flow depth of the same scale. With this as a standard, it is most likely that the 20- to 25-m-thick sandstone bodies in the K/Pg interval represent stacked, vertically amalgamated channel belts rather than a single, extremely thick channel belt, although the latter possibility cannot be entirely ruled out. It is conceivable that V-91004 accumulated in the abandoned thalweg of a single, large channel that spans the K/Pg boundary (Fig. 15.1). In this scenario, the apparently mixed Cretaceous and Paleocene faunal elements simply record episodic remobilization of older skeletal remains during Paleocene flood events. Such mixing would not be required if the purportedly Paleocene mammal fossils actually represent a latest Maastrichtian assemblage.
V-91004 could also represent the overbank or abandoned thalweg of a channel that was then incised by the single large, or several stacked channels represented by the 25-m-thick sandstone body to the south (Fig. 15.2). In this case, the extreme downward incision of the thicker sandstone bodies could be reworking previously buried Cretaceous fossils into a Paleocene river. The presence of ornithomimid and possibly orectolobiform remains at V-91004 is difficult to reconcile with the locality representing a Puercan assemblage, unless it spans the K/Pg boundary, or the mammalian taxa are not unambiguously diagnostic of the Paleocene.
Finally, it is possible that V-91004 is an abandoned thalweg fill of one of a series of smaller, but vertically stacked channel bodies represented by the thick body to the south (Fig. 15.3). Again, the problem of comingled Cretaceous and Paleocene taxa persists, assuming that the mammalian fossils previously proposed as diagnostic of a Puercan age are in fact Paleocene taxa.
Fragments of non-avian dinosaur bone collected at V-92012 either represent reworked Maastrichtian specimens in a Puercan channel body or bones that accumulated on a fluvial bar during the Maastrichtian. If P. donnae is unequivocally a proxy for Puercan age and the specimens from the Ferris Formation are correctly identified as this taxon, then its presence in the same channel body that contains dinosaur fossils represents remains that accumulated on a Puercan bar within a channel belt that spans the K/Pg boundary. Alternatively, the entire channel complex could be Maastrichtian if the specimens identified as P. donnae by Eberle and Lillegraven (Reference Eberle and Lillegraven1998b) represent P. coombsi or another species similar to P. donnae. A third possibility is that P. donnae may have a range that extends back into the latest Maastrichtian.
Mammalian taxa recovered from the next apparently stratigraphically higher site, V-91016, that suggested a Paleocene age include Maiorana ferrisensis Dahlberg et al., Reference Dahlberg, Eberle, Sertich and Miller2016, Mimatuta sp. indet., and Protungulatum donnae (Eberle and Lillegraven, Reference Eberle and Lillegraven1998a). Although V-91016 is lithostratigraphically higher than V-92012, both localities are in a weathered fluvial channel sandstone complex that contains scours and accretion sets, making their chronostratigraphic relationships uncertain (Fig. 15). Maiorana ferrisensis has only been reported from the Ferris Formation, so its chronostratigraphic significance is unknown, while Mimatuta and Protungulatum spp. both occur in the mixed channel deposit accumulations of the Cretaceous and Paleocene Bug Creek faunas, making their chronostratigraphic utility unclear (Lofgren, Reference Lofgren1995). The specimens from the Ferris offer no insight to the questions about reworking posed by the Bug Creek faunas but suggest that the presence of Mimatuta spp. is not necessarily a definitive indication of Puercan (or Paleocene) age.
Based on revised stratigraphic measurements, V-91004 is here proposed to be approximately 47 m stratigraphically higher than the base of the channel complex that contains V-91010 (Fig. 15). Mammalian fossils collected from V-91004 that were previously considered to indicate a Paleocene age include Mesodma ambigua Jepson, 1940, M. formosa Marsh, 1889, M. hensleighi Lillegraven, Reference Lillegraven1969, Oxyprimus galadrielae Van Valen, Reference Van Valen1978, Peradectes sp. cf. P. pusillus Matthew and Granger, Reference Matthew and Granger1921, Protungulatum donnae , and P. sloani Van Valen, Reference Van Valen1978 (Eberle and Lillegraven, Reference Eberle and Lillegraven1998a). Complicating this interpretation was the recovery of an associated pedal phalanx and ungual from an ornithomimid dinosaur (UW 26303) along with the purported Paleocene mammals at V-91004. Mesodma spp., Peradectes, and Protungulatum spp. have since been found to occur in Cretaceous as well as Paleocene deposits (Korth, Reference Korth, Janis, Gunnell and Uhen2008; Archibald et al., Reference Archibald, Zhang, Harper and Cifelli2011; Smith and Wilson, Reference Smith and Wilson2016). Oxyprimus galadrielae is a problematic taxon that was collected from the mixed Cretaceous and Paleocene deposits of the Bug Creek area in the Hell Creek Formation (Lofgren, Reference Lofgren1995). Its temporal range therefore remains uncertain, and it cannot reliably be considered an indicator of Paleocene age. The ambiguity represented by vertebrate fossils in this complex channelized setting means that the precise location of the K/Pg boundary will remain uncertain unless and until an iridium anomaly can be located.
Reworked or in-situ dinosaur bones?
Lillegraven and Eberle (Reference Lillegraven and Eberle1999) concluded that UW 26303, an associated pedal ungual and phalange, was reworked from Maastrichtian deposits but did not suggest how that occurred. It was surface collected from a carbonaceous mudstone, which is in contrast to typical reworked specimens that occur in channel sandstone. Lillegraven and Eberle (Reference Lillegraven and Eberle1999) did not figure the elements but cited the purportedly waterworn appearance of the bones to support their interpretation. Examination of both elements demonstrates that they exhibit signs of subaerial exposure such as cracked cortical bone, exfoliation, and jagged instead of rounded edges (Fig. 8). Exfoliation and other weathering features are typical of subaerially exposed bone and result from exposure to UV, changes in temperature, changes in humidity, and wet-dry cycles (Vietti, Reference Vietti2016). The surface cracking visible on UW 26303 is characteristic of weathering stage 1 (WS 1) that can develop within 50–150 wet–dry cycles in a subaerial environment (Pokines et al., Reference Pokines, Faillace, Berger, Pirtle, Sharpe, Curtis, Lombardi and Admans2018).
The surface texture suggests that both elements of UW 26303 were exposed subaerially before burial and their preservation in a carbonaceous mudstone is consistent with deposition in an abandoned channel or oxbow lake. Such environments are prone to wet–dry cycles and represent a likely area to concentrate carcasses of animals that died during droughts or were washed in during floods, only to decay and weather when floodwaters recede. The presence of UW 26303, together with questions about the chronostratigraphic significance of the mammalian fossils collected from V-91004 raise the possibility that instead of representing a Puercan assemblage, this locality represents a latest Maastrichtian site (Wroblewski, Reference Wroblewski2025). Alternatively, the ornithomimid remains could represent a Paleocene non-avian dinosaur, or elements that were reworked via an unknown mechanism from Cretaceous deposits located approximately 50 m stratigraphically below the mudstone-dominated fossil site.
Euselachian taxonomic richness through time
While acknowledging the uncertainty surrounding precise placement of the K/Pg boundary in the Ferris Formation, some observations can be made regarding stratigraphic trends in certain taxa. If the K/Pg boundary is located where previous studies have suggested, then the apparent declines in abundance and taxonomic richness are still present in the uppermost 7 meters of the Maastrichtian section. An increase in abundance and richness through the section was also documented in the Hell Creek Formation of northeastern Montana (Wynd et al., Reference Wynd, DeMar and Wilson2020). No exclusively Maastrichtian taxa were collected from the Paleocene fossil sites in the Ferris Formation, but specimens of Myledaphus sp. were recovered from localities in the Hanna Formation dated to 61–59 Ma based on fossil mammals (Wroblewski, Reference Wroblewski2004, fig. 5).
In the Hell Creek Formation, Wynd et al. (Reference Wynd, DeMar and Wilson2020) estimated that taxonomic richness decreased during the final 50 ky of the Maastrichtian. In the Ferris Formation, the greatest numerical abundance and taxonomic richness are at a site (V-92010) that is here suggested to be approximately 69 m stratigraphically below the K/Pg boundary, or 19 m below the boundary zone proposed by Eberle and Lillegraven (Reference Eberle and Lillegraven1998a). V-92010 is calculated to have accumulated approximately 94 ky before the K/Pg boundary (as estimated in this study) and 26 ky before the boundary based on Eberle and Lillegraven (Reference Eberle and Lillegraven1998a). In either case, abundance and richness decreased towards the K/Pg boundary and the pattern reported by Wynd et al. (Reference Wynd, DeMar and Wilson2020) is also recognizable in the Ferris Formation. Sampling bias may have a part to play in this because in both formations, localities closest to the boundary have smaller sample sizes than those lower in the section. The cooling event that occurred during the final 30 ky of the Maastrichtian may have influenced these apparent trends but it was superimposed on a longer-term warming trend that resumed after the K/Pg impact (O’Connor et al., Reference O’Connor, Jerrett, Price, Lyson, Lengger, Peterse and Van Dongen2024).
The increased abundance and taxonomic richness of euselachian fossils through the Maastrichtian part of the Ferris Formation, prior to declines, coincide with a shift from a fluvial sandstone-dominated to carbonaceous shale-dominated part of the stratigraphy (Fig. 16). These trends may signal the onset of transgression of the Western Interior Seaway during the latest Maastrichtian, and marine flooding of the basin in the earliest Torrejonian supports such a scenario (Wroblewski and Steel, Reference Wroblewski and Steel2022). The absence of euselachian specimens in the early Paleocene sites is consistent with major environmental perturbations resulting from the catastrophic bolide impact at the end of the Cretaceous. The presence of Dasyatis sp. in the Puercan 3 interval zones suggests recolonization of brackish water estuarine habitats by opportunistic generalists in the wake of the ecosystem breakdown.
Dinosaurian abundance and taxonomic richness through time
Lillegraven and Eberle (Reference Lillegraven and Eberle1999) concluded that non-avian dinosaur diversity remained high throughout the Maastrichtian section of the Ferris Formation and that there were no changes in the patterns of occurrence of non-mammalian taxa. Neither of these interpretations is supported by the numerical data derived from the collections (Figs. 16–18). Lillegraven and Eberle (Reference Lillegraven and Eberle1999) only discussed the number of taxa and did not provide specimen counts or estimates of diversity. Therefore, they were attempting to estimate taxonomic richness rather than diversity. Taxonomic richness is the number of species present in a community whereas diversity is based on the number of species and their abundance in the community (Purvis and Hector, Reference Purvis and Hector2000).
The cause of the reductions in the Ferris Formation, whether representing a real biological signal or the result of taphonomical processes, remains uncertain. The uncommon ornithischians Stygimoloch and Thescelosaurus have not been collected from latest Cretaceous sites associated with lithofacies indicative of high paleo-water tables such as carbonaceous shale, laminated rippled silty mudstone, and laminated claystone (Fig. 18). This suggests that paleoecological factors played a role in the distribution of Thescelosaurus since it has been hypothesized to be a burrowing animal (Button and Zanno, Reference Button and Zanno2023) that would intuitively have preferred environments with low water tables. Likewise, pachycephalosaurs have been interpreted as preferring well-drained depositional settings (Carpenter and Young, Reference Carpenter and Young2002). This may account for their absence in carbonaceous shale-rich fossil sites approaching the local K/Pg boundary.
With a bias towards isolated teeth and robust skeletal elements, edentulous taxa such as caenagnathids and ornithomimids are probably underrepresented in the collection from the Ferris Formation. At least 15 dinosaurian taxa are represented in the Maastrichtian succession but the greatest number of taxa at any one locality is nine. A maximum of 60% of the total taxonomic composition is therefore represented at any sampling site. Intuitively, this makes sense because some taxa, such as Ankylosauridae are represented by just two specimens and others, such as Stygimoloch (n = 3) and Thescelosaurus (n = 3), are uncommon.
The decrease in dinosaurian taxonomic richness and numerical abundance roughly coincides with an increase in euselachian numerical abundance throughout the Maastrichtian section (Figs. 16, 17). Both trends coincide with the lithological change from a channel sandstone-rich to carbonaceous shale- and siltstone-rich lithology. The stratigraphically upward-diminishing number of dinosaurian specimens and taxa is more likely to represent a taphonomically induced sampling bias than a real ecological signal, but this remains open for interpretation.
Scarcity of amphibians and squamates
Remains of amphibians and squamates are uncommon in the collections from the Ferris Formation. Careful screen washing and picking of fossil-rich localities did not result in the abundance and taxonomic richness recovered from other time-equivalent deposits (Estes, Reference Estes1964; Breithaupt, Reference Breithaupt1982). Their scarcity in coarse-grained fluvial channel deposits is expected, given their small, fragile nature but their equally low representation in fine-grained fossil sites is unexpected. The increasing abundance and taxonomic richness of euselachians through the lower and middle, but not uppermost Maastrichtian section suggests that brackish water was present in the local fluvial systems (Wroblewski, Reference Wroblewski2004). This may partially explain the low abundance and richness of amphibians since they are extremely sensitive to salinity, although not as much as has previously been assumed (Hopkins and Brodie, Reference Hopkins and Brodie2015). The scarcity of squamates, despite the relative abundance of mammals, especially in the Paleocene remains unexplained.
Conclusions
Based on vertebrate fossils alone, the K/Pg boundary is herein suggested to occur approximately 50 m stratigraphically above its previously proposed location in the Ferris Formation. Its precise location remains unknown because an iridium layer has not yet been located and the biostratigraphic data are not conclusive.
Seventeen non-mammalian vertebrate taxa previously described from the Ferris Formation by Lillegraven and Eberle (Reference Lillegraven and Eberle1999) are instead attributable to different taxa. Likewise, four euselachian taxa previously identified by Wroblewski (Reference Wroblewski2004) are now referred to different taxa.
Associated pedal elements of an ornithomimid dinosaur represent the stratigraphically highest occurrence of non-avian dinosaurs and were recovered from a site previously interpreted to be in the Pu1 interval zone. The mammalian taxa at that site are not necessarily unique to the Paleocene and have been reported from Cretaceous deposits in other locations. Specimens from the Ferris Formation attributed to Protungulatum donnae by Eberle and Lillegraven (Reference Eberle and Lillegraven1998b) could represent a different taxon and are therefore of dubious chronostratigraphic significance.
Euselachian taxonomic richness and numerical abundance generally increase in deposits representing 858–789 my prior to the K/Pg boundary but decrease in the final 26–94 ky of the Maastrichtian. This matches a pattern reported in the time-equivalent Hell Creek Formation in Montana and may record an early phase of the Paleocene transgression of the Western Interior Seaway followed by environmental perturbation associated with a short cooling event prior to the K/Pg impact. The presence of only one euselachian taxon, Dasyatis sp., from just two fossil sites in the Puercan section is consistent with gradual recolonization by some euselachians following catastrophic environmental perturbation after the K/Pg impact event.
Prior claims of high and unchanging taxonomic diversity of non-avian dinosaurs through the latest Maastrichtian are not supported by the data. Taxonomic richness decreased from nine to six taxa (30% loss) in deposits that accumulated 493–95 ky prior to the end of the Maastrichtian using the new estimate for the location of the K/Pg boundary and 500–96 ky prior to the end of the Maastrichtian using the previous estimate (Eberle and Lillegraven, Reference Eberle and Lillegraven1998a). Depending on where the K/Pg boundary is located in the section, five of the six remaining taxa (83%) are lost during the final 81–12 ky of the Maastrichtian. The causes of this decrease, whether a real biological signal or the result of taphonomical processes remain uncertain but the close correlation to a lithological change in the section suggests the latter.
Acknowledgments
Thanks C. Brochu for assistance with the crocodilian material, D. Fowler for information on ceratopsians, W. Joyce for insight into the turtle specimens, L. Vietti for providing access to the collections at UW, and especially W. Worrell for help with the location, revision, digital photography, and cataloguing of specimens. K.O. Malmberg helped with digital microscopic photography and D. Kasymova provided logistical support. This manuscript benefitted greatly from reviews by D. Brinkan and D. DeMar. Much appreciation to J. Kastigar and H.-D. Sues for guidance during the initial submission and continued support through the review and revision process.
Competing interests
The author declares none.
Data availability statement
Supplementary figures, systematic descriptions of the taxa and specimens identified in this study, and additional figures are available at: https://datadryad.org/dataset/doi:10.5061/dryad.tqjq2bwc7 or (forthcoming on Dryad).


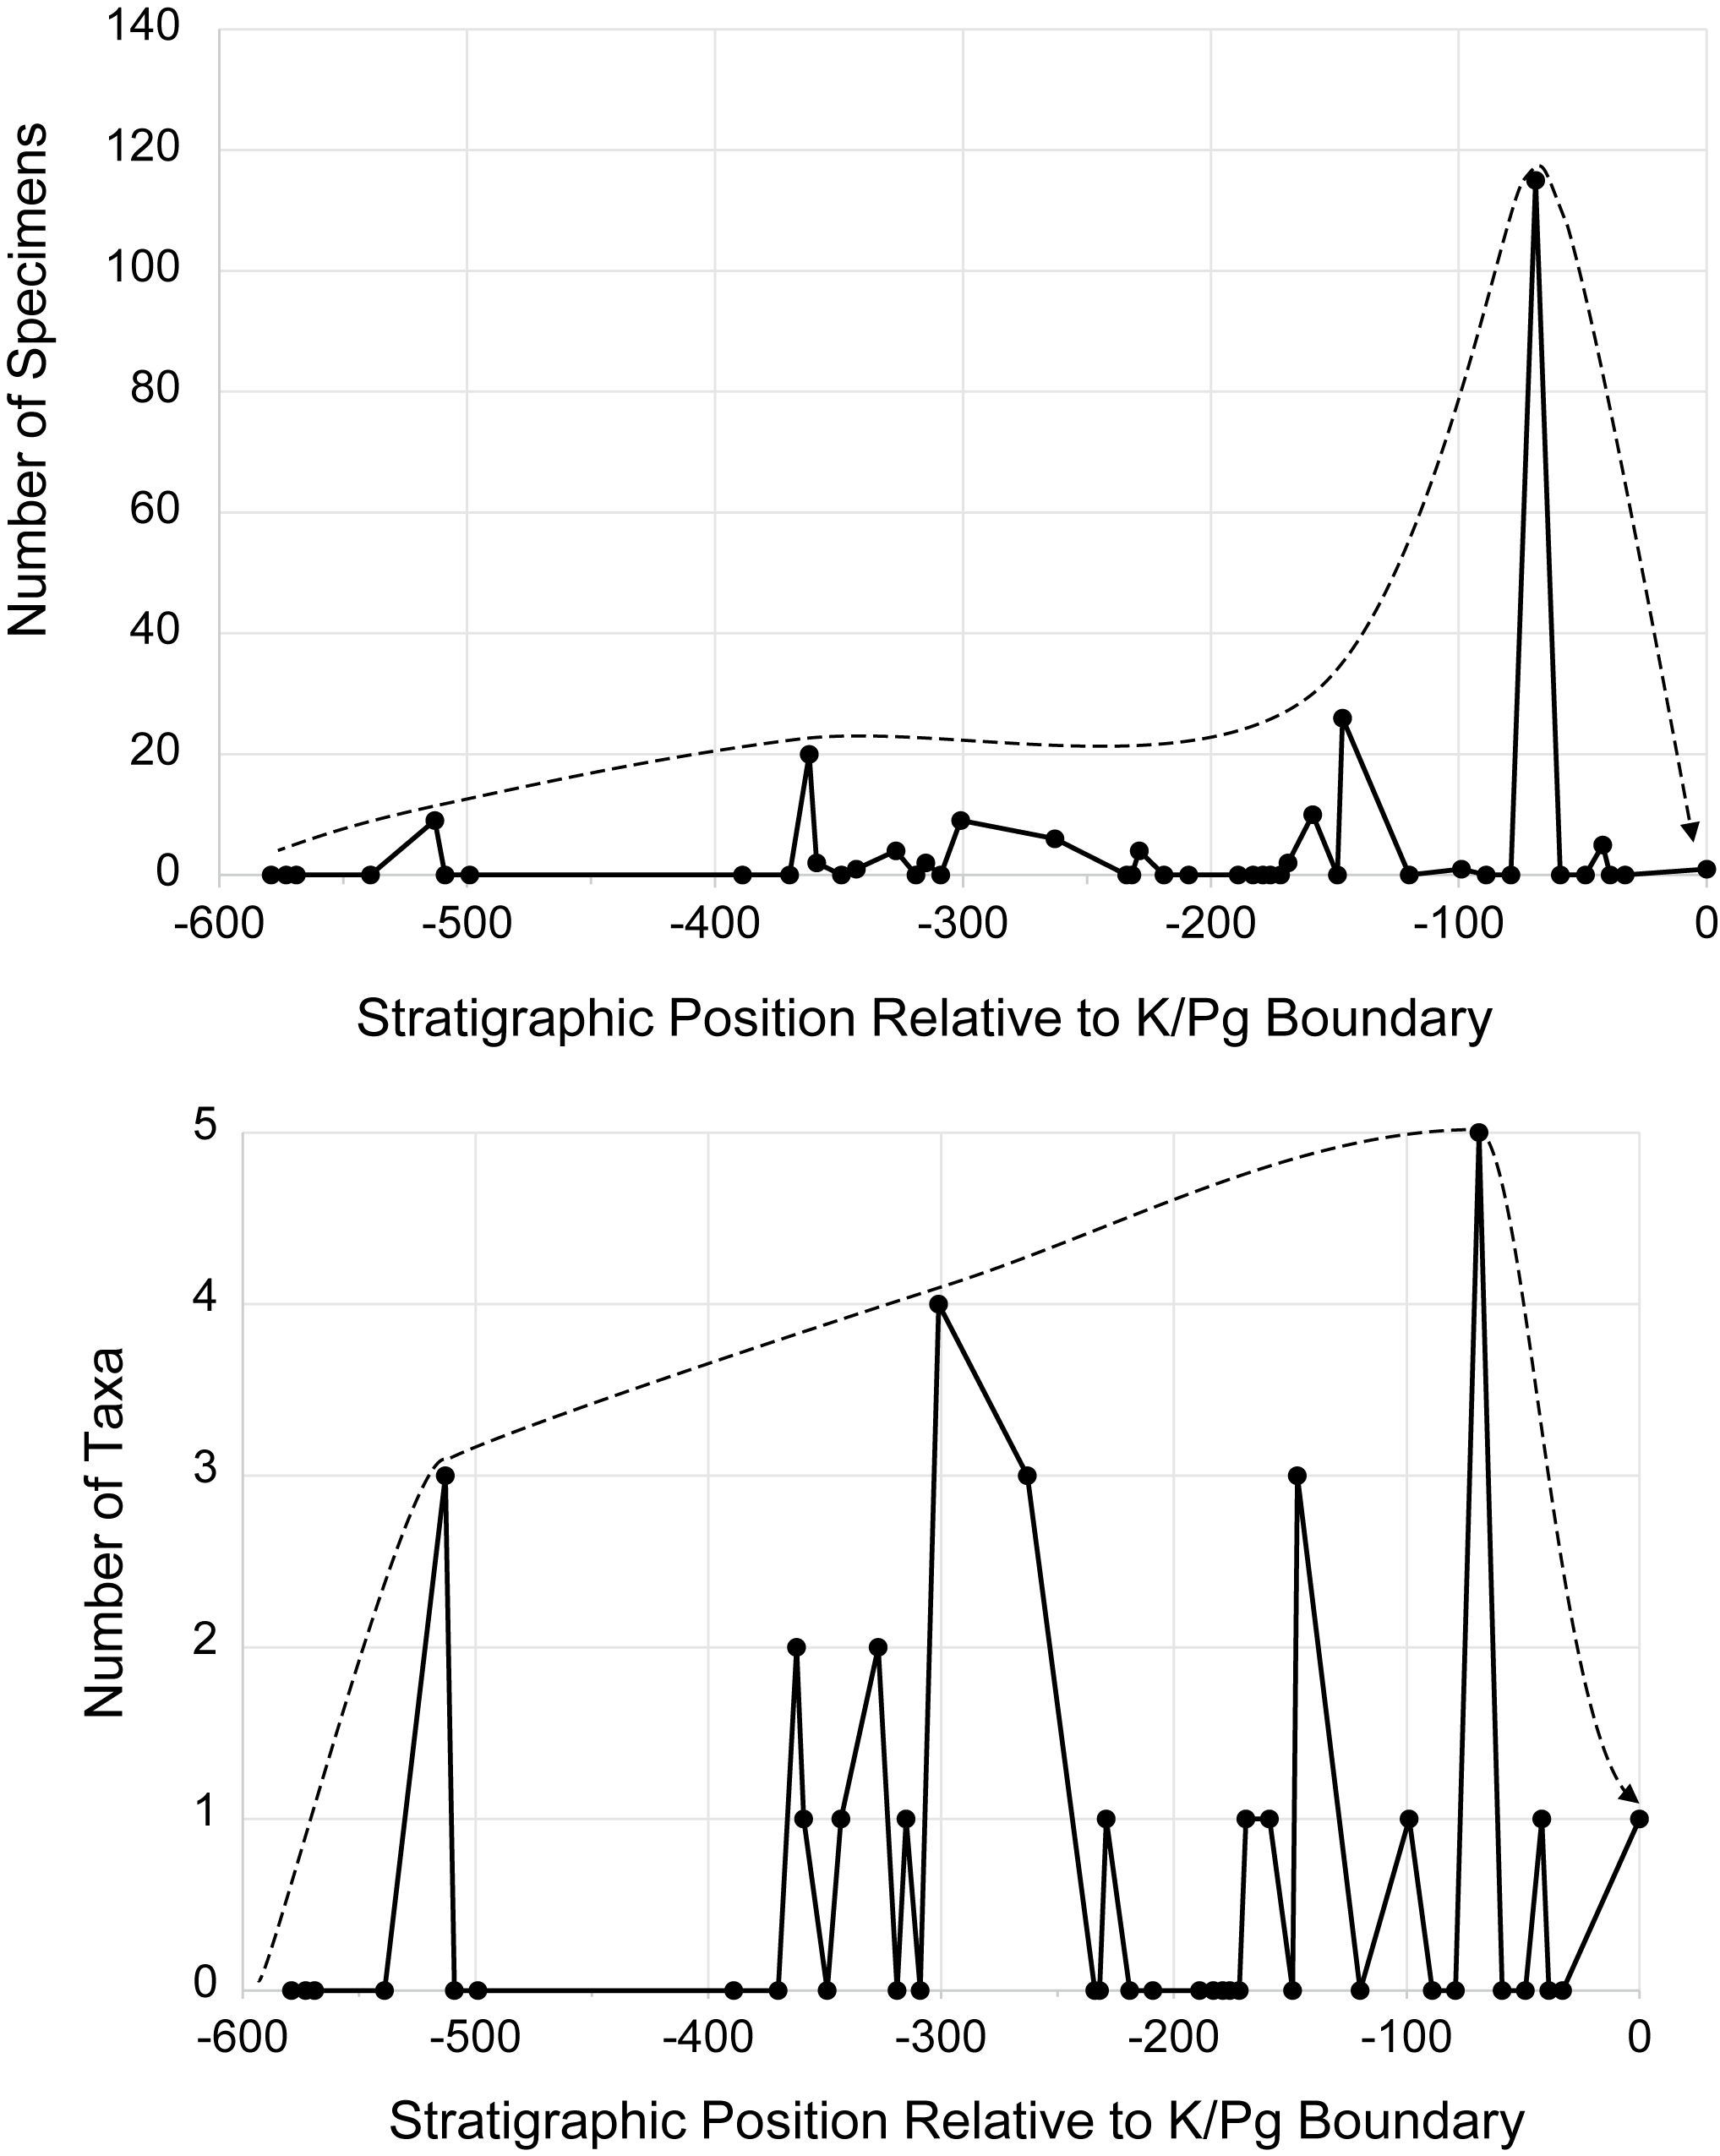
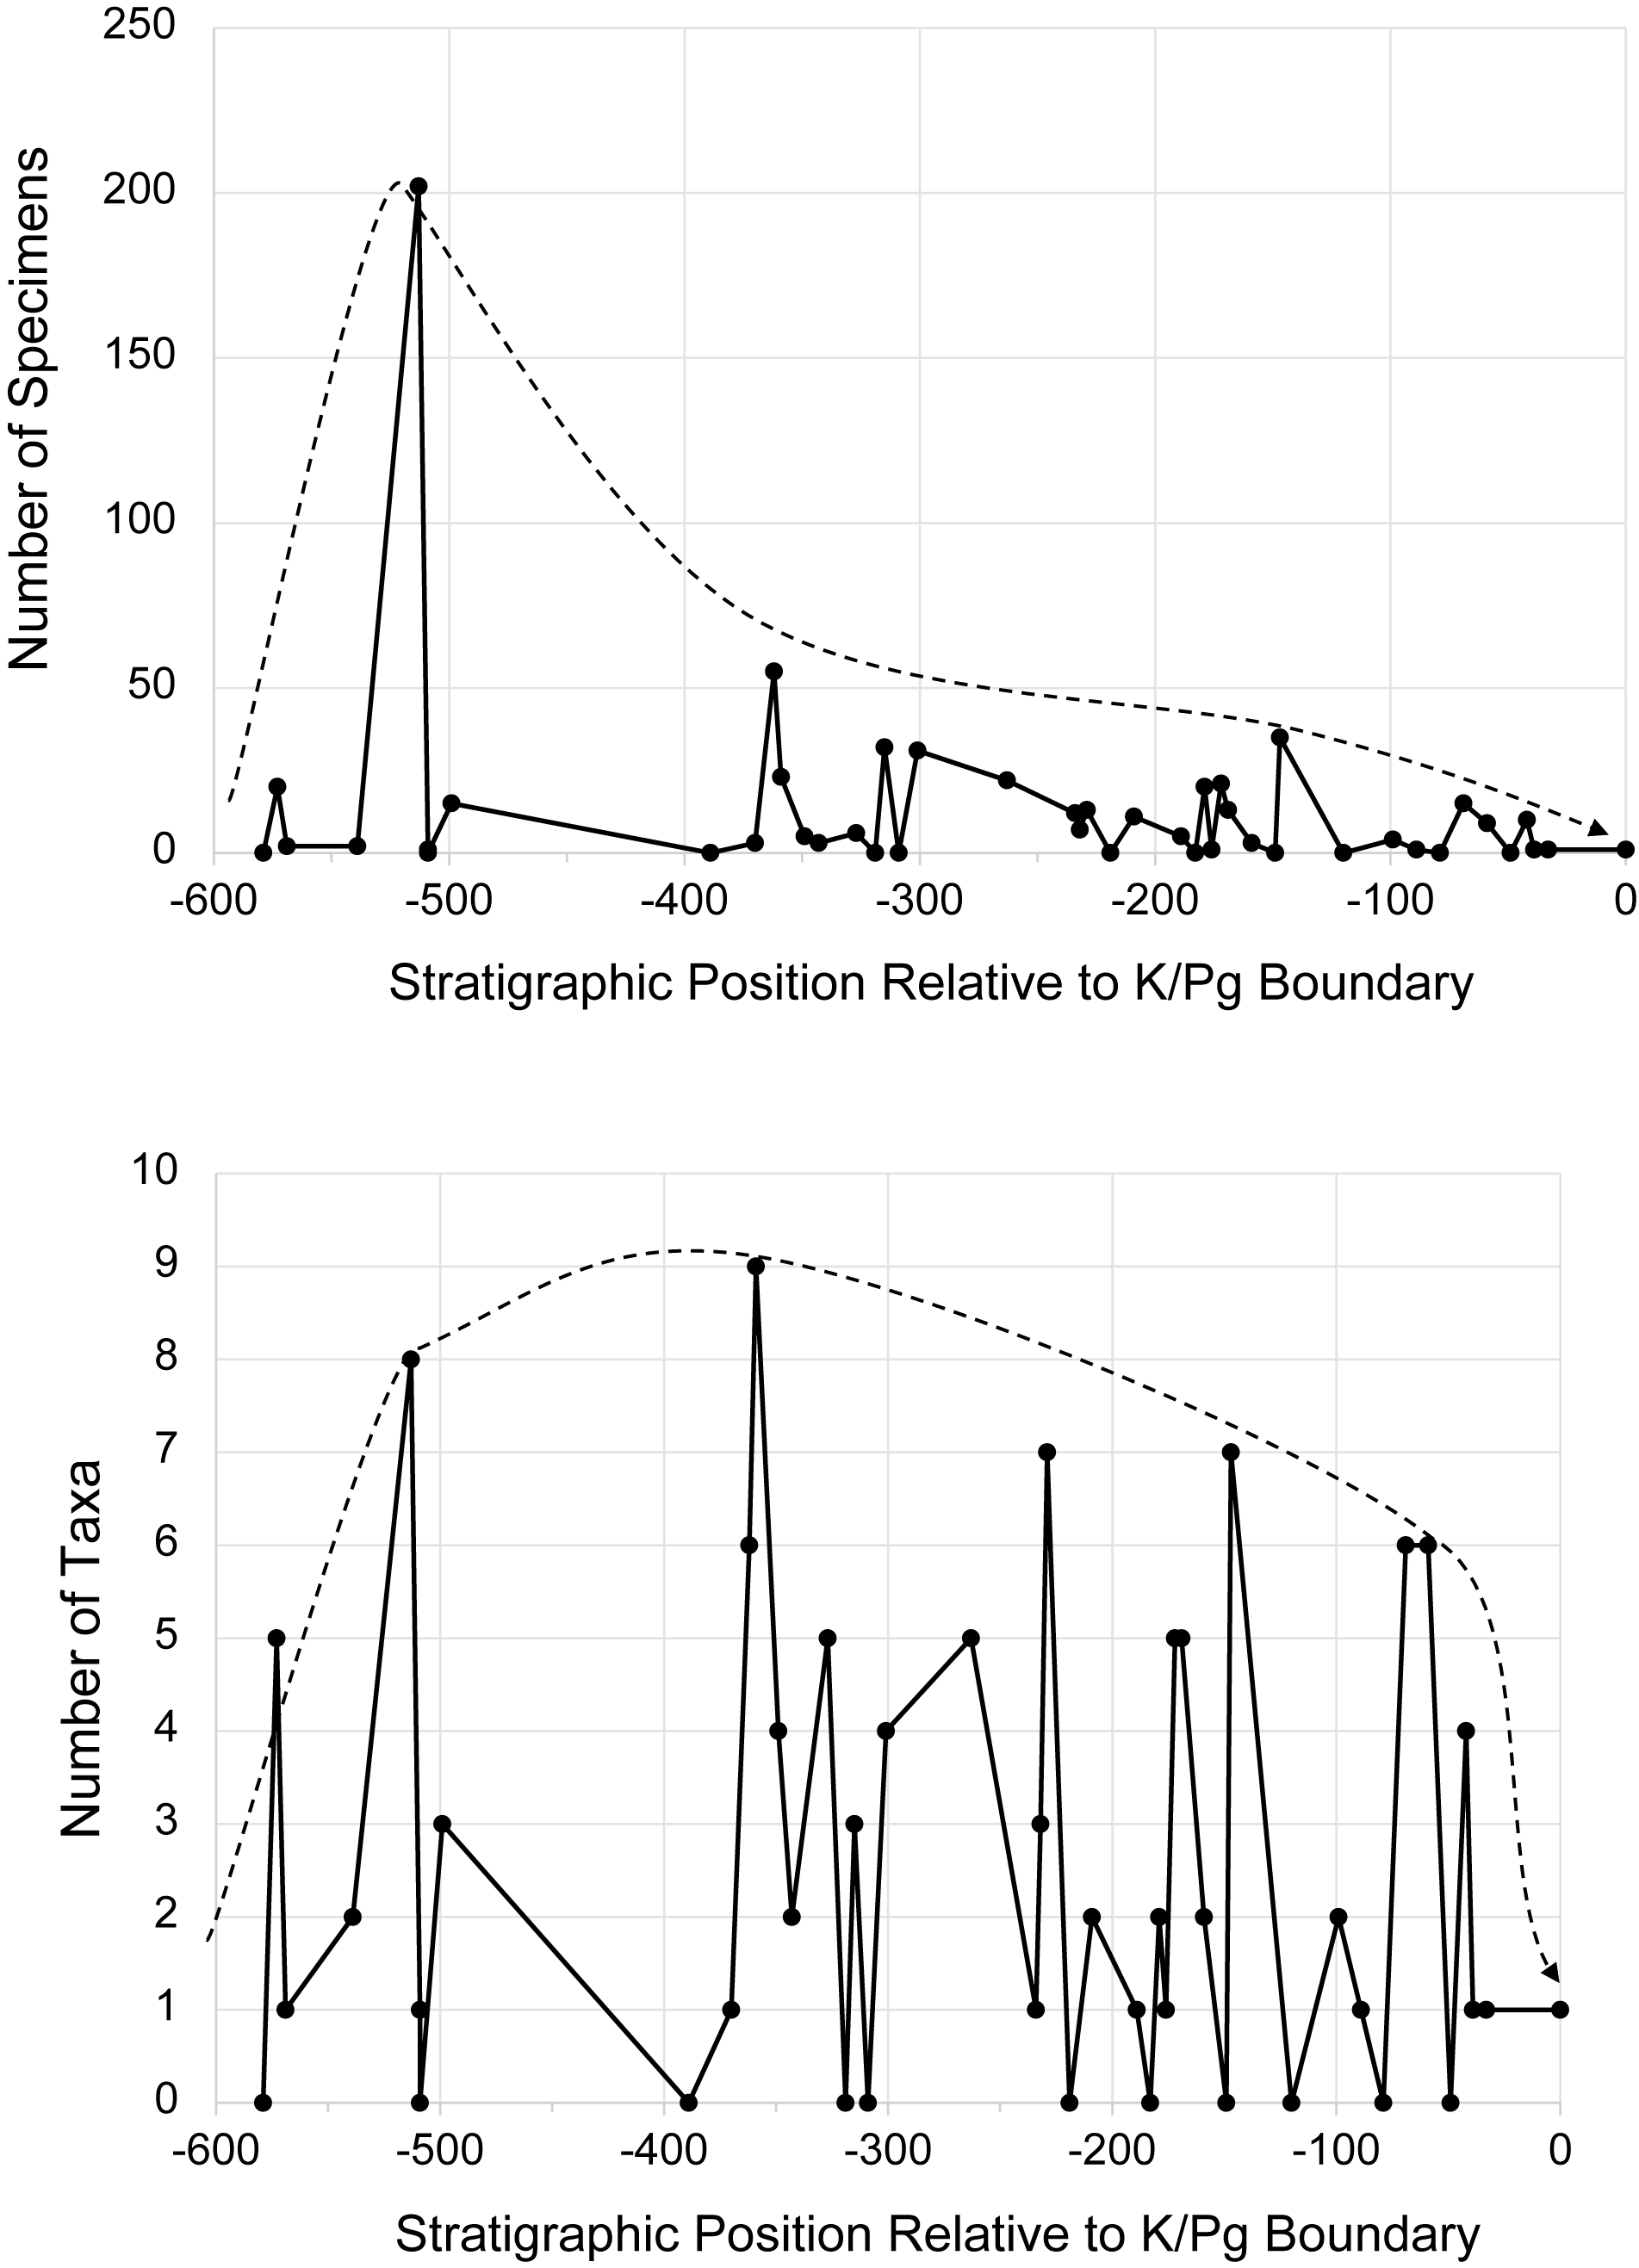


 Open access

