Introduction
The multiprincipal metallic systems, commonly known as high-entropy alloys, were first reported by Yeh et al. [Reference Yeh, Chen, Lin, Gan, Chin, Shun, Tsau and Chang1, Reference Murty, Yeh and Ranganathan2, Reference Koch3, Reference Maulik, Kumar, Kumar, Dewangan and Kumar4] in the year 2004. In subsequent years, many researchers have reported that they possess good mechanical strength [Reference Munitz, Salhov, Hayun and Frage5, Reference Zou6, Reference Shun and Du7, Reference Guo, Liu, Zhang, Qi, Wang, Zhao, Shang and Xiang8, Reference Ghassemali, Sonkusare, Biswas and Gurao9], better corrosion resistance [Reference Zhang and Zhang10, Reference Wang, Zhang, Davies and Wu11, Reference Lin and Tsai12, Reference Kumar, Maulik, Sharma, Prasad and Kumar13], improved oxidation resistance [Reference Butler and Weaver14, Reference Liu, Cheng, Shang, Wang, Li and Zhao15, Reference Chen, Sui, Qi, He, Wei, Meng and Sun16], higher wear resistance [Reference Wang, Yang, Yang, Zhang and Qiao17, Reference Wang, Yang, Yang, Zhang, Ma and Qiao18, Reference Yadav, Kumar and Biswas19, Reference Kumar, Kumar, Maulik, Pradhan, Kumar and Patnaik20], and high temperature stability [Reference Kumar, Maulik, Kumar, Prasad and Kumar21, Reference Maulik and Kumar22, Reference Maulik, Kumar, Kumar, Fabijanic and Kumar23, Reference Zhang, Lu, Ma, Liaw, Tang, Cheng and Gao24] in comparison with conventional alloys. Among the many reported HEA systems, the Al–Fe–Cr–Ni–Co system is available abundantly [Reference Munitz, Salhov, Hayun and Frage5, Reference Zou6, Reference Shun and Du7, Reference Guo, Liu, Zhang, Qi, Wang, Zhao, Shang and Xiang8, Reference Ghassemali, Sonkusare, Biswas and Gurao9, Reference Zhang and Zhang10, Reference Wang, Zhang, Davies and Wu11, Reference Lin and Tsai12]. The system is observed to possess good mechanical strength, better corrosion resistance, but poor ductility [Reference Qiao, Ma, Huang, Chuang, Liaw and Zhang25]. Therefore, to obtain an optimum combination of strength and ductility, a number of attempts have been made by various researchers by changing the relative proportion of aluminum [Reference Shun and Du7, Reference Lin and Tsai12], iron and nickel [Reference Wang, Gao, Ma, Yang, Wang, Moroz and Qiao26], and cobalt [Reference Chen, Fu, Fang, Xiao and Zhu27, Reference Fang, Chen and Fu28, Reference Qin, Xue, Fan, Chen, Wang, Su, Ding and Guo29, Reference Zhao, Cui, Wang, Zhao, Zhang and Wang30] in the Al–Fe–Cr–Ni–Co HEA system.
For industrial application of HEAs, it is very important to understand their wear behavior under different conditions (e.g., dry, oil lubrication, acidic environment). The wear analyses of high-entropy alloys can be very useful to predict and to extend the service life of moving parts and hence to reduce the operating cost. From the literature survey, it has been observed that only limited studies have been conducted to understand the wear behavior of HEAs under dry as well as under wet conditions. Few of the important studies and their conclusions are as follows: Hsu et al. [Reference Hsu, Yeh, Chen and Shun31] have carried out the wear study on Al0.5CoCrCuFeNiBx (x = 0 to 1.0) HEAs under dry conditions and have indicated that as boron content increases, the wear resistance increases. Tong et al. [Reference Tong, Chen, Chen, Yeh, Shun, Lin and Chang32] have studied the wear behavior of AlxCoCrCuFeNi (x = 0 to 3.0) HEAs under dry conditions and have concluded that as aluminum content increases, the wear resistance also increases due to the transformation of phase from FCC to BCC. Chen et al. [Reference Chen, Lin, Yeh, Chen, Huang and Chuang33] have studied the effect of vanadium content on wear resistance of Al0.5CoCrCuFeNiVx (x = 0 to 2.0) HEAs under dry conditions and have reported that with the increase in vanadium content, there is an enhancement in wear resistance. Duan et al. [Reference Duan, Wu, Hua, Yuan, Wang, Tua, Kou and Li34] and Yu.et al. [Reference Yu, Liu, Zhang, Li, Wang, Kou and Li35] have studied the wear behavior of AlCoCrFeNiCu HEA in hydrogen peroxide solution. Yu et al. [Reference Yu, Wang, Li, Yang, Kou and Liu36] have reported the wear behavior of AlCoCrFeNi(Ti0.5) HEA under oil and MAC lubrication conditions and concluded that the tribological properties of HEAs under gear oil are lower than those under MACs.
In the present study, Al0.4FeCrNiCox (x = 0, 0.25, 0.5, 1.0 mol) HEAs have been developed by arc melting method. The wear behavior of those HEAs is investigated under oil lubricating conditions by varying the sliding speed, sliding distance, and the normal load at room temperature. Furthermore, the effect of cobalt content on microstructure, microhardness, density, thermal stability, and compressive yield strength of Al0.4FeCrNiCox (x = 0, 0.25, 0.5, 1.0 mol) HEAs is also studied. This study is expected to provide further insights into the wear behavior of HEAs and hence will help the research community in developing wear-resistant HEAs.
Wear analysis
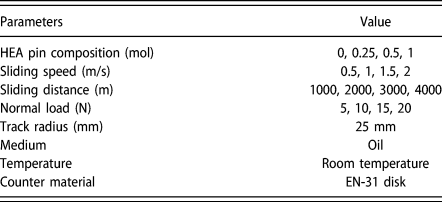
The wear tests were conducted according to ASTM G99-04 standards at room temperature using a pin-on-disk tribometer (DUCOM, CM9112). Cylindrical specimen of dimensions (Ø 8 mm × 23 mm) were tested under commercially available engine oil (SAE Grade: 20W-40) with viscosity of 13.5–15.5 at 100 °C (cSt), viscosity index of 114, flash point of 240 °C, and pour point of −21 °C. The HEA pin samples were slid against a standard EN-31 steel disk of dimensions Ø 100 mm × 8 mm and with a hardness of 60–65 HRC. The HEA samples were ground before each experiment with a series of emery papers (220, 400, 600, 800, 1000 grit) and followed by ultrasonic cleaning in an acetone bath. The wear tests were carried out at different sliding parameters as listed in Table I. The coefficient of friction (COF) was recorded automatically through computer-controlled LabVIEW software. Each experiment was repeated three times, to ensure the repeatability. The specific wear rate of the HEA specimens was calculated according to the following equation:
 $${W_{\rm{s}}} = {{\Delta m} \over {\rho \times {V_{\rm{s}}} \times t \times {f_{\rm{n}}}}}\quad ,$$
where W s is the specific wear rate in mm3/ Nm, ∆m is the mass loss before and after the test in grams, ρ is the density of high-entropy alloys in g/cm3, V s is the sliding speed in m/s, t is the wear test duration time in seconds, and f n is the normal load in newton. After the wear test, the worn surface morphology and composition of the HEA pin samples were analyzed using a scanning electron microscope (SEM) and energy-dispersive X-ray spectroscopy (EDS), respectively, to predict the wear mechanism. White light interferometer attached with a 10× objective lens was used to generate the 3D profile of the worn surfaces. The oxide and the other unknown compound formed on the worn surface during the wear process were analyzed using X-ray photoelectron spectroscopy (XPS).
Wear test parameters for Al0.4FeCrNiCox (x = 0, 0.25, 0.5, 1.0 mol) HEAs.

Results and discussion
Microstructural, phase, and thermal analysis
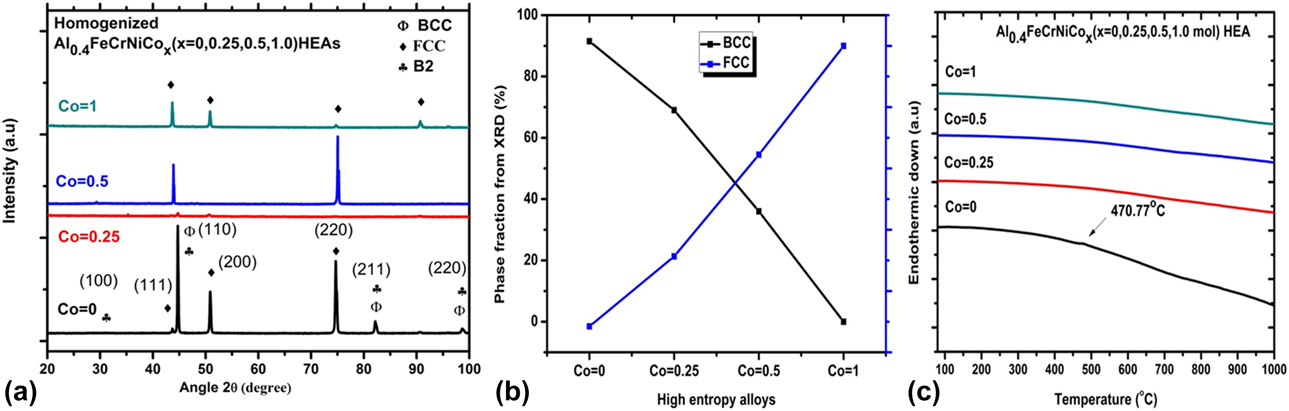
Figure 1(a) shows the X-ray diffraction pattern of homogenized Al0.4FeCrNiCox (x = 0, 0.25, 0.5, 1.0 mol) HEA samples. The graph reveals that with the addition of cobalt content from x = 0 to 0.5 mol, a mixed phase of FCC + BCC gets formed and a single-phase FCC gets formed for x = 1.0 mol [Reference Chen, Fu, Fang, Xiao and Zhu27]. It is observed that as cobalt content increases, the intensity of the BCC phase decreases and it completely disappears for x = 1.0 mol. The lattice parameter of the BCC phase increases from 2.869 to 2.891 Å and that of the FCC phase increases from 3.592 to 3.594 Å, which are in accordance with the previous study [Reference Qin, Xue, Fan, Chen, Wang, Su, Ding and Guo29, Reference Zhao, Cui, Wang, Zhao, Zhang and Wang30, Reference Kao, Chen, Chen and Yeh37]. Figure 1(b) shows the variation of phase fraction with cobalt content (as calculated from the XRD graph). The graph indicates that with the addition of cobalt content from x = 0 to 0.5 mol, the BCC phase decreases from 97 to 35% and it completely vanishes at x = 1.0 mol.
(a) X-ray diffraction pattern of homogenized Al0.4FeCrNiCox (x = 0, 0.25, 0.5, 1.0 mol) HEAs, (b) variation of phase fraction with cobalt content, and (c) DSC micrograph of homogenized Al0.4FeCrNiCox (x = 0, 0.25, 0.5, 1.0 mol) HEAs.
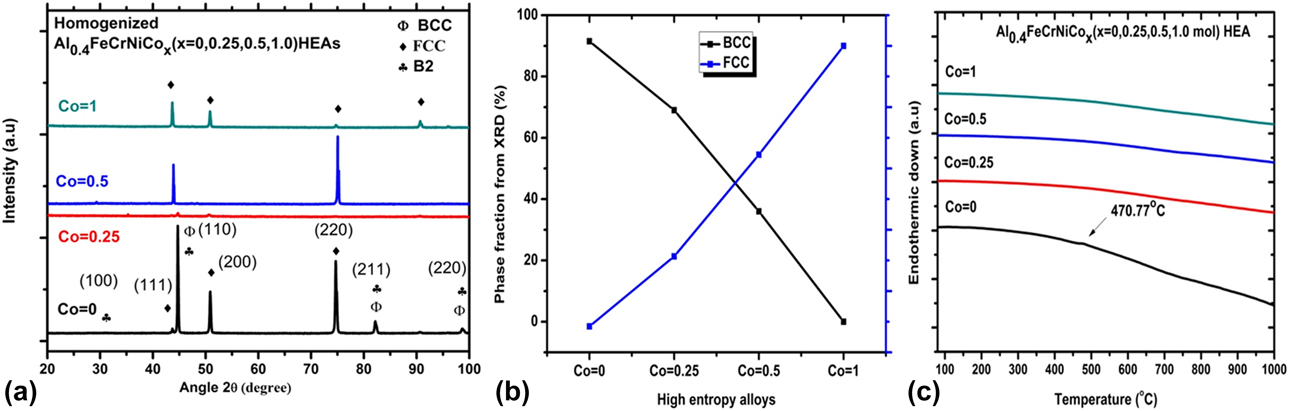
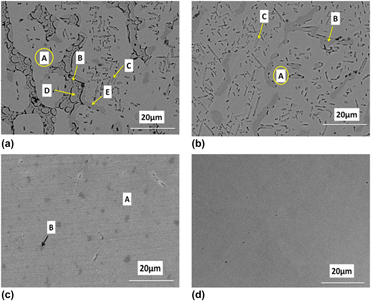
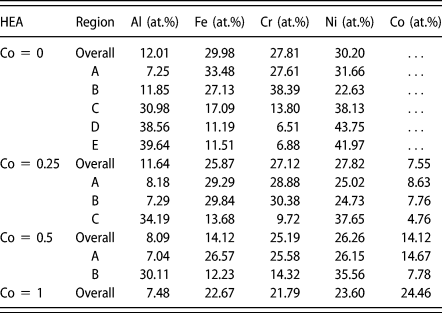
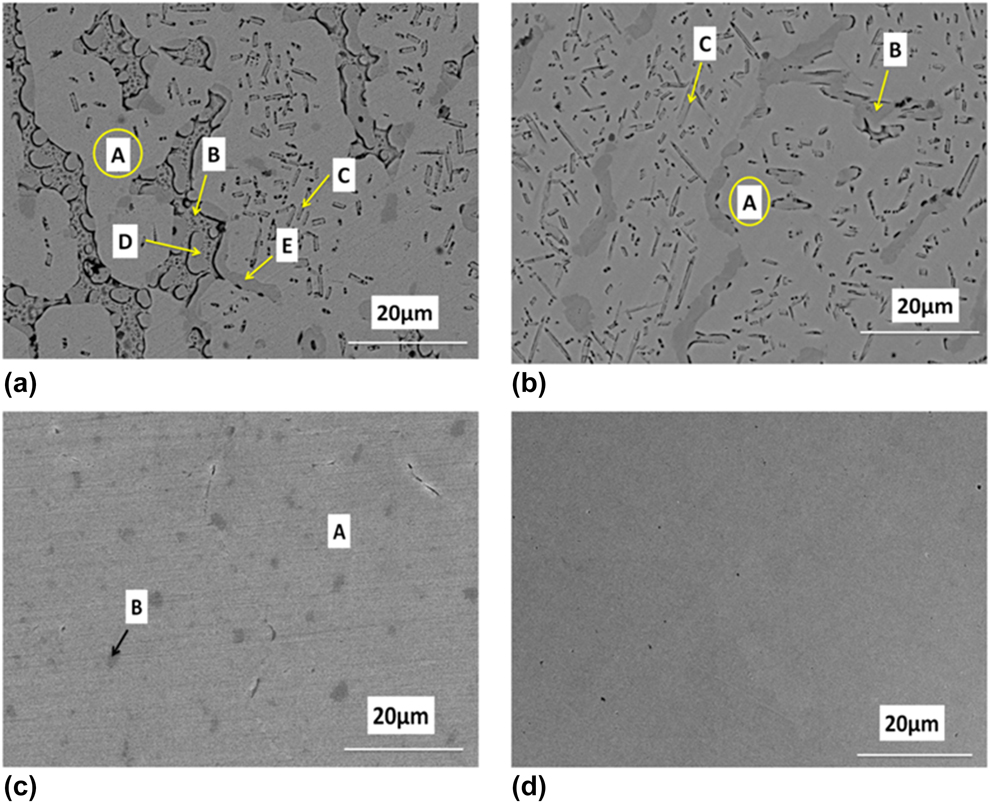
Figure 2 shows the SEM micrographs of homogenized Al0.4FeCrNiCox (x = 0, 0.25, 0.5, 1.0 mol) HEAs, representing the microstructural evolution with the addition of cobalt. The SEM micrographs indicate that for Co = 0, the HEA shows dendritic and interdendritic regions along with various precipitates as shown in Fig. 2(a). The different regions in the microstructure are denoted as A, B, C, D, and E, and their chemical compositions are listed in Table II. Region A denotes the dendritic region, region B denotes the interdendritic region, and the various precipitates are denoted as C, D, and E as reported in previous studies [Reference Lin and Tsai12, Reference Kao, Chen, Chen and Yeh37]. The EDS results as listed in Table II indicated that the dendritic region (A) is rich in Fe, Cr, and Ni and is poor in Al and that the interdendritic region (B) is rich in Fe, Cr, and Ni and also in Al. The precipitates are observed to be rich in Al and Ni and poor in Fe and Cr. To examine the distribution of elements and phases, the EDS mapping of Al0.4FeCrNiCox (x = 0, 0.25, 0.5, 1.0 mol) HEAs were analyzed. The results of Al0.4FeCrNiCox=0 confirm that the dendrite region (A) is rich in Fe and Cr and poor in Al and Ni. Interdendritic region (B) along with various precipitates are rich in Al and Ni and poor in Fe and Cr. Similar findings have also been reported by Zhao et al. [Reference Zhao, Cui, Wang, Zhao, Zhang and Wang30]. It is observed that as Co content increases, the interdendritic region (B) decreases and completely disappears at x = 1.0 mol with the formation of a homogenized region rich in Fe, Cr, Ni, and Co as listed in Table II and shown in Fig. 2(d).
SEM micrographs of homogenized (a) Co = 0, (b) Co = 0.25, (c) Co = 0.5, and (d) Co = 1 HEAs.
EDS results of homogenized Al0.4FeCrNiCox (x = 0, 0.25, 0.5, 1.0 mol) HEAs.
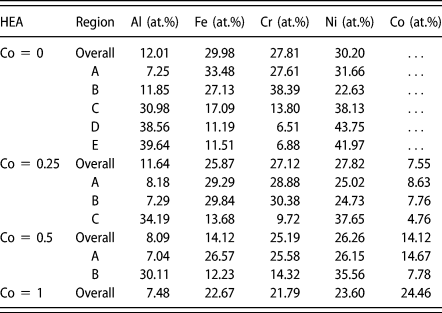
It is also observed that the interdendritic region (B) is rich in Al and Ni as indicated by the EDS results and listed in Table II. The region rich in Al and Ni has B2 phase, and it is formed because of relatively larger negative enthalpy of mixing between the Al and the Ni than the other atomic pair in the alloy system. The enthalpy of mixing of various atomic pairs according to Miedema’s approach is Al–Ni (−22 KJ/mol), Fe–Cr (−1 KJ/mol), Cr–Co (−4 KJ/mol), Cr–Ni (−7 KJ/mol), Fe–Co (−1 KJ/mol), and Fe–Ni (−2 KJ/mol). According to EDS results as listed in Table II, with the addition of cobalt, the aluminum content decreases and Fe, Cr, Ni, and Co content increases. Therefore, the chance of formation of region rich in Al and Ni is reduced in the interdendritic region (B) with the increasing content of cobalt and completely disappears at x = 1.0 mol.
It is clear that the dendrite formation takes place when a solid grows into a supercooled liquid and the heat transfer takes place through the liquid rather than the solid. The dendrite arm growth direction depends upon the direction of preferential heat transfer and the direction of low-energy atomic planes. Based on the present study, it can be concluded that the addition of cobalt not only changes the thermal conductivity of the system, but also leads to a change in low-energy atomic planes. Both of these factors is believed to change the direction, shape, and size of the dendrites and its arms, which in turn results in a change in interdendritic region.
In high-entropy alloys, the phase formation is predicted from certain thermodynamic parameters as discussed below.
The mixing enthalpy of a multicomponent alloy with n elements is calculated by Eq. (2):
 $$\Delta {H_{{\rm{mix}}}} = \sum\limits_{i = 1,i \ne j}^n {{\Omega _{ij}}{C_i}{C_j}} \quad ,$$
where  ${\Omega _{ij}} = 4\;\Delta H_{{\rm{mix}}}^{{\rm{AB}}}$ is the interaction parameter between ith and the jth elements and C i and C j are the at.% of the components. The enthalpy of mixing between atomic pairs is calculated according to the Miedema’s model [Reference Takeuchi and Inoue38].
The mixing entropy of regular solid solution is calculated by Eq. (3):
 $$\Delta {S_{{\rm{mix}}}} = - R\sum\limits_{i = 1}^n {{C_i}\ln {C_i}} \quad ,$$
where R is the gas constant and its value taken as 8.314 J/mol K and C i is the at.% of the ith component. Atomic size mismatch is calculated by Eq. (4), which relates the compressive effects between the atoms in an n-element alloy system.
 $$\delta = 100\sqrt {{{\sum\limits_{i = 1}^n {{C_i}\left( {1 - {{{r_i}} \over {\bar{r}}}} \right)} }^2}} \quad ,$$
where  $\bar{r} = \sum\limits_{i = 1}^n {{C_i}{r_i}}$ is the average atomic radius and r i the atomic radius of each of the constituting elements and is taken from the a previous study [Reference Guo and Liu39]. A thermodynamic parameter, which is obtained by Eq. (5), is used to predict the formation of the solid solution:
 $$\Omega = {{{T_{\rm{m}}}\Delta {S_{{\rm{mix}}}}} \over {I\Delta {H_{{\rm{mix}}}}I}}\quad .$$
The valence electron concentration is calculated in accordance with Eq. (6) and is used to predict the formation of FCC, BCC, and dual phase (FCC + BCC):
 $${\rm{VEC}} = \sum\limits_{i = 1}^n {{C_i}{{\left( {{\rm{VEC}}} \right)}_i}} \quad ,$$
where C i is the at.% of the ith element and VEC values are taken from a previous study [Reference Guo and Liu39]. The Pauling electronegativity is obtained using Eq. (7), which helps in understanding the phase stability, and values of individual elements are taken from a previous study [Reference Guo and Liu39]:
 $$\Delta X = \sqrt {\sum\limits_{i = 1}^N {{C_i}{{\left( {{X_i} - {X_{{\rm{avg}}}}} \right)}^2}} } \quad ,$$
where X i is the electronegativity of the ith element and  ${X_{{\rm{avg}}}} = \mathop \sum \limits_{i = 1}^N {C_i}{X_i}$. Theoretically, the melting point of multicomponent alloys is calculated by Eq. (8), and values of individual elements are taken from a previous study [Reference Guo and Liu39].
 $${T_{\rm{m}}} = \sum\limits_{i = 1}^n {{C_i}{{\left( {{T_{\rm{m}}}} \right)}_i}} \quad .$$
The calculated range of various thermodynamic parameters of Al0.4FeCrNiCox (x = 0, 0.25, 0.5, 1.0 mol) HEAs is as follows: ∆H varies from −9.4 KJ/mol to −8.2 KJ/mol, ∆S varies from 11 J/mol.K to 13 J/mol.K, δ varies from 0.047 to 0.041 Å, Ω varies from 1.77 to 2.38, VEC varies from 7.4 to 7.8, ∆X varies from 0.115 to 0.110, and T m varies from 1509.45 to 1506.16 °C. It can be observed that the calculated values of thermodynamic parameters satisfy the Zhang et al. [Reference Zhang, Lu, Ma, Liaw, Tang, Cheng and Gao24] and Guo et al. [Reference Guo and Liu39] criterion for solid solution formation: i.e., when 11 < ∆S mix < 19.5 J/(K mol), −22 < ∆H mix < 7 KJ/mol, 0 < δ < 8.5 and VEC < 6.87, only body-centered cubic (BCC) will form; when 6.87 < VEC < 8, both BCC + FCC will form; and when VEC > 8, only FCC phase will form. The thermodynamic criterion Ω indicates the dominating factor between mixing enthalpy and mixing entropy in the formation of the solid solution. If Ω > 1 then T∆S will dominate over ∆Hmix and the HEA will form a solid solution. On the other hand if Ω < 1 then ∆H mix will dominate and this will lead to the formation of intermetallic compound. Dong et al. [Reference Dong, Lu, Jiang, Wang and Li40] described the relation between Pauling electronegativity and phase stability. The topologically close-packed (TCP) phase, like, σ-phase, Laves phase, R-phase, and µ-phase are stable when ∆X > 0.133, whereas no TCP phases are formed when ∆X < 0.117 and TCP formation is inconclusive when ∆X is in the range of ∆X = 0.1176 to 0.133 [Reference Dong, Lu, Jiang, Wang and Li40].
Therefore, thermodynamic results favor the Dong et al. [Reference Dong, Lu, Jiang, Wang and Li40] conditions for non-TCP phase (no intermetallic), i.e., ∆X < 0.117. From these results, it is also observed that the Ω > 1 and that Al0.4FeCrNiCox (x = 0, 0.25, 0.5, 1.0 mol) HEAs will form a solid solution.
Figure 1(c) shows the DSC micrograph of homogenized Al0.4FeCrNiCox (x = 0, 0.25, 0.5, 1.0 mol) HEA in the temperature range from ambient to 1000 °C with a heating rate of 10 K/min. The graph indicates that the homogenized Al0.4FeCrNiCox (x = 0, 0.25, 0.5, 1.0 mol) HEA does not show any significant endothermic or exothermic peak. For Co = 0 HEA, a small exothermic peak appears at 470.77 °C, which may be due to the formation of a very small amount of FeCr-based sigma phase [Reference Baker41]. This type of transformation behavior has been observed in the case of only one sample, i.e., Co = 0 HEA. It can be concluded that the increase in the Co content in the proposed series of the HEAs may lead to the suppression of unwanted transformation, i.e., crystallization of sigma phase.
Density and microhardness
The density of homogenized Al0.4FeCrNiCox (x = 0, 0.25, 0.5, 1.0 mol) HEAs is observed to increase with the addition of cobalt from x = 0 to 1.0 mol. The experiments were performed in water as a medium. The recorded density values for Al0.4FeCrNiCox (x = 0, 0.25, 0.5, 1.0 mol) HEAs are found to be 7.224 g/cm3, 7.294 g/cm3, 7.430 g/cm3, and 7.787 g/cm3 respectively. The microhardness measurements of homogenized Al0.4FeCrNiCox (x = 0, 0.25, 0.5, 1.0 mol) HEAs were performed at a load of 200 gf and a dwell time of 15 s. The average value of ten different sites across the polished sample was recorded. It is found that with the addition of cobalt from x = 0 to 1.0 mol, the microhardness of the HEAs decreases. The microhardness values are observed to be 377.7 ± 16.57 HV, 264.3 ± 21.47 HV, 211.9 ± 11.93 HV and 199.5 ± 8.23 HV, respectively, for the HEAs with cobalt content from x = 0 to 1.0 mol. The high values of standard deviation are due to the presence of grains with precipitate in the microstructure, which has different responses against the applied load [Reference Chen, Li, Kurosu, Yamanaka, Tang and Chiba42].
The following might be the reasons for the decrease in microhardness as cobalt content increases from x = 0 to 1.0 mol. First, as the cobalt content increases in the HEAs, the amount of FCC phases increases and the amount of BCC phase decreases, and hence the hardness decreases. This has been reported by many researchers previously [Reference Qin, Xue, Fan, Chen, Wang, Su, Ding and Guo29, Reference Zhao, Cui, Wang, Zhao, Zhang and Wang30, Reference Kukshal, Patnaik and Bhat43]. Second, the chemical enthalpy of mixing of Co–Cr, Co–Fe, Co–Ni, and Co–Al are 8 kJ/mol, 13 kJ/mol, 17 kJ/mol, and −24 kJ/mol, respectively. On the other hand, the chemical enthalpy of mixing of Cr –Fe, Cr –Ni, Cr –Al, Fe –Ni, Fe –Al, and Ni –Al are 13 kJ/mol, 3 kJ/mol, −6 kJ/mol, 12 kJ/mol, −10 kJ/mol, and −30 kJ/mol, respectively. Similarly, if the chemical mixing enthalpy of all other elements will be considered, then it can be observed that the combinative force of cobalt with other elements in the alloy is weakest. Therefore, with the addition of cobalt, the combinative force decreases which in turn decreases the strength and hardness of the system [Reference Li, Li, Zhao and Jiang44]. Third, the atomic size of cobalt (1.251 Å) is lower than that of the aluminum (1.432 Å). Hence, when the aluminum atom occupies the lattice sites, the lattice distortion energy increases to a greater extent than when the cobalt atoms occupy the lattice sites. For this reason, the addition of cobalt causes solid solution strengthening to a lesser extent than the addition of aluminum, and thus the strength and hardness decrease with the addition of cobalt [Reference Li, Li, Zhao and Jiang44]. Fourth, the formation of Al–Ni type B2 phase is shown in Figs. 2(a)–2(d), which is confirmed from EDS results as listed in Table II. It is reported that these precipitates help in increasing the hardness of the high-entropy alloy [Reference Shun and Du7, Reference Kao, Chen, Chen and Yeh37]. Since the amount of aluminum in the high-entropy alloy decreases with the addition of cobalt from x = 0 to 1.0 mol, it reduces the probability of formation of the Al–Ni precipitates and hence the hardness decreases.
Mechanical testing
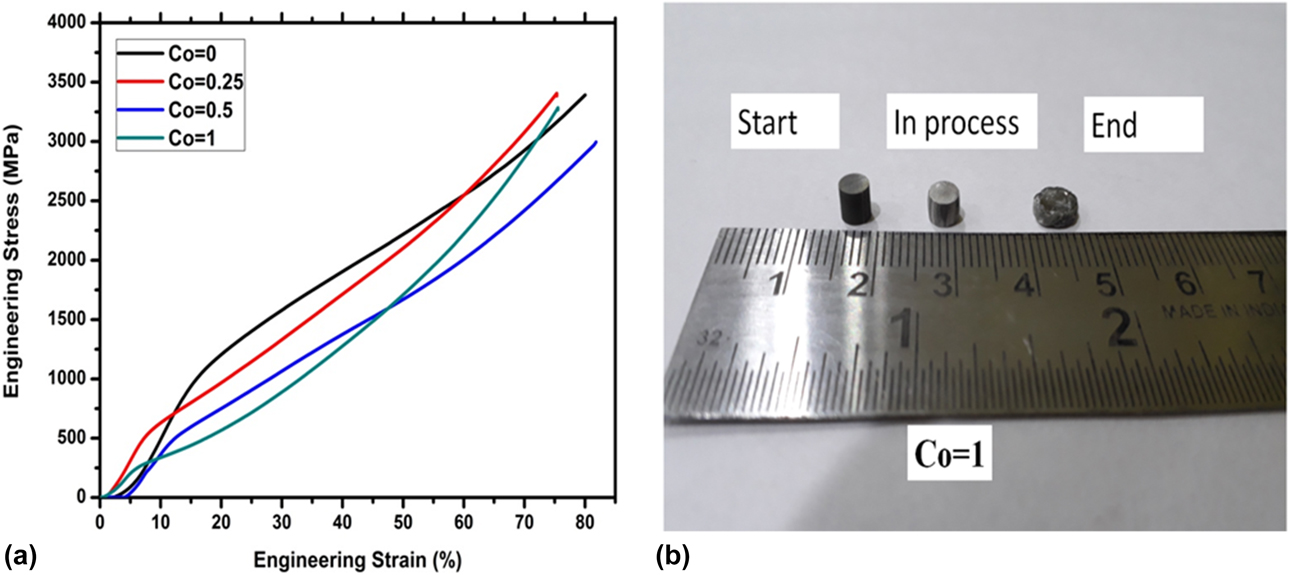
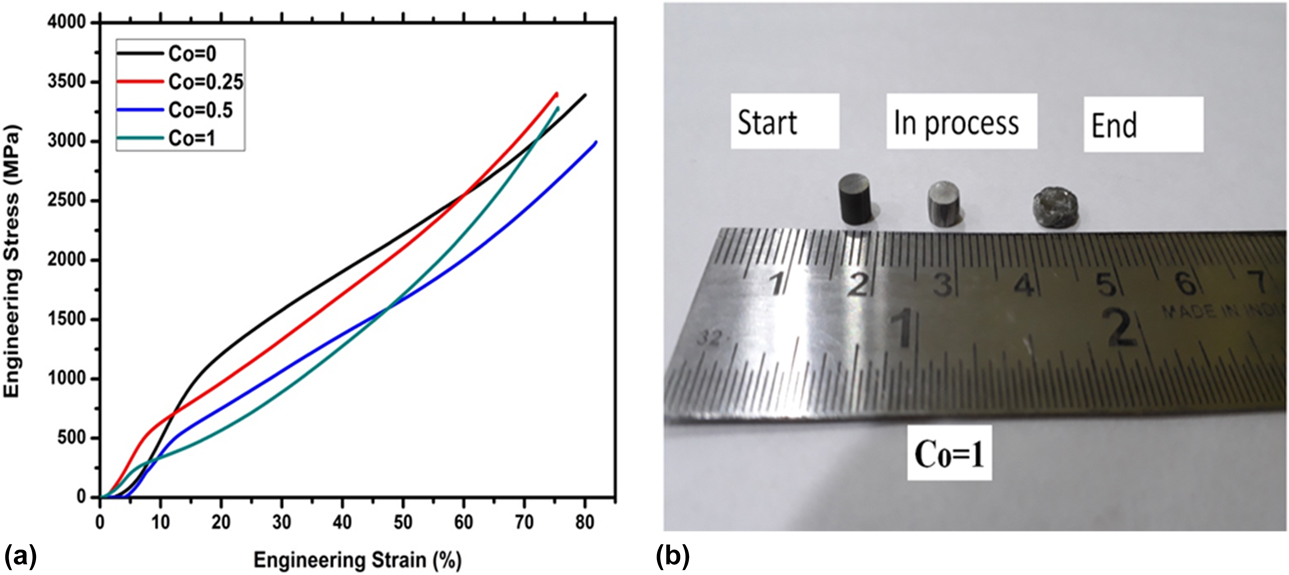
Figure 3(a) shows the engineering stress–strain curve under compression at room temperature, and Fig. 3(b) represents the image of the sample before and after the experiment. From Fig. 3(a), it is observed that the compressive yield strength of homogenized Al0.4FeCrNiCox (x = 0, 0.25, 0.5, 1.0 mol) HEAs decreases from 1169.35 to 257.63 MPa with the addition of cobalt content from x = 0 to 1.0 mol. The decrease in compressive yield strength is due to the increase in FCC phase with the addition of cobalt as shown in Fig. 1(b). It can be noted that the BCC phase is stronger than the FCC phase because the slip along the closest packed plane in BCC structure {110} is more difficult than slip along the closest packed plane in FCC structure {111} [Reference Chen, Lin, Yeh, Chen, Huang and Chuang33]. A plastic deformation of 75% is achieved in the case of Al0.4FeCrNiCox=1 HEA without failure of the sample as shown in Fig. 3(a). The compressive yield strength of Co = 1 HEA is observed to be 257.63 MPa, and similar results were also reported by Joseph et al. [Reference Joseph, Jarvis, Wu, Stanford, Hodgson and Fabijanic45].
(a) Engineering stress–strain curve of Al0.4FeCrNiCox (x = 0, 0.25, 0.5, 1.0 mol) HEAs under compression at room temperature and (b) image of Co = 1 HEA sample during the compression test.
Wear testing
Effect of sliding speed
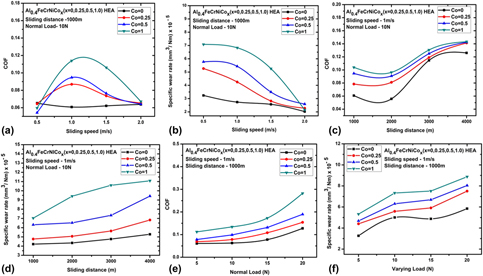
Figures 4(a) and 4(b) show the variation of COF and specific wear rate of Al0.4FeCrNiCox (x = 0, 0.25, 0.5, 1.0 mol) HEAs with a varying sliding speed tested for a constant sliding distance of 1000 m under a normal load of 10 N and under oil lubrication conditions. From Fig. 4(a), it is observed that COF fluctuates between 0.065 and 0.060 in the case of Co = 0 HEA. The initial decrease in COF in the case of Co = 0 HEA is due to the formation of the oil film between the contacting surfaces, which keeps the two contacting surfaces separated against the normal load. In the case of Co = 0.25 HEA, the COF increases rapidly from 0.064 to 0.086 as sliding speed increases from 0.5 to 1 m/s, and then it decreases gradually from 0.086 to 0.068 with an increase in sliding speed from 1 to 2 m/s. The gradual decrease in COF values from 0.086 to 0.068 is due to the formation of a continuous oil film at a higher speed which reduces the chance of metal-to-metal contacts. In the case of Co = 0.5 and Co = 1 HEA, COF initially increases from 0.054 to 0.094 and from 0.059 to 0.113 as sliding speed increases from 0.5 m/s to 1 m/s, respectively. The reason for the increase in COF is the breakage of the oil film at the interface, which is due to the entrapment of wear debris. It is observed that on further increasing the sliding speed from 1 m/s to 2 m/s, the COF value decreases from 0.094 to 0.064 and from 0.113 to 0.067 in the case of Co = 0.5 and Co = 1 HEAs, respectively. This is because, at higher sliding speeds, under boundary lubrication conditions, the tribo film is more effective than at lower speeds.
Variation of COF and specific wear rate of Al0.4FeCrNiCox (x = 0, 0.25, 0.5, 1.0 mol) HEAs under oil lubrication with varying sliding speeds (a and b), sliding distance (c and d), and normal load (e and f).
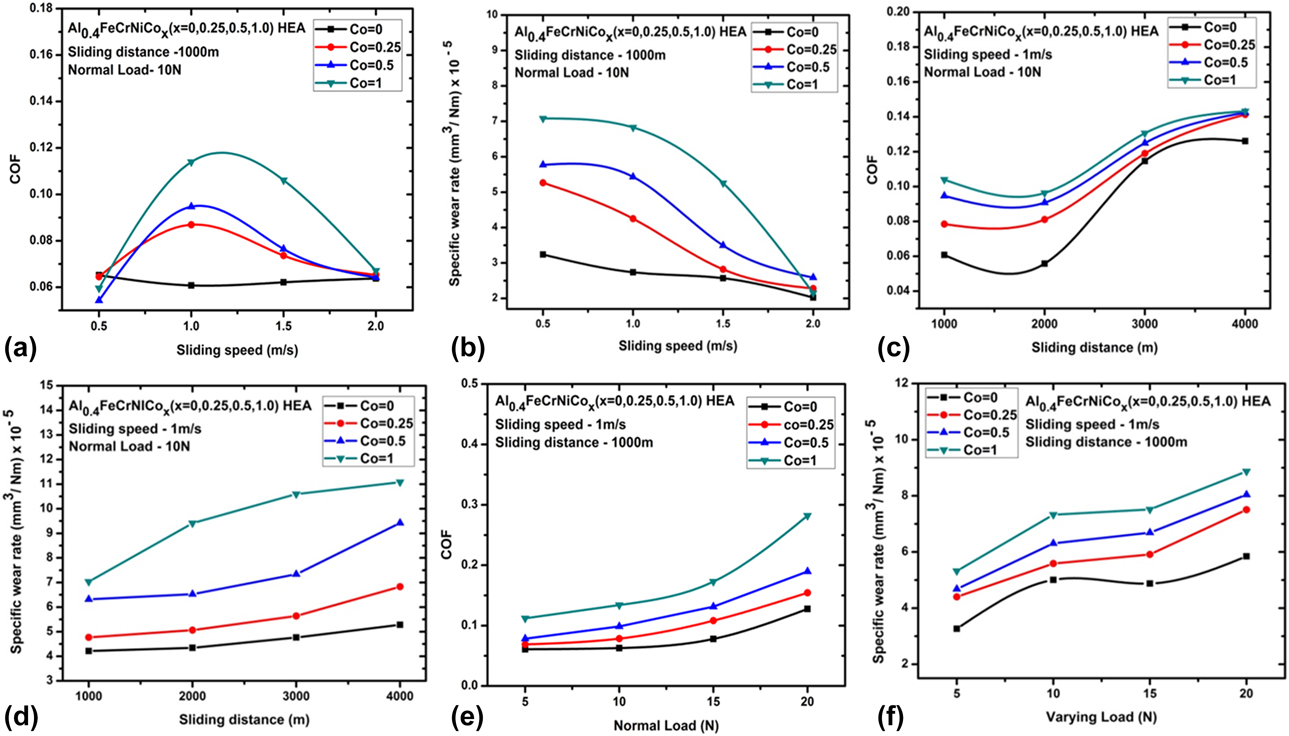
Figure 4(b) represents the variation of the specific wear rate of Al0.4FeCrNiCox (x = 0, 0.25, 0.5, 1.0 mol) HEAs with varying sliding speeds and at the constant wear conditions of 1000 m sliding distance and 10 N normal load. It is seen that as sliding speed increases from 0.5 to 2 m/s, the specific wear rate of all HEA samples decreases. The higher specific wear rate at a lower sliding speed is because of the fact that at lower sliding speeds, the lubricating oil film is not adequate and there is more metal-to-metal contact. The specific wear rate decreases from 3.240 × 10⁻⁵ to 2.023 × 10⁻⁵ mm3/N m in the case of Co = 0 HEA, i.e., a 37.56% decrease in specific wear rate with an increase in sliding speed from 0.5 to 2 m/s. In the case of Co = 0.25 HEA, the specific wear rate decreases from 4.833 × 10⁻⁵ to 2.279 × 10⁻⁵ mm3/N m, i.e., a 52.84% decrease in specific wear rate with an increase in sliding speed from 0.5 to 2 m/s. In the case of Co = 0.5 HEA, the specific wear rate decreases from 5.770 × 10⁻⁵ to 2.588 × 10⁻⁵ mm3/N m, i.e., a 55.14% decrease in specific wear rate with an increase in sliding speed from 0.5 to 2 m/s. In the case of Co = 1 HEA, the specific wear rate decreases from 7.080 × 10⁻⁵ to 2.149 × 10⁻⁵ mm3/N m, i.e., a 69.64% decrease in specific wear rate with an increase in sliding speed from 0.5 to 2 m/s.
Effect of sliding distance
Figures 4(c) and 4(d) show the variation of COF and specific wear rate of Al0.4FeCrNiCox (x = 0, 0.25, 0.5, 1.0 mol) HEAs with varying sliding distances tested under the constant sliding speed of 1 m/s and a normal load of 10 N and under oil lubrication conditions. It is observed that as sliding distance varies from 1000 to 4000 m, the COF varies in the range of 0.060–0.143 and follows similar trends for all HEAs. According to Fig. 4(c), Co = 1 HEA has the maximum COF value in each case, and this is due to a lower hardness value of Co = 1 HEA among all HEA samples. For Co = 1 HEA, COF initially decreases from 0.10 to 0.096 as sliding distance increases from 1000 to 2000 m. The decrease in the COF value is due to the removal of frictional heat and debris by lubricating oil, which smoothens the wear process. Afterward, between 2000 and 4000 m, the COF starts increasing from 0.096 to 0.143 in the case of Co = 1 HEA. The increase in COF after 2000 m is due to the presence of debris in oil between the disk and sample. This results in the breakage of lubricating oil film and increases the metal-to-metal contacts between the surfaces, and therefore COF increases.
Figure 4(d) shows the variation of specific wear rate of Al0.4FeCrNiCox (x = 0, 0.25, 0.5, 1.0 mol) HEAs with varying sliding distances under oil lubrication. It is observed that as sliding distance increases from 1000 to 4000 m, the specific wear rate increases. For Co = 0 HEA, the specific wear rate increases from 4.215 × 10⁻⁵ to 5.280 × 10⁻⁵ mm3/N m, i.e., a 25.2% increase in value when the sliding distance increases from 1000 to 4000 m. For Co = 0.25 HEA, the specific wear rate increases from 4.766 × 10⁻⁵ to 6.830 × 10⁻⁵ mm3/N m, i.e., a 30.2% increase in value when the sliding distance increases from 1000 to 4000 m. For Co = 0.5 HEA, the specific wear rate increases from 6.315 × 10⁻⁵ mm3/N m to 9.423 × 10⁻⁵ mm3/N m, i.e., a 32.9% increase in value, and in the case of Co = 1 HEA, the specific wear rate increases from 7.032 × 10⁻⁵ mm3/N m to 11.080 × 10⁻⁵ mm3/N m, i.e., a 36.5% increase in value when sliding distance increases from 1000 m to 4000 m, respectively. The maximum value of the specific wear rate in the case of Co = 1 HEA among all samples is due to its lower value of hardness.
Effect of normal loads
Figures 4(e) and 4(f) show the variation of COF and specific wear rate of Al0.4FeCrNiCox (x = 0, 0.25, 0.5, 1.0 mol) HEAs with varying normal loads tested for a constant sliding distance of 1000 m and at a sliding speed of 1 m/s under oil lubrication, respectively. It is observed from Fig. 4(e) that as normal load increases from 5 N to 20 N, the COF also increases in the case of all Al0.4FeCrNiCox (x = 0, 0.25, 0.5, 1.0 mol) HEAs, respectively. The increase in COF with the increase in load is mainly due to an increase in contact area between the rotating disk and the HEA pin samples, which requires more energy to break the contact, and hence the COF value increases.
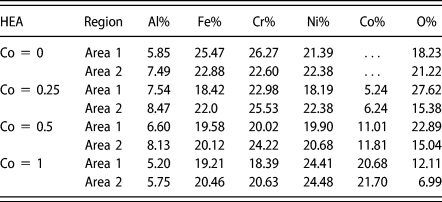
Figure 4(f) shows the variation of specific wear rate with normal loads, and it is observed that as normal load increases, the specific wear rate also increases in three different regimes in the case of Al0.4FeCrNiCox (x = 0, 0.25, 0.5, 1.0 mol) HEAs. In the first regime, as load increases from 5 to 10 N, the specific wear rate increases rapidly in the case of all HEAs, and it is noted that the Co = 1 HEA exhibits the maximum specific wear rate among all HEAs. In the second regime, as the load increases from 10 to 15 N, the specific wear rate varies gradually in the case of all HEAs. In the third regime, as the load increases from 15 to 20 N, the specific wear rate again increases in the case of all HEAs. The reason for these particular regimes with the increase in loads is mainly the variation in real contact area between the contacting surfaces. As the load increases, more metal-to-metal contact occurs, and this leads to more material loss. As a result, the specific wear rate for Co = 0 HEA increases from 3.262 × 10⁻⁵ to 5.843 × 10⁻⁵ mm3/N m, i.e., a 79.12% increase in value when normal load increases from 5 to 20 N. For Co = 0.25 HEA, the specific wear rate increases from 3.572 × 10⁻⁵ to 7.505 × 10⁻⁵ mm3/N m, i.e., a 110.10% increase in value as the normal load increases from 5 to 20 N. Similarly, in the case of Co = 0.5 HEA, the specific wear rate increases from 3.768 × 10⁻⁵ to 8.040 × 10⁻⁵ mm3/N m, i.e., a 113.37% increase in value, and in the case of Co = 1 HEA, the specific wear rate increases from 4.124 × 10⁻⁵ to 8.871 × 10⁻⁵ mm3/N m, i.e., a 115.10% increase in value when normal load increases from 5 to 20 N. The reasons for the 115.10% increase in the value of specific wear rate in the case of Co = 1 HEA are as follows: first, due to the lower value of microhardness as discussed in section “Density and microhardness” and second, due to the lower value of oxygen content on the worn surface in the case of Co = 1 HEA as listed in Table III, which indicates a lesser protective tribo film in comparison with other high-entropy alloy specimens during wear process and hence lesser protectiveness in the case of Co = 1 HEA, and leading to a higher material loss.
EDS results of worn surface of Al0.4FeCrNiCox (x = 0, 0.25, 0.5, 1.0 mol) HEAs at (1000 m, 10 N, 1 m/s) wear conditions under oil lubrication.

Wear mechanism and wear model
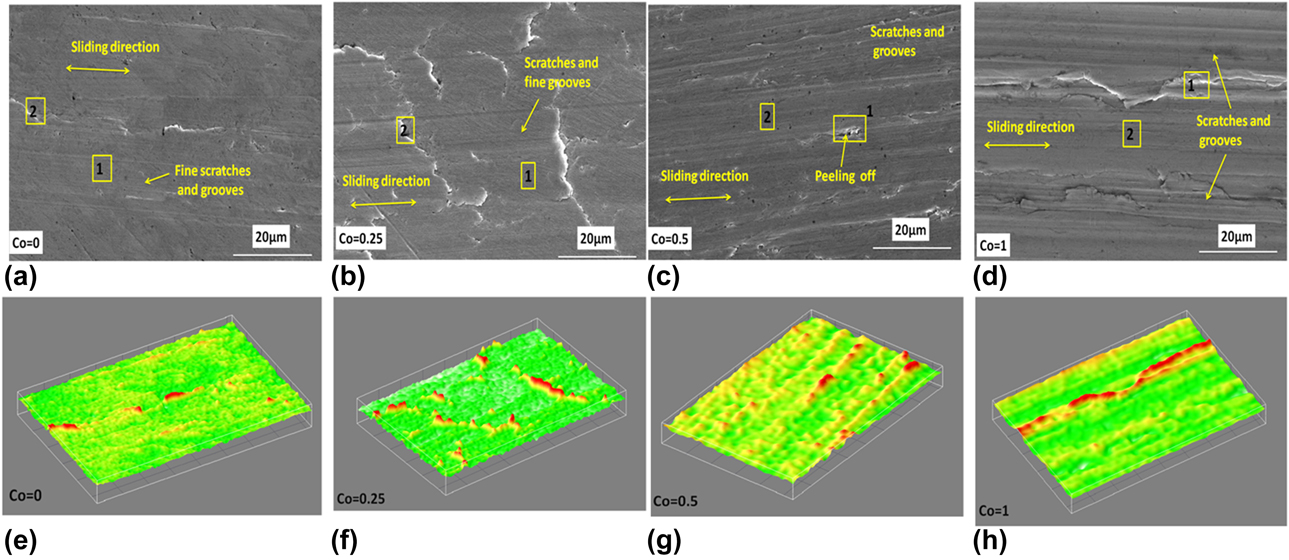
Figures 5(a)–5(d) show the SEM micrographs of worn surfaces of Al0.4FeCrNiCox (x = 0, 0.25, 0.5, 1.0 mol) HEAs, after the wear test at the high magnification, with constant wear conditions (1000 m, 10 N, 1 m/s) under oil lubrication. The corresponding EDS results of a selected area of Al0.4FeCrNiCox (x = 0, 0.25, 0.5, 1.0 mol) HEAs are listed in Table III. The micrograph was obtained after degreasing the oiled surface in the acetone bath. Figures 5(a)–5(d) illustrate the surface characteristic generated while sliding the HEA pin samples against the rotating disk under lubrication. The worn surface looks very smooth, indicating polishing of the worn surface. Figure 5(a) indicates the SEM micrograph of Co = 0 HEA and shows fine scratches and grooves which are parallel to the sliding direction. It is also noted that the worn surface does not have any cracks, spalling, or damage surface. The specific wear rate of Co = 0 HEA is minimum and that of Co = 1 HEA is maximum among all HEAs as illustrated in Fig. 4(b), Figs. 4(d) and 4(f), and this may be due to the following reasons. First, the minimum specific wear rate of Co = 0 HEA is due to the formation of a stable or unbroken oil film which minimizes the heating and washes away the debris generated during the wear process, resulting in lower material loss. On the other hand, the maximum specific wear rate exhibited by Co = 1 HEA is due to the breakdown of the oil film. The unstable oil films or breakage of oil films is due to the presence of loose wear debris between the contacting surfaces, which leads to scratches, grooves, and plastic deformation of the material as shown in Fig. 5(d). The generated grooves or unsmooth surface provides a side passage for the lubricant to flow out. The side leakage causes reduction in or complete collapse of the oil film, breakdown of the oil film, or generation of an unstable oil film [Reference Sperka, Krupka and Hartl46, Reference Wang and Lin47]. So more metal-to-metal contacts occur, and this increases the material loss. The second reason is the higher hardness of Co = 0 HEA among all HEA samples as discussed in section “Density and microhardness.” According to Archard’s wear equation, hardness is inversely proportional to material loss [Reference Hutchings48]. Therefore, Co = 0 HEA has the highest hardness among all HEA samples. This means that higher the hardness, the lower the material loss. The third reason might be the presence of oxygen on the worn surface of Co = 0 HEA as listed in Table III. It is observed that the oxygen content decreases from 19.72 to 9.55 at.% (average value of area 1 and area 2) with the addition of cobalt from x = 0 to 1.0 mol. It is known that the presence of oxygen on the worn surface forms a protective tribo layer and helps in reducing the material loss [Reference Conceicao and D’Oliveira49]. It is also noted that by the addition of cobalt, microstructural differences arise within the HEAs as shown in Figs. 2(a)–2(d). As the cobalt content increases, the amount of precipitate is observed to decrease in the microstructure [Figs. 2(a)–2(d)]. The EDS results as listed in Table II indicate that these precipitates are rich in aluminum and nickel. It is reported that these precipitates help in increasing the hardness of the alloy and hence decrease the material loss during wear. Therefore, with increasing cobalt content, the precipitate decreases, thus decreasing the hardness as a result increasing the wear [Reference Shun and Du7, Reference Kao, Chen, Chen and Yeh37].
(a–d) SEM micrographs and (e–h) 3D surface profile of worn surface of Al0.4FeCrNiCox (x = 0, 0.25, 0.5, 1.0 mol) HEAs at constant wear conditions (1000 m, 10 N, 1 m/s) under oil lubrication.
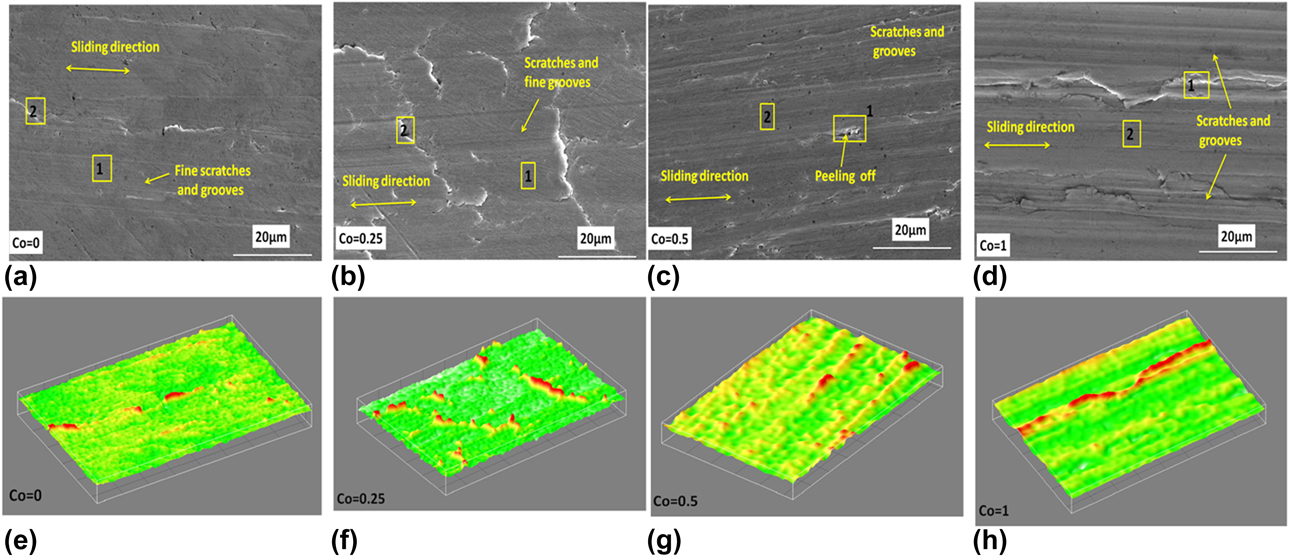
Figures 5(b)–5(d) show the SEM micrographs of the worn surface of Co = 0.25, Co = 0.5, and Co = 1 HEAs, respectively. The micrographs illustrate the similar features as in the case of Co = 0 HEA, but show deep scratches and grooves which are parallel to the sliding direction. The micrographs also reveal that there are some regions where peeling off, flow of material, and formation of cracks occur in a direction perpendicular to the sliding direction. Similar features are also observed in Figs. 5(e)–5(h) which show the 3D profile of the worn surface of Al0.4FeCrNiCox (x = 0, 0.25, 0.5, 1.0 mol) HEAs after the wear. The 3D profile also confirms that the scratches and grooves along with the material flow are parallel to the sliding direction during the wear process.
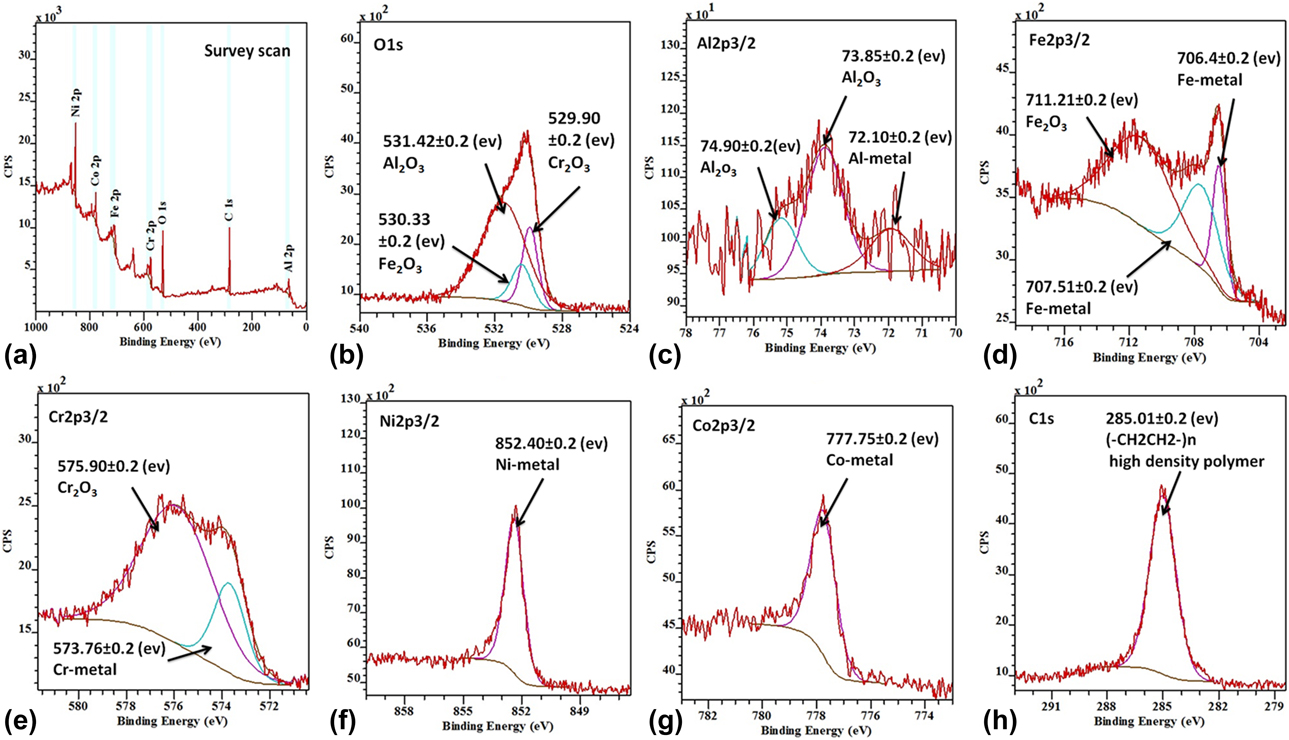
The deep scratches and grooves in the case of Co = 1 HEA are because of two reasons. First, as cobalt content increases, the hardness of HEA samples decreases, and the second reason is the breakdown of the oil film. It occurs when the wear debris gets stuck between the contacting surfaces and creates deep scratches as indicated in Figs. 5(c) and 5(d) and Figs. 5(g) and 5(h). It is observed from Table III that as cobalt content increases from x = 0 to 1 mol, the oxygen content decreases. Therefore, the protective nature of the tribo film is lower in the case of Co = 1 HEA than in the case of Co = 0 HEA. The XPS spectra confirm that the oxide formed in Co = 1 HEA is mainly consisted of Al2O3, Fe2O3, and Cr2O3, as shown in Fig. 7. Hence it may be concluded that the mode of wear is the combined effect of adhesive and abrasive wear along with the third body wear, and plastic flow of material.
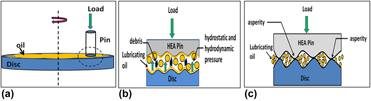
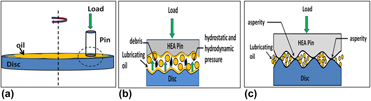
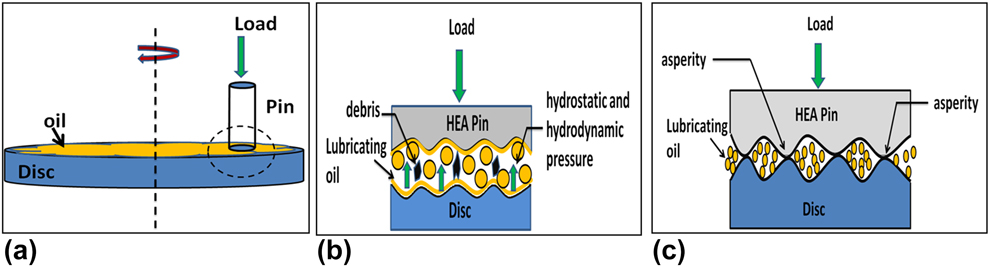
Figures 6(a)–6(c) illustrate the general wear model for HEA pin samples sliding against the EN-31 disk. Here we consider the case when the normal load varies from 5 to 20 N. At lower loads, the COF has shown lower values as shown in Fig. 4(e). It means that the lubricating oil film that develops between the contacting surfaces as shown in Fig. 6(b) has been sufficient to avoid metal-to-metal contact by the development of hydrostatic and hydrodynamic pressure against the normal load [Reference Mitrovic, Adamovic, Zivic, Dzunic and Pantic50]. The oil film also takes away the debris and the heat generated during the wear process, resulting in a lower value of COF. With the increase in normal loads, the COF increases as shown in Fig. 4(e); this is because at higher loads, a large area of contacting surfaces is in contact, which in turn increases the asperity-to-asperity contacts which cannot be resisted by the oil film and require more energy to break. Therefore, a higher value of the COF is obtained at higher applied normal loads.
Wear model for HEA pin sliding against EN-31 disk under oil lubrication: (a) pin-on-disk setup, (b) lubricating oil film sufficient to avoid metal-to-metal contact, and (c) asperity-to-asperity contact between HEA pin and EN-31 disk.
X-ray photoelectron spectroscopy of Al0.4FeCrNiCox=1 HEA
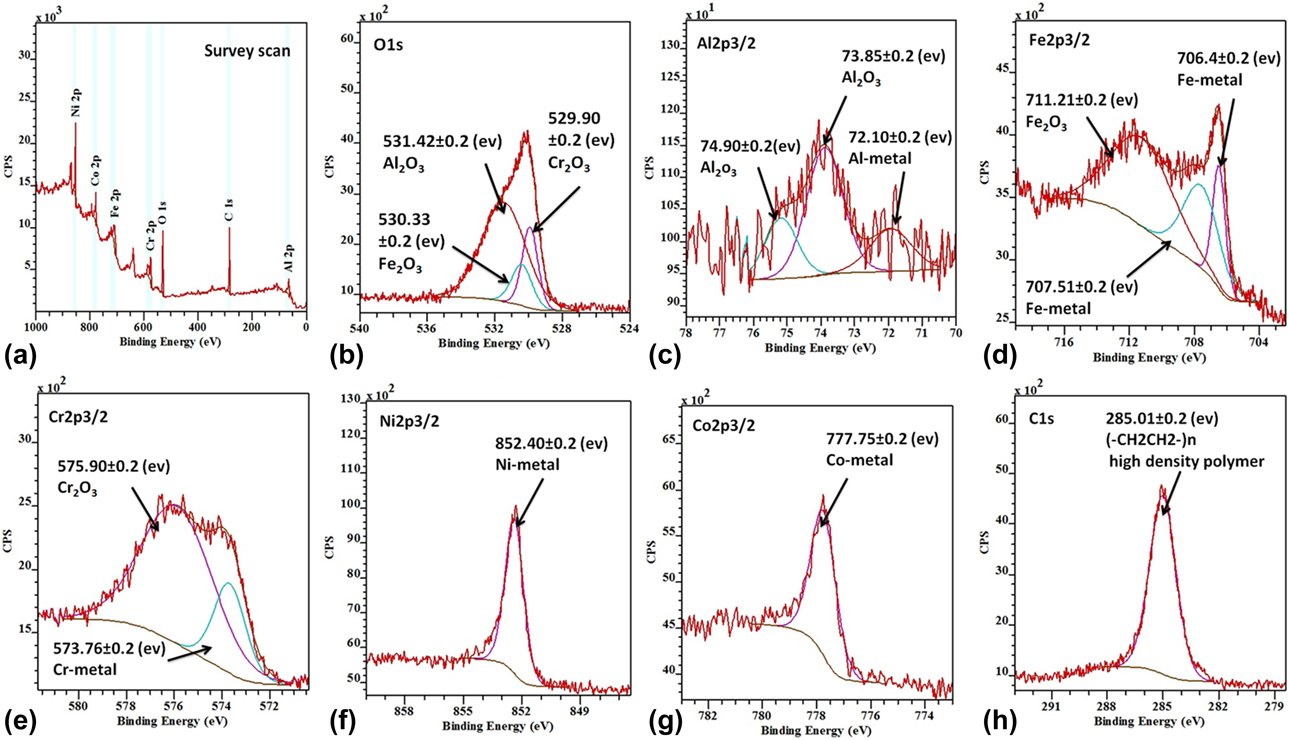
Figures 7(a)–7(h) show the XPS spectra of the worn surface of Al0.4FeCrNiCox=1 HEA, after the wear test at the constant sliding conditions (1000 m, 10 N, 1 m/s) under oil lubrication. Before the examination, the sample was properly cleaned and degreased with acetone by ultrasonicating for 10–15 min and then dried. The XPS spectra were recorded after argon ion etching the surface with few atomic layers. Figure 7(a) shows the XPS survey spectra in the binding energy range from 0 to 1000 eV, which includes the entire elements present in the Al0.4FeCrNiCox=1 HEA along with carbon and oxygen. Figures 7(b)–7(h) illustrate the deconvoluted XPS spectra of O 1s, Al 2p, Fe 2p, Cr 2p, Ni 2p, Co 2p, and C 1s, respectively. The deconvoluted XPS spectra of O 1s in Fig. 7(b) indicate the presence Cr2O3, Fe2O3, and Al2O3 at the binding energy of 529.90 ± 0.2, 530.33 ± 0.2, and 531.42 ± 0.2 eV, respectively. Figure 7(c) shows the XPS spectra of Al 2p 3/2; the deconvoluted peak at the binding energy of 72.10 ± 0.2 eV represents the presence of pure Al metal, and the peaks at 73.85 ± 0.2 and 74.90 ± 0.2 eV represent Al2O3. Figure 7(d) indicates the deconvoluted peak of Fe 2p 3/2; the peaks at the binding energies of 706.40 ± 0.2 and 707.51 ± 0.2 eV represent the presence of pure Fe metal, and the peak at 711.21 ± 0.2 eV represents Fe2O3. Figure 7(e) shows the XPS spectra of Cr 2p 3/2, and the deconvoluted peaks at the binding energies of 573.76 ± 0.2 eV, and 575.90 ± 0.2 eV indicate the presence of pure Cr metal and Cr2O3, respectively. Figures 7(f) and 7(g) represent the XPS spectra of Ni 2p 3/2 and Co 2p 3/2, respectively, and the peaks at the binding energies of 852.40 ± 0.2 eV and 777.75 ± 0.2 eV represent the presence of pure Ni and Co metal. Figure 7(h) shows the XPS spectra of C 1s at 285.01 ± 0.2 eV representing the presence of a high molecular weight polymer like (–CH2CH2–)n. Its presence might be due to the contamination during ultrasonication of the HEA sample with acetone [Reference Murakami, Mano, Hibi and Sasaki51] or due to the formation of alcoholic or ketone group [52, Reference Bhushan53] by the thermal reaction of hydrocarbons present in the lubricating oil, which takes place in four steps as follows. Similar findings have also been reported by Bhushan et al. [Reference Bhushan53, Reference Mannekote and Kailas54].
X-ray photoelectron spectra of the worn surface of Al0.4FeCrNiCox = 1 HEA: (a) survey scan, (b) O 1s spectra, (c) Al 2p spectra, (d) Fe 2p spectra, (e) Cr 2p spectra, (f) Ni 2p spectra, (g) Co 2p spectra, and (h) C 1s spectra.
Step 1: Initiation
 $${\rm{RH}} \to {{\rm{R}}^ \bullet } + {\rm{H}}\quad .$$
Step 2: Propagation
 $${{\rm{R}}^ \bullet } + {{\rm{O}}_2} \to {\rm{RO}}{{\rm{O}}^ \bullet }\quad ,$$
 $${\rm{RO}}{{\rm{O}}^ \bullet } + {\rm{RH}} \to {\rm{ROOH}} + {{\rm{R}}^ \bullet }\quad .$$
Step 3: Branching
 $${\rm{ROOH}} \to {\rm{R}}{{\rm{O}}^ \bullet } + {\rm{H}}{{\rm{O}}^ \bullet }\quad ,$$
 $${\rm{R}}{{\rm{O}}^ \bullet } + {\rm{RH}} \to {\rm{ROH}} + {{\rm{R}}^ \bullet }\quad ,$$
 $${\rm{H}}{{\rm{O}}^ \bullet } + {\rm{RH}} \to {{\rm{H}}_2}{\rm{O}} + {{\rm{R}}^ \bullet }\quad .$$
Step 4: Termination
 $$\left. {\matrix{ \hfill {{{\rm{R}}^ \bullet } + {{\rm{R}}^ \bullet }} \cr \hfill {{{\rm{R}}^ \bullet } + {\rm{RO}}{{\rm{O}}^ \bullet }} \cr \hfill {{\rm{RO}}{{\rm{O}}^ \bullet } + {\rm{RO}}{{\rm{O}}^ \bullet }} \cr \hfill {{\rm{R}}{{\rm{O}}^ \bullet } + {{\rm{R}}^ \bullet }} \cr} } \right\} \Rightarrow \left\{ {\matrix{ {{\rm{alcohols}}} \hfill \cr {{\rm{aldehydes}}} \hfill \cr {{\rm{ketones}}} \hfill \cr {{\rm{acids}}} \hfill \cr} } \right.\quad .$$
Therefore, during the wear process under oil lubricating conditions, Al2O3, Fe2O3, and Cr2O3 form on the worn surface of Al0.4FeCrNiCox=1 HEA. This is because according to the Ellingham diagram, the Gibbs free energy change for oxidation reaction show increasing trends Al2O3 < Cr2O3 < Fe2O3 < NiO < CoO. Therefore, Al2O3, Cr2O3, and Fe2O3 have most negative values and have tendencies to form oxides even at room temperature. These oxides may decrease the material loss by providing a protective film or increase the material loss depending upon the sliding speed, normal load, environment, and film thickness [Reference Nascimento, Amaral and D’Oliveira55]. Also, there is the presence of a high molecular weight polymer or alcoholic group which may arise due to thermal reaction with hydrocarbons present in the lubricating oil or due to contamination during ultrasonication of high-entropy samples in the acetone bath after the wear test.
Conclusions
From the above experimental results, the following conclusions can be drawn.
(1) The homogenized Al0.4FeCrNiCox (x = 0, 0.25, 0.5, 1.0 mol) HEAs form a mixed phase of FCC + BCC for x = 0–0.5 mol, and a single solid solution of FCC phase was formed for x = 1.0 mol.
(2) The density of Al0.4FeCrNiCox (x = 0, 0.25, 0.5, 1.0 mol) HEAs is observed to increase from 7.224 to 7.787 g/cm3 and the microhardness is observed to decrease from 377.7 to 199.5 HV by the addition of cobalt content from x = 0 to 1 mol. The corresponding compressive yield strength of Al0.4FeCrNiCox (x = 0, 0.25, 0.5, 1.0 mol) HEAs is observed to decrease from 1169.35 to 257.63 MPa. Plastic deformation of 75% is observed in case of Al0.4FeCrNiCox=1 HEA.
(3) Al0.4FeCrNiCox = 1 HEA exhibits the maximum specific wear rate among all HEA samples, and normal loading is found to be the most influencing parameter affecting the specific wear rate. The mode of wear is observed to be the combined effect of adhesive, abrasive wear along with plastic flow of material.
(4) The XPS spectra indicate the presence of Al2O3, Fe2O3, and Cr2O3 formed on the worn surface of Al0.4FeCrNiCox = 1 HEA along with the presence of a high molecular weight polymer or alcoholic group.
Experimental procedure
The bulk ingots of Al0.4FeCrNiCox (x = 0, 0.25, 0.5, 1.0 mol) HEAs were synthesized by arc melting method under a protecting atmosphere of argon. The bulk ingot samples were flipped and remelted several times to achieve the better chemical homogeneity. Then, the samples were homogenized at 1100 °C for 24 h [Reference Ma, Wang, Nie, Wang, Xue, Zhou, Cao, Wang and Ren56] and then furnace-cooled. The phase analysis of the HEA samples was carried out using an X-ray diffractometer (Panalytical, X’pert Pro) fitted with a Cu target (Cu Kα, λ = 0.1540598 nm). The step size used was 0.04. The microstructure and the chemical composition of the HEA samples were observed using field emission scanning electron microscope (FE-SEM, Nova Nano 450 SEM, FEI) and EDS, respectively. For microhardness measurement, the HEA samples were prepared according to ASTM E3-11 standards [57] and then tested in a microhardness tester (VMHT, Walter-Uhl) by applying a load of 200 gf for a dwell time of 15 s. The compressive yield strength of the samples was measured in an (Instron 8862) testing facility at room temperature. The sample dimension and the loading rate for the test were (Ø 4 mm × 4 mm) and 0.5 mm/min, respectively. The density of the HEA samples was measured by Archimedes principle using water as the medium in a density-measuring apparatus (Mettler Toledo). A differential scanning calorimeter (Netzsch, DSC 404 F3) was used to determine the thermal stability of HEA samples in the temperature range of ambient to 1000 °C and with a heating rate of 10 K/min. For ease of representation, Al0.4FeCrNiCox=0, Al0.4FeCrNiCox=0.25, Al0.4FeCrNiCox=0.5, and Al0.4FeCrNiCox=1 HEAs were denoted as Co = 0, Co = 0.25, Co = 0.5, and Co = 1 HEAs in the text, respectively.
Supplementary material
To view supplementary material for this article, please visit https://doi.org/10.1557/jmr.2018.499.
Acknowledgments
Authors are thankful to the institute grants for financial support, Advanced Tribology Research Lab for tribology test, and Department of Mechanical Engineering MNIT Jaipur, Material Research Centre, MNIT Jaipur, for carrying out the experimental work. VK also thanks BRNS Project No. 34/20/01/2014-BRNS-0339, Mumbai (India), for financial assistance.