Implications
Bioimpedance is an objective, low-cost, easy and minimally invasive method for estimating lamb carcass characteristics in vivo. During the evaluation of carcass characteristics, the method is quick, cost effective and allows for a continuous evaluation of the body composition changes during the animal growth period. As a result, it serves as an important strategic managerial tool which gives a more precise estimation of an optimal economic carcass weight without having to slaughter the animals.
Introduction
The recent increased competitiveness of the sheep meat in international markets is due to product quality improvements, especially, regarding the carcass tissue composition (Lambe et al., Reference Lambe, Navajas, Schofield, Fisher, Simm, Roehe and Bünger2008). The proportions of muscle and fat in lamb carcass determine its yield and, consequently, its commercial value (Ricardo et al., Reference Ricardo, Fernandes, Mendes, Oliveira, Protes, Scatena, Roça, Athayde, Girão and Alves2015). The bone-fat-muscle ratio affects a carcass yield and it varies according to breed, sex, nutrition, physiologic maturity and weight at slaughter (Johansen et al., Reference Johansen, Aastveit, Egelandsdal, Kvaal and Røe2006; Shackelford et al., Reference Shackelford, Leymaster, Wheeler and Koohmaraie2012; Gardner et al., Reference Gardner, Williams, Ball, Jacob, Refshauge, Hocking Edwards, Behrendt and Pethick2015). According to Grill et al. (Reference Grill, Ringdorfer, Baumung and Fuerst-Waltl2015), increased consumer demand for leaner meats has been driving the selection of a more suitable type of animal to satisfy the market needs. However, fat content determines important organoleptic attributes of the meat, which are also essential for product acceptance (Sinanoglou et al., Reference Sinanoglou, Batrinou, Mantis, Bizelis and Miniadis-Meimaroglou2013). In addition, a minimal amount of fat, especially subcutaneous one, is required for a good carcass presentation and storage during chilling (Cadavez and Henningsen, Reference Cadavez and Henningsen2012).
Usually, most of the carcass characteristics are only determined after slaughter. Yet, in vivo carcass estimations allow for maximizing the use of resources and increases productivity. The assessment of carcass conformation and body condition score are commonly performed to establish the best moment to slaughter lambs, aiming to achieve the best carcass yield. According to Kenyon et al. (Reference Kenyon, Maloney and Blache2014), although being conducted by trained professionals, these assessments are subject to inaccuracies. Conversely, the use of objective measurement methods, especially in vivo, contributes to the reduction of error and adds to the roll of less invasive testing (Zollinger et al., Reference Zollinger, Farrow, Lawrence and Latman2010).
Bioimpedance analysis (BIA) is a minimally invasive technique for evaluating body composition. This approach enables the objective identification of animals that are reaching the optimal economical finishing point. The BIA is based on different levels of conduction and resistance to the passage of an alternating electrical current of 800 µA at 50 kHz through different body tissues (Lukaski et al., Reference Lukaski, Johnson, Bolonchuk and Lykken1985). The application of this method in biological bodies rests on certain assumptions. An ideal bioelectrical conductor is assumed to have a relatively homogeneous composition and finite geometry including cross-sectional area and shape (Lukaski, Reference Lukaski2013). Therefore, theoretically, fat tissue, which is a poor electrical conductor, has high electrical resistance and lean mass, which is composed by protein and water, is related to reactance.
Due to the equipment being portable and its use does not require a big training, BIA data collection is easier and relatively cheaper when compared to other sophisticated methods of analysis, especially the electrical meat measuring equipment (Sarubbi et al., Reference Sarubbi, Baculo and Iannuzzi2008). Consequently, using data from BIA to develop a set of equations to predict carcass characteristics of lambs in vivo could help to objectively determine animals that are closer to the best economic finishing weight for slaughter. Furthermore, these models will contribute to improve the carcass standardization, which is based on quality attributes. In a near future, the selling of lambs might be based on the edible proportion yield of their carcasses. Thus, the objective of this study was to use in vivo BIA to develop biostatistical prediction models to estimate physical characteristics of the lamb carcasses.
Material and methods
All procedures used in this study were submitted and approved (protocol #8259211015) by the Ethics Committee on Animal Trials of the Federal University of Santa Maria, Brazil to be conducted at the Sheep Laboratory of the Department of Animal Science.
Animals
Thirty-one Texel × Ile de France crossbred ram lambs were used for the purpose of this research. The animals were marked, weighed and distributed into eight pens covered from the elements in groups according to similar weight. The pens had slatted-floor and were equipped with feeders and water troughs. Data collection started after 10 days of adaption of the animals to the new facilities, diet and daily management routine. The animals were fed ad libitum, once a day at 8 AM, and the amount of feed was adjusted in order to keep the leftover food at around 10% of the total amount given.
The lambs were weighed at the beginning of the trial followed by weekly weigh-ins until they reached the pre-established slaughter weights of 20, 26, 32 or 38 kg, respectively. Before the slaughter, BW (kg) was recorded after 14 h of solid food fasting, body length (BL, cm) was measured from the last cervical vertebrae to the first sacral vertebrae, and, then, BIA readings were taken.
Bioimpedance measurements
During data collection the lambs were initially restrained with an insulating rope tied to their feet, in order to keep them immobile without using anesthetics. Then, they were laid on plastic tarpaulin for insulating them from any contact with the ground, which could possibly pass an electric current. The animals were positioned on their right side (lateral decubitus) to reduce the likely effect of body water stagnation in the limbs. The wool was shaven off in a straight line on the central region of the lateral face of the leg region (rear limb) and forearm region (front limb). This procedure allowed for a more precise anatomical positioning of the electrodes and their penetration aiming at the standardization of the BIA measurements for all the animals.
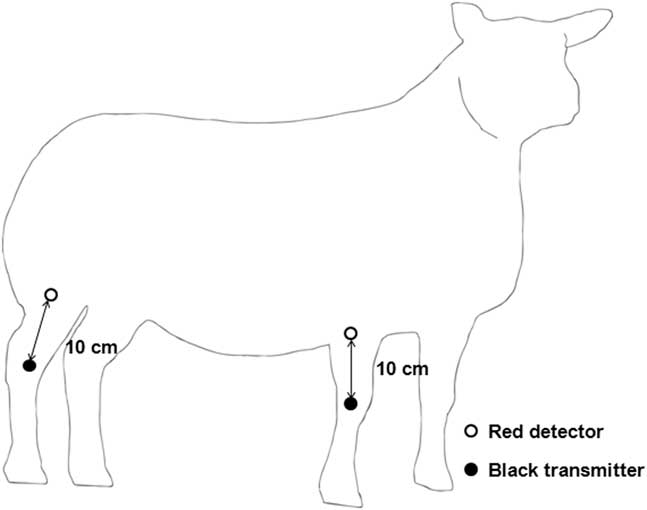
A single-frequency BIA equipment (Model RJL Quantum II Bioelectrical Body Composition Analyzer) was used to make the measurements. The BIA analyzer introduced an alternating electrical current of 800 µA at 50 kHz through the different body tissues and measured the drop in voltage caused by resistance and reactance to the electrical current. The equipment had four cables with terminals that were attached to the electrodes by color-coded electric clips. The black and red electrodes were configured as current transmitters and current detectors, respectively. Data were collected following the method proposed by Jenkins et al. (Reference Jenkins, Leymaster and Turlington1988) and adapted for live lambs. The distal transmitter electrodes were attached onto the extensor muscle complex of the front leg and rear leg, placed in the muscles approximately 3.0 cm proximal to the carpal and tarsal articulations, respectively. Proximal detector electrodes were inserted 10 cm from the transmitter ones, caudal to the knee region (rear limb) and cranial to the elbow region (front limb) as shown in Figure 1. Stainless steel acupuncture needles with spiral cable (0.40 × 15 mm) were used as electrodes and inserted in the animals’ muscle following a standard penetration depth in order to transmit the current throughout all the tissues without it being interrupted (Berg and Marchello, Reference Berg and Marchello1994).
Placement of transmitter and detector electrodes in live lambs for measurement of resistance and reactance.

Based on BIA readings for resistance (Rs, Ω) and reactance (Xc, Ω), which were taken once from each animal, the value of impedance (Z, Ω) was calculated using the formula described by Lukaski et al. (Reference Lukaski, Johnson, Bolonchuk and Lykken1985) where: Z (Ω) = (Rs2 + Xc2)0.5. Resistive density (RsD, kg2/cm2 Ω) and reactive density (XcD, kg2/cm2 Ω) were obtained through the formula adaptations described by Zollinger et al.(Reference Zollinger, Farrow, Lawrence and Latman2010). They proposed to replace the half carcass weight by BW as well as replacing the distance between the electrodes by the BL of the animals. After reworking the formulas became as follows: RsD (kg2/cm2 Ω) = BW2/(BL2/Rs) and XcD (kg2/cm2 Ω) = BW2/(BL2/Xc).
The body bioelectrical volume (V, cm2/Ω) was obtained by calculating the relationship between animal BL and resistance; V (cm2/Ω) = BL2/Rs, adapted from sheep carcasses methodology as described by Jenkins et al. (Reference Jenkins, Leymaster and Turlington1988). The relationship between the resistance and reactance values are derivations from a 50 kHz signal which yields an imaginary vector with length (impedance) and direction that produces an angle called phase angle (PA, °). The PA value was then calculated from the relationship between the arch tangent of reactance and resistance; PA = tan−1 (Xc/Rs), expressed in radians. To convert the values into degrees, the PA values were multiplied by 180°/π as described by Lukaski (Reference Lukaski2013).
Carcass evaluation
After the slaughter, the carcasses were weighed and stored in a chilling chamber at a temperature of 2°C. After 24 h, they were weighed again in order to obtain the cold carcass weight (CCW, kg) and the cold carcass yield (CCY, %), according to the formula: CCY (%) = (CCW/BW) × 100. Carcasses were longitudinally split and transversally cut between the 12th and 13th ribs and the subcutaneous fat thickness (SFT, mm) was measured using pachymeter. The right half carcass was dissected into two main groups of structures: bone and soft tissues (muscle, fat, blood vessels, nerves and connective tissue). The weight of these constituents was multiplied by two and adjusted to the CCW value in order to obtain the soft tissue weight (STW, kg) as well as the bone tissue weight (BTW, kg) corresponding to the CCW. Bone tissue yield (BTY, %) and soft tissue yield (STY, %) (%) were obtained through the following formulas: BTY (%) = (BTW/CCW) × 100 and STY (%) = (STW/CCW) × 100.
Statistical analysis
Multiple regression analyses were performed using Minitab (v.17.1.0; Minitab Inc., State College, PA, USA). Physical characteristics of the lamb carcass were the dependent variables and bioimpedance measurements the independent variables. Correlation coefficients between the BIA measurements and the characteristics of the carcasses were determined. Body weight and the BL of the animals were only used to estimate some BIA variables such as V, RsD and XcD. Stepwise regression was used to eliminate the variables that did not influence variation in the model. Those variables that did not significantly contribute to the model (P >0.05) were eliminated. The biostatistical models were selected for presenting the highest coefficient of determination (R 2), lowest RMSE and the Mallows Cp statistic (Cp) closest to the number of parameters included in the model. Mallows Cp statistic provides a quantitative indicator of possible bias in the model. This statistic was used to determine the number of independent variables regressed for the prediction of physical carcass characteristics. Outliers and systematic bias were identified by plotting studentized residuals against the predicted values and by evaluating Cook’s D coefficients. Data points with a studentized residual outside the range ±2.5 were considered to be outliers. By using this procedure, two animals were removed from the data set used to obtain the predictive equations of CCW, CCY, SFT and STW.
Predictive performance of the models was assessed using leave-one-out cross-validation. Briefly, from the complete data set one animal was selected and regression parameters were estimated with data of the remaining n − 1 animals. Values of CCW, CCY, SFT, STW and STY were predicted for the selected animal by this regression function. Predicted and observed values were compared using the Model Evaluation System (MES v.3.1.13, http://nutritionmodels.com/mes.html) to measure precision and accuracy of the models (Tedeschi et al., Reference Tedeschi2006) by assessing the coefficient of determination (R 2), the root mean squared error of prediction (RMSEP) and the concordance correlation coefficient (CCC).
Results
Descriptive statistic
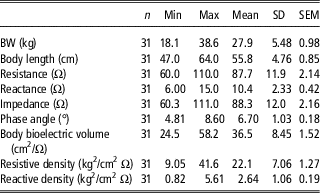
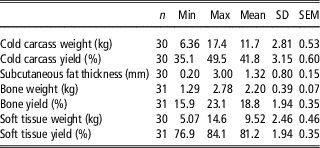
The descriptive statistics with the BIA measurements is shown in Table 1. The mean BW was 27.9 kg, ranging 20.5 kg between the lightest and the heaviest lamb. The BL ranged from 47 to 64 cm. Resistance and reactance variation between the minimal and maximal records were from 60 to 110 Ω and from 6 to 15 Ω, respectively. The relationship of resistance and reactance producing the PA varied from 4.81 to 8.60°. The variables whose Rs or Xc were associated to BW and/or BL, such as V, RsD and XcD, presented mean and standard error of 36.5 ± 1.52 kg2/Ω, 22.1 ± 2.14, kg2/cm2 Ω and 2.64 ± 0.19 kg2/cm2 Ω, respectively. The lamb carcass physical characteristics are listed in Table 2. As expected, BW variation affected the variation of the physical characteristics of the lamb carcasses. The CCW value ranged from 6.36 to 17.4 kg, while CCY averaged 41.8%. Difference in BW also affected the amount of soft tissues, which varied from 5.07 to 14.6 kg, as well as SFT, which ranged from 0.20 to 3.00 mm.
Descriptive statistics of some linear measurements and assessment of bioimpedance on live lambs

n = number of animals; Min = minimum; Max = maximum; SEM = SD/√n.
Descriptive statistics of the physical characteristics of the lamb carcasses

n = number of animals; Min = minimum; Max = maximum; SEM = SD/√n.
Correlations
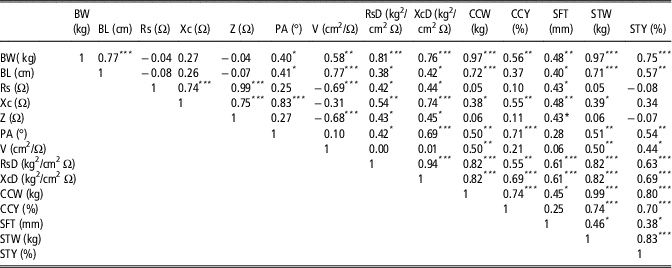
Results of the correlation analysis between in vivo evaluations (linear measurements and bioimpedance readings) and lamb carcass measurements are presented in Table 3. Body weight and BL had a strong correlation with CCW (r = 0.97, P <0.001 and r = 0.72, P <0.001, respectively), STW (r = 0.97, P <0.001 and r = 0.71, P <0.001, respectively), and STY (r = 0.75, P <0.001 and r = 0.57, P <0.01, respectively). Resistance and impedance had a significant correlation only with SFT (r = 0.43, P <0.05). In turn, Xc presented significant correlation with CCW, CCY, SFT and STW (r = 0.38, r = 0.55, r = 0.48 and r = 0.39, respectively). Correlations of CCW, SFT and STW with RsD (r = 0.82, r = 0.60 and r = 0.82, respectively) were similar to those with XcD (r = 0.81, r = 0.61 and r = 0.82, respectively). However, XcD was better correlated with CCY and STY (r = 0.69 and r = 0.69, respectively) than RsD (r = 0.55 and r = 0.63, respectively). Phase angle was correlated to CCW, CCY, STW and STY (r = 0.50, r = 0.71, r = 0.51 and r = 0.54, respectively), while V was correlated only to CCW, STW and STY (r = 0.50, r = 0.50 and r = 0.44, respectively).
Correlation matrix between in vivo assessments (linear measurements and bioimpedance readings) and physical characteristics of the lamb carcasses

BL = Body length; Rs = Resistance; Xc = Reactance; Z = Impedance; PA = Phase angle; V = Body bioelectrical volume; RsD = Resistive density; XcD = Reactive density; CCW = Cold carcass weight; CCY = Cold carcass yield; SFT = Subcutaneous fat thickness; STW = Soft tissue weight; STY = Soft tissue yield.
* P < 0.05
** P < 0.01
*** P < 0.001.
Prediction models
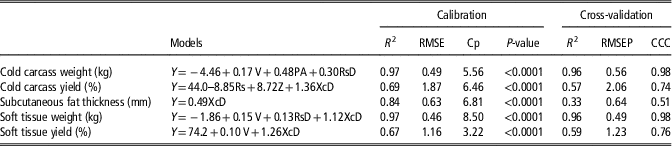
Biostatistical models to predict physical characteristics of the lamb carcass from bioimpedance variables are shown in Table 4. Resistive density accounted for 66.6% of the CCW variance. When V and PA were included in the predictive model of CCW, the R 2 reached 97.3%. In turn, the model to estimate STW included XcD, V and RsD, which cumulatively explained 66.8%, 95.3% and 96.9%. Cold carcass yield was predicted for Rs, Z and XcD, which together accounted for 68.8% of its variance. Subcutaneous fat thickness was estimated only for XcD. In this model, the constant term (intercept) was not significant (P = 0.80), and then it was removed from the model. Reactive density explained 48.2% of the variance in STY, but it was increased to 66.7% by including V in the model. The adequacy of these equations to predict carcass characteristics can be assessed by the results of the cross-validation analysis. The prediction models of CCW and STW were high precise and accurate (R 2 of 0.96 and 0.96, RMSEP of 0.56 and 0.49, and CCC of 0.98 and 0.98, respectively). Predictive performances reasonably good were also observed for the CCY and STY models (R 2 of 0.57 and 0.59, RMSEP of 2.06 and 1.23, and CCC of 0.74 and 0.76, respectively). In turn, adequacy of the model used to predict SFT was low (R 2 = 0.33, RMSEP = 0.64 and CCC = 0.51).
Biostatistical models for predicting physical characteristics of the lamb carcass through in vivo bioimpedance analysis

R 2 = Coefficient of determination; Cp = Mallows Cp statistic; RMSEP = Root mean squared error of prediction; CCC = Concordance correlation coefficient; V = Body bioelectrical volume; PA = Phase angle; RsD = Resistive density; Rs = Resistance; Z = Impedance; XcD = Reactive density.
Discussion
The range between resistance and reactance (Table 1) were considerably higher than those reported by Berg and Marchello (Reference Berg and Marchello1994) and by Avril et al. (Reference Avril, Lallo, Mlambo and Bourne2013). Both groups of researchers have performed their estimates in the dorsal area of the animals, while in our study measurements were made in the limb areas. Although the animals used by Berg and Marchello (Reference Berg and Marchello1994) were slaughtered at higher average BW (55.1 ± 4.95 kg) in comparison with the animals in our study and, hence, greater values of Rs and Xc would be expected, the smaller average distance between current detector electrodes in their study (39.8 ± 5.28 cm) can explain the lower average bioimpedance values they found. Unlike the assessment methodology of the aforementioned authors, our estimates were performed in the limb areas in order to allow the electric current pass throughout the entire body of the animals. In this sense, the assessment in the lumbar region was avoided since this region may present large fat depots (Kempster, Reference Kempster1981) and, therefore, indicate a likely bias regarding the real carcass composition.
The correlations between physical characteristics of lamb carcasses and the BIA primary variables (Rs and Xc), although significant, were lower than those observed with RsD and XcD. Significant correlations between the primary values of resistance and reactance and physical components of the lamb carcass were also reported by Berg et al. (Reference Berg, Neary, Forrest, Thomas and Kauffman1996). However, Swantek et al. (Reference Swantek, Crenshaw, Marchello and Lukaski1992) performing bioimpedance evaluations in pigs, found higher correlations between these variables when they were related to body volume, which was confirmed in our study. Nevertheless, these results are in accordance with the electric conductivity principle of biological components, reported by Lukaski et al. (Reference Lukaski, Johnson, Bolonchuk and Lykken1985), because BIA depends on the area of the conductive material and its length.
The positive correlations found between BIA measurements and physical carcass characteristics indicate that the higher the body mass during the lambs’ natural anatomical and physiological development the higher was the body bioelectrical volume, resistive density and reactive density. According to Wood et al. (Reference Wood, MacFie, Pomeroy and Twinn1980), increasing slaughter weight affects carcass composition in terms of muscle, fat and bone percentages. Furthermore, as the body increases its weight, it becomes relatively more compact (Owens et al., Reference Owens, Dubeski and Hansont1993) and consequently denser. Therefore, when considering BIA it seems that adding the values of both BW and BL to others such as body volume and body density is needed because of the different level of conduction and opposition to the passage of the electric current applied in different body tissues. According to Altmann et al. (Reference Altmann, Pliquett, Suess and Borell2005), in the regression equations the combination of weight with the BIA variables increased the accuracy of the prediction models of the carcass components. This explains how the use of some novel variables of bioimpedance with sheep, such as the resistive and reactive densities, together with the phase angle and body bioelectric volume has contributed to accurately estimating important physical characteristics of the lamb carcasses.
Cold carcass weight and STW were mostly explained by resistive density and reactive density, respectively. In addition, it is clear that these parameters also depend on their body bioelectrical volumes. Phase angle was also used in the model to estimate the CCW, possibly because the lambs were in fully grown, thus naturally increasing their body mass. This fact may be explained by the PA being dependent of the capacitance, which is associated to the quality, size, and cellular integrity of the body. Variation in PA indicated changes in the body composition, since according to Norman et al. (Reference Norman, Stobäus, Pirlich and Bosy-Westphal2012) it is strongly related to muscle mass. Otherwise, reactive density was also used in the model for predicting CCY, STY and it was the only one variable used to predict SFT. All of these characteristics are related to an increase in the cell body size, especially of adipose ones. Thus, XcD might serve as an indicator of body condition on the fattening process. Resistive and reactive densities were also reported as important variables to estimate beef carcass composition (Zollinger et al., Reference Zollinger, Farrow, Lawrence and Latman2010). Although the authors did not detail how they got their formulas, the strong correlations obtained explained the use of RsD and XcD in most of the predictive models.
The models obtained to predict carcass and soft tissues weights were much more precise and accurate than those used to predict carcass and soft tissues yields, which is strongly evidenced for the values of CCCs being very close to 1. However, since the BW of the animals can be measured and carcass and STWs can be accurately estimated, all proportional relation between these variables can be easily mathematically accessed. In this sense, because in our study the animals were slaughtered at BWs ranging from 20 to 38 kg, the prediction models obtained are a useful decision support tool to provide information on the ideal slaughter time to reach optimal values of carcass and edible tissues yield, catering for the demands of different groups of consumers.
Conclusion
The models obtained through the in vivo BIA provide an accurate, objective and minimally invasive method to predict cold carcass and STWs of growing ram lambs. In turn, estimated values can be used to calculate cold carcass and STYs of the lamb carcasses.
Acknowledgments
The authors thank Coordenação de Aperfeiçoamento de Pessoal de Nível Superior (CAPES) for the scholarship granted to the first author. The authors are also very grateful to Luis Kluwe de Aguiar, Senior lecturer at Harper Adams University, England, for revising this article.
Declaration of interest
The authors declared no conflicts of interest.
Ethics statement
All procedures involving animal handling and treatment were approved (protocol #8259211015) by the Ethics Committee on Animal Use in Research of the Federal University of Santa Maria.
Software and data repository resources
None.