Introduction
Safflower, Carthamus tinctorius L., is an oilseed crop, used both for cooking and industrial purposes. It has wide adaptability to several ecophysiological conditions, developing satisfactorily under low water availability, low fertility soils and in locations with temperature variations, thus being an appropriate crop for arid and semi-arid regions of the world. Generally, new superior safflower varieties must be developed by breeding and selection methods among the existing genetic resources. Low grain yield and long growing time are the two main problems of safflower, which has led to the need for new superior cultivars. Determination of the characters that affect grain and oil yield in safflower is critical in genetic improvement for these attributes (Golparvar, Reference Golparvar2011). Yield is a complicated quantitative character which is the root of actions and interactions of different traits (Saeed et al., Reference Saeed, Khattak and Zamir2007; Tonk et al., Reference Tonk, Ilker and Tosun2011; Ranawake and Amarasinghe, Reference Ranawake and Amarasinghe2014). In breeding programmes intended to develop high-yielding genotypes, it is essential to know how and to what extent morphological traits affect yield (Kose et al., Reference Kose, Onder, Bilir and Kosar2018). The positive and significant correlation between safflower morphological traits and grain yield in semi-arid areas has been reported (Oarabile et al., Reference Oarabile, Emongor, Oagile and Phuduhudu2016). Yield components do not only directly affect the yield, but also indirectly affect other yield components in negative or positive ways (Mokhtassi Bidgoli et al., Reference Mokhtassi Bidgoli, Akbari, Mirhadi, Zand and Soufizadeh2006). La Bella et al. (Reference La Bella, Tuttolomondo, Lazzeri, Matteo, Leto and Licata2019) reported a positive and significant relationship between grain/oil yield and morphological, phenological and agronomical traits of 16 safflower accessions. Plant height, number of branches, number of heads, 1000-grain weight and oil content percentage have been reported as the most correlated morphological and yield parameters with grain yield (Çamaș et al., Reference Çamaș, Ayan and Çırak2005).
Different statistical methods are used for these purposes. Correlation coefficients used to determine relationships between yield and yield components are important in selecting breeding materials (Laei et al., Reference Laei, Noryan and Afshari2012; Zafarnaderi et al., Reference Zafarnaderi, Aharizad and Mohammadi2013; Reiahisamani et al., Reference Reiahisamani, Esmaeili, Khoshkholgh Sima, Zaefarian and Zeinalabedini2018). Based on multivariate statistical methods, number of heads, grain yield and days to flowering have been reported as the most important variables for grain yield variation in safflower genotypes (Çamaș et al., Reference Çamaș, Ayan and Çırak2005; Golparvar, Reference Golparvar2011; Karimi et al., Reference Karimi, Golparvar and Shams2013; La Bella et al., Reference La Bella, Tuttolomondo, Lazzeri, Matteo, Leto and Licata2019). These characters are affected by environmental conditions and genotypic differences (Çamaş and Esendal, Reference Çamaş and Esendal2006; Arslan, Reference Arslan2007). Therefore, the present study was aimed to assess the yield components as well as morphophonological traits of safflower genotypes (collected from more than 30 countries) and to determine their interrelationships through multivariate analysis to select superior safflower genotypes. Moreover, the impact of agro-morphological traits on grain yield was determined and genotypes were classified based on phenological and morphological parameters.
Materials and methods
Site description
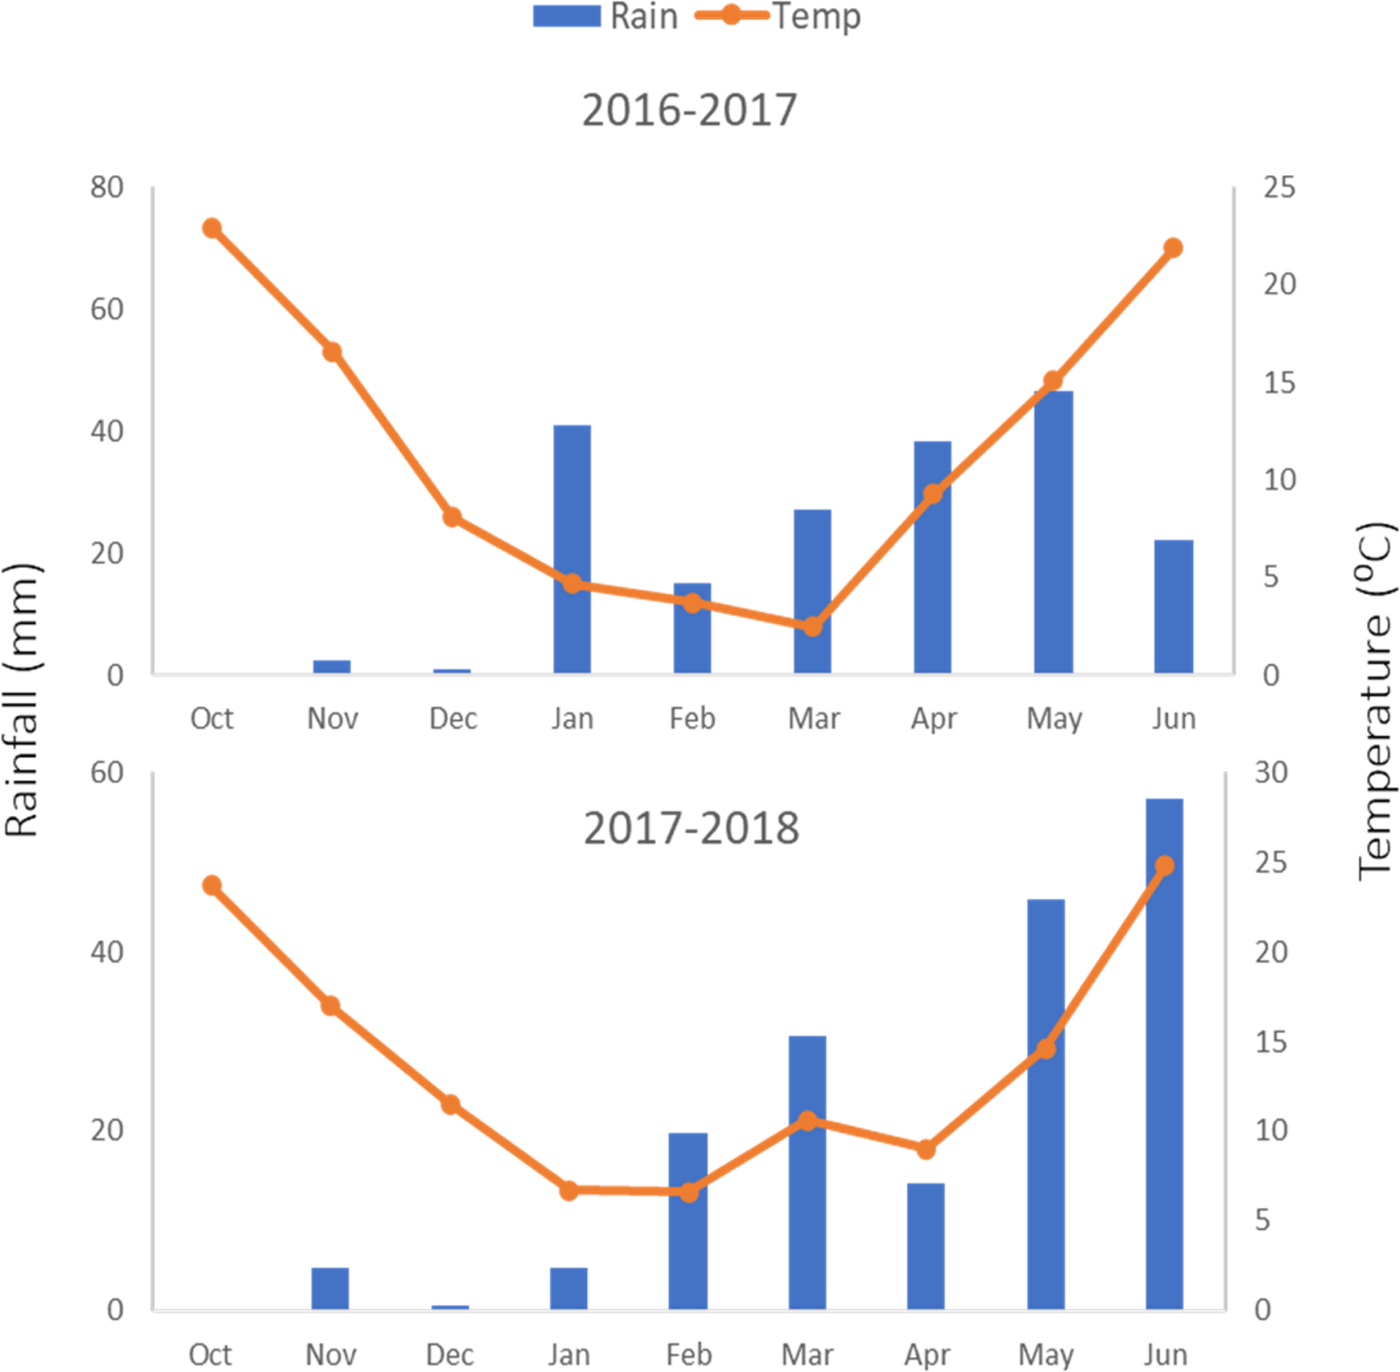
The present study was conducted at the experimental field of Seed and Plant Improvement Institute (SPII) in Alborz province, Iran (35°49′12″N, 51°06′33″E, 1321 m) as two field experiments during 2016–2017 and 2017–2018 cropping years. The study location is characterized by a semi-arid climate with annual average precipitation of 243 mm, and the annual mean maximum and minimum temperatures of 30 and 1°C, respectively. Local climatic data for the growing seasons in the study area are presented in Fig. 1. The soil structure was clay-loam, and the soil pH and electrical conductivity (EC) were determined as 7.2 and 2.2 dS/m, respectively.
Mean temperature and rainfall at the experimental site during 2016–2018.

Field preparation and planting
In both cropping years, the experimental field was disked and plowed before planting to incorporate plant residues and to form a seedbed. Prior to planting, a composite soil sample was collected at a depth of 0–30 cm, and after air drying, it was passed through a 2 mm sieve. The physical and chemical properties of soil were determined via standard soil analysis methods (online Supplementary Table S1). The experiment was conducted as an augmented randomized complete block design with three replications. A total of 122 safflower genotypes, different in origin, obtained from the Institute of Plant Genetics and Crop Plant Research (IPK) and International Maize and Wheat Improvement Center (CIMMYT) were assessed based on morphological and agronomic traits, as shown in online Supplementary Table S2. The genotypes were compared with five Iranian safflower cultivars (Soffe, Goldasht, Golmehr, Padideh and Parnian) which were utilized as reference cultivars in the present study. Before sowing the plants, according to the soil chemical properties, half of nitrogen and the whole phosphorous requirement supplied with the urea and superphosphate fertilizers, respectively, and the corresponding amounts of these fertilizers were incorporated into the soil. The other half of urea was applied at the stem elongation stage. Safflower grains were surface-disinfected with a fungicide before planting and sown on 18 October 2016 and 16 October 2017 in three rows at 5 cm intervals (row length: 3 m, row distance: 30 cm). For sampling, a length of 50 cm from the plots side was excluded for removing the marginal effect. In order to evaluate the yield components at the maturity stage, whole plants were harvested in July.
Agronomic measurements
At the plant maturity stage, in the July of 2017 and 2018, eight plants in each plot were cut from the ground level and then oven-dried at 70°C until obtaining a constant weight. Grains were separated from straw by crushing, and weighted by a balance; plants grain yield was calculated based on the plant population per ha. The agronomic characteristics including days for flowering, plant growth duration (cycle), plant height, flower colour and spininess were evaluated. The evaluated yield components were the number of heads per plant, number of grains per heads, number of branches per plant, number of grains per plant, estimated by counting and 1000-grains weight measured with an analytical balance (0.001).
Statistical analyses
Statistical analyses were performed using the SAS v9.1 package (SAS Institute, Cary, NC, USA) and SPSS v17.0 (Chicago, IL, USA) statistical analysis software and the data were subjected to the correlation analysis and principal component analysis (PCA), hierarchical cluster analysis using average linkage with squared Euclidean distance.
Results
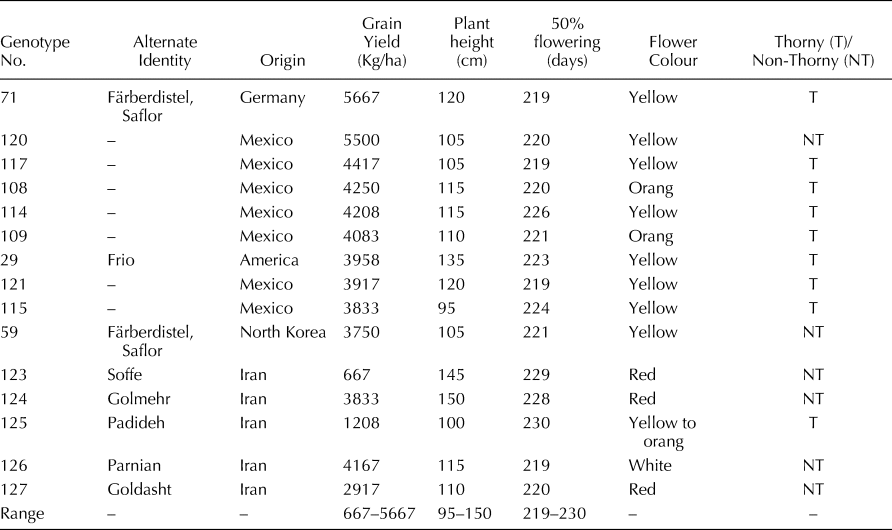
In the present study, safflower genotypes in the Karaj region had significant differences in terms of the developmental stages, thorniness, plant height, flower colour, size and number of heads, number of grains per head and grain yield. Quantitative and qualitative values of the studied traits such as florets' colour, thorniness status, number of days prior to flowering, stem diameter, head diameter, number of heads per plant, number of grains per head, number of secondary branches, plant height and grain yield of studied genotypes are shown in online Supplementary Table S2. The grain yield of the top 10 genotypes with five Iranian native genotypes is summarized in Table 1. According to the results, genotypes No. 71 and 120 by more than 5000 kg/ha grain yield as well as genotypes of 117, 108, 114, 127 (Parnian) and 109 by grain yield of more than 4000 kg/ha were the superior ones. Nevertheless, the genotypes number 124 (Soffe), 49 and 110 by the grain yield of less than 700 kg/ha were ranked the last (Table 1).
Top 10 genotypes in seed yield (kg/ha)

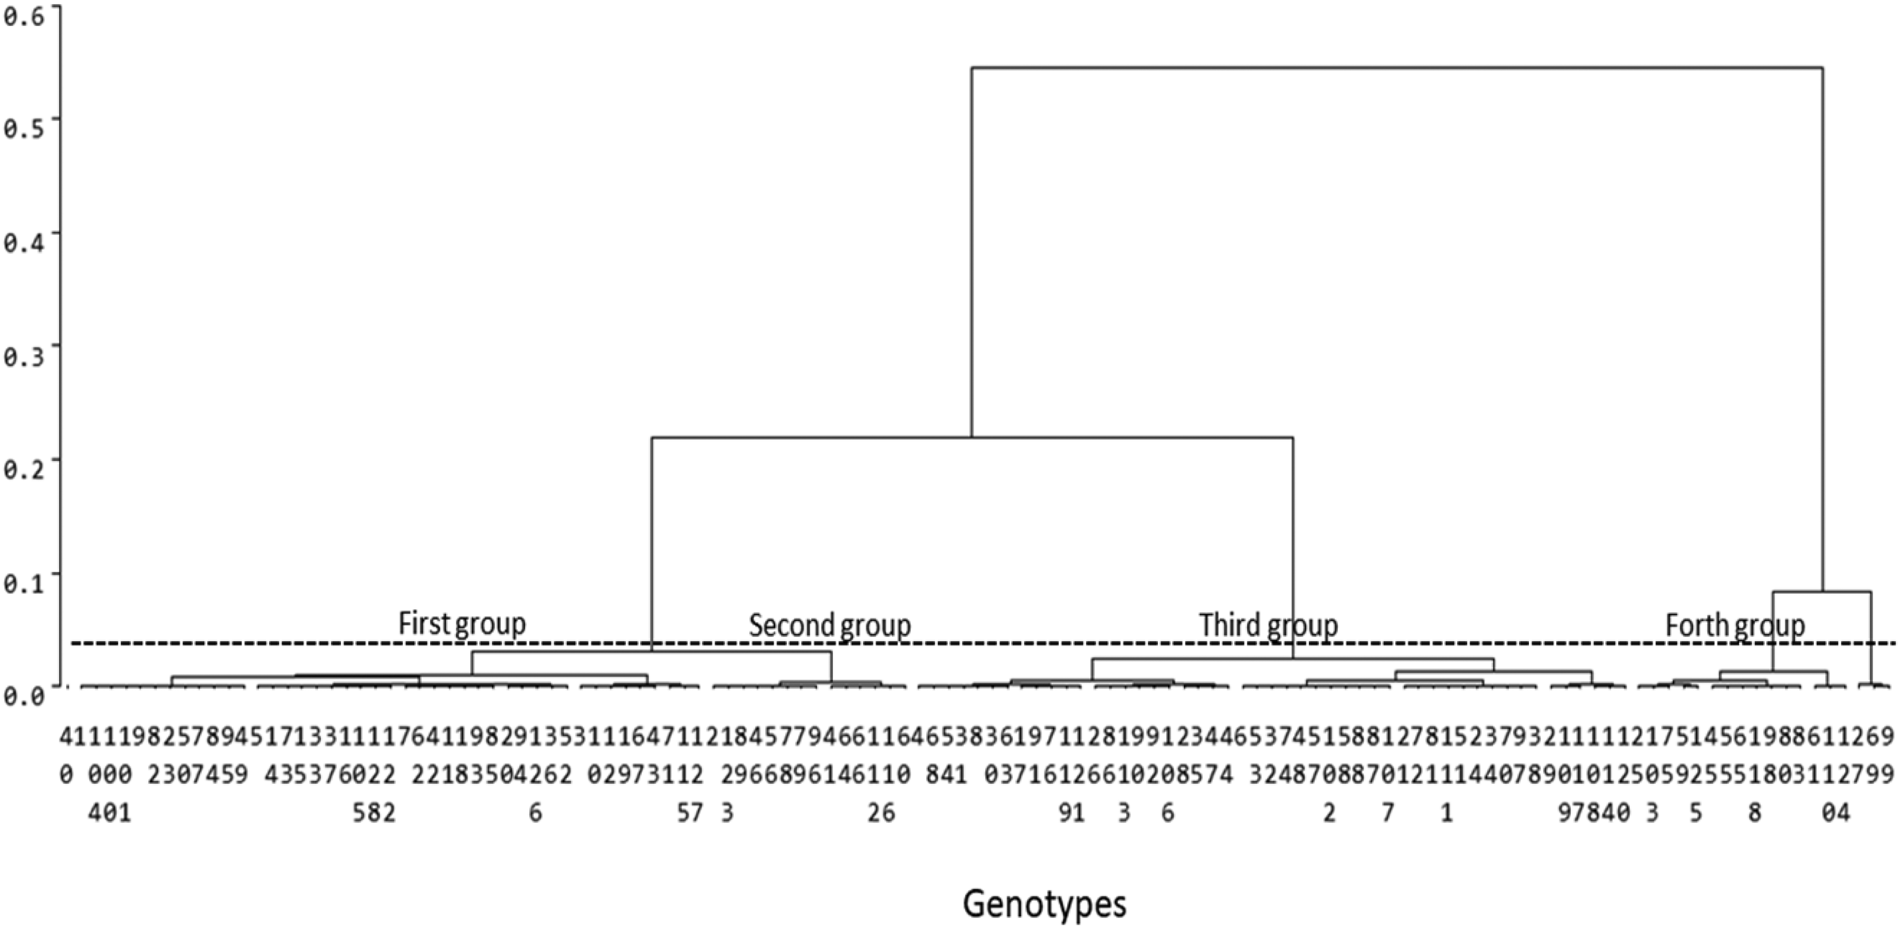
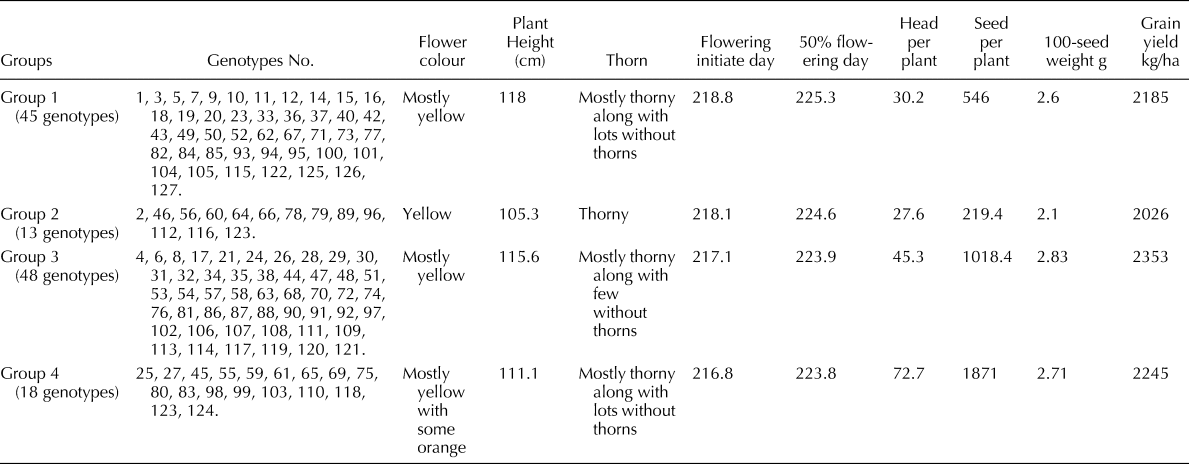
Cluster analysis of 127 safflower genotypes using the Ward method and based on Euclidean distance resulted in four cluster groups (Fig. 2). There were a large number of genotypes (45 genotypes) in the first cluster with the dominant characteristics such as yellow-coloured flower, highest plant height, mostly thorny but with a wide range of genotypes without thistle, late-flowering with the number of heads per plant, number of grains per head, 1000-grain weight and relatively low grain yield.
Dendrogram produced by clustering based on means of 12 morphological and phenological traits of 127 safflower genotypes.

However, Parnian and Goldasht, which were early flowering cultivars, along with the Padideh cultivar, which is the late-flowering variety, were also in the first cluster (Table 2). There were 13 genotypes in the second cluster, as the smallest cluster with characteristics such as yellow florets, semi-dwarf, thorny, moderately late-flowering, low number of heads per plant and number of grains per head, low 1000-grain weight and lower grain yield (Table 2). The largest cluster (third cluster) includes 48 genotypes with characteristics such as mostly yellow-coloured flowers, mostly thorny with few thistle genotypes, relatively early-flowering, relatively high heads number per plant and grain number per plant, and highest 1000-grain weight with the highest grain yields (Table 2). Eighteen safflower genotypes were clustered in the fourth cluster, most of which were relatively short, thorny (with a relatively large number of thistle-free genotypes) and early flowering. Genotypes in cluster 4 had the highest number of heads per plant and number of grains per head, and had higher grain yield and average 1000-grain weight (Table 2).
Cluster analysis and grouping of safflower genotypes based on the studied traits

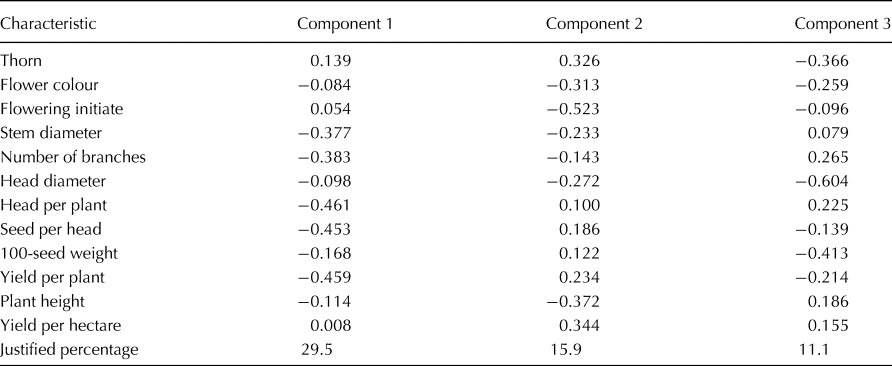
PCA resulted in three components (Table 3). Results showed that the first three components accounted for 29.5, 15.9 and 11.1% of the total variation, respectively. Accordingly, the sum of the first and second components accounted for 45.4%, and the amount of the first, second and third components explained 56.5% of the total variation (Table 3). The results also indicated that stem diameter, the number of secondary branches, the number of heads per plant and the number of grains per head had the highest correlation with the first component. However, the grain yield, flower colour, flowering initiation and plant height had the highest correlation with the second component and the thorniness traits, 1000-grain weight and head diameter had the highest correlation with the third component (Table 3). The number of heads per plant and the number of grains per head were negatively and highly correlated with the first component. Hence, the first component was designated as yield components. In contrast, due to the negative strong correlation between the start of flowering and plant height with the second component, this component was nominated as the plant phenology and architecture (Table 3).
Eigenvectors and eigenvalues generated by principal component analysis applied on morphological and phenological traits of 127 safflower genotypes

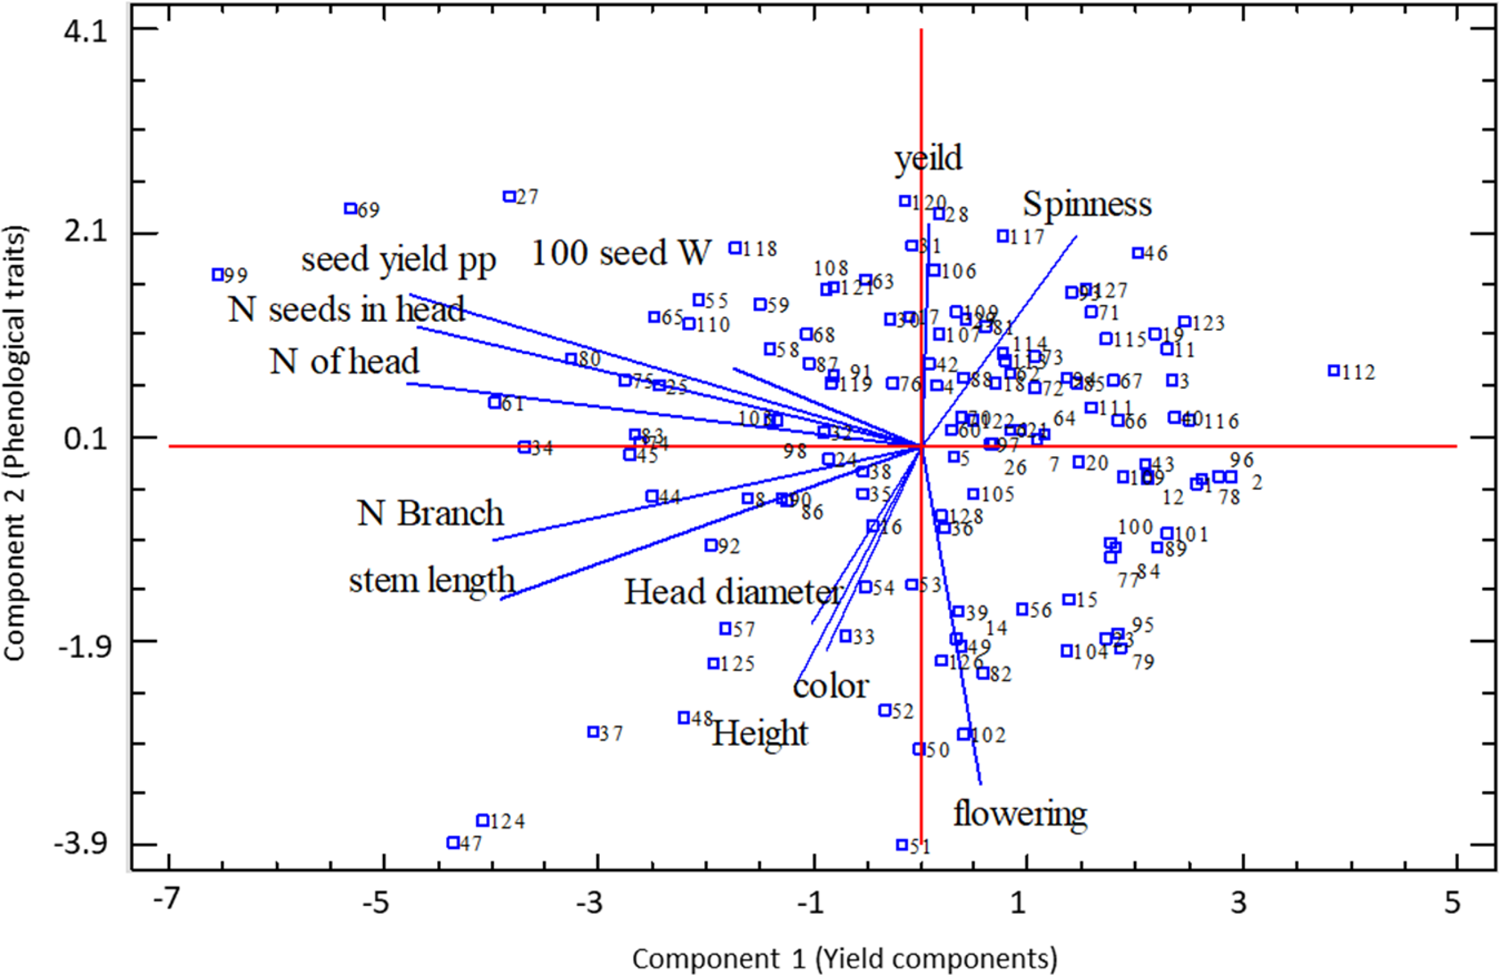
Graphic representation of the biplots based on the first and second principal components showed that the studied genotypes were classified into four groups (Fig. 3). High-yielding genotypes such as genotypes number 71, 120, 117, 108, 114, 127 (Parnian) and 109 were aligned with the grain yield vector and were close to this vector (Fig. 3). Most of the above-mentioned high yielding genotypes were thorny (except Parnian), yellow-coloured flower (except Parnian) with relatively high plant height, and early flowering characteristics, most of which were in the first or third groups along the grain yield vector (Fig. 3 and Table 2). Also, most of the high yielding genotypes were in the third cluster in terms of grain yield (Table 2). In contrast, low-yielding genotypes such as genotypes 124 (Soffe), 50 and 47 were classified in the fourth group as opposed to the grain yield vector (Fig. 3).
Biplot representation of 127 safflower genotypes by using morphological and phenological traits based on principal components analysis.

Discussion
Pavithra et al. (Reference Pavithra, Srinivasula Reddy, Dinakar, Hanumantha Rao, Satpathy and Mohanty2016) ran a correlation analysis to evaluate the relationship between essential safflower traits. The authors reported a positive and significant relationship between grain yield and plant height, and a negative correlation between grain yield and flowering time among 150 safflower genotypes (Pavithra et al., Reference Pavithra, Srinivasula Reddy, Dinakar, Hanumantha Rao, Satpathy and Mohanty2016). Yasari et al. (Reference Yasari, Shahsavari, Barzegar and Omidi2005) have also pointed out the significant difference between thorny and non-thorny safflower genotypes in terms of developmental stages, which is inconsistent with the findings of the present study. Cluster analysis and classification of 30 spring safflower cultivars based on the morphological characteristics showed that varieties were divided into two main groups and native populations. The lines and modified genotypes of safflower were in the separate groups and subgroups with a great diversity of morphological traits (Ahmadzadeh, Reference Ahmadzadeh2013).
This efficient method is used to identify relationships between traits in a multi-trait system, such as crop growth. Measuring the genetic diversity of the germplasms is carried out by different methods and techniques; however, evaluation of the genetic diversity is conducted using shape, size and variety of morphological characteristics (leaves, stems, shoots, flowers, etc.) (Shinwari et al., Reference Shinwari, Rehman and Rabbani2014). An analysis of the main component of 122 safflower genotypes collected from different eco-geographical regions of the world showed a significant variation among the studied germplasm. The most important traits that caused variation in safflower germplasm were head size, the number of heads per plant, the number of grains per head, growth period, plant height and the number of days to flowering, respectively (Shinwari et al., Reference Shinwari, Rehman and Rabbani2014). Shiravand and Majidi (Reference Shiravand and Majidi2015) also reported a wide variation among safflower genotypes in terms of the number of days to stem formation, flowering, maturity, flower colour, the number of main shoots, height, thistle, number of heads per plant, number of grains per head, 1000-grain weight, grain yield and grain oil percentage.
In the study of PCA in 20 safflower cultivars by Bahmankar et al. (Reference Bahmankar, Nabati and Dehdari2017), around 80% of the total variance in the data was explained by three components, where the contribution of the first, second and third components was 34, 32 and 14%, respectively. In their study, the first component was designated as yield and yield components (traits including head diameter, single plant yield, 1000-grain weight and the number of grains per head). The second component as phenological traits components (days to 50% flowering, days to initiation of flowering and days to maturity). Also, the third component was nominated as the plant architecture component (number of heads per plant and height) (Bahmankar et al., Reference Bahmankar, Nabati and Dehdari2017). Based on the findings of Bahmankar et al. (Reference Bahmankar, Nabati and Dehdari2017), the most effective screening indices for safflower breeding programmes were the primary head diameter, 1000-grain weight, number of head per plant and phenological traits.
Studying the genetic diversity of different genotypes provides valuable information on germplasm maintenance and utilization for breeders to improve breeding programmes (Gholami et al., Reference Gholami, Sabaghnia, Nouraein, Shekari and Janmohammadi2018). In general, a considerable genetic variation was observed in safflower germplasm, which can be used to select suitable parents in safflower breeding programmes; the genotypes having higher plant height had better grain yield than the shorter ones which might be a good option for this purpose.
Supplementary material
To view supplementary material for this article, please visit https://doi.org/10.1017/S1479262120000301