




No CrossRef data available.
Article contents
Should symptoms be scaled for intensity, frequency, or both?
Published online by Cambridge University Press: 29 April 2003
Abstract
Objective: This study evaluated the comparability of two 5-point symptom self-report rating scales: Intensity (from “not at all” to “very much”) and Frequency (from “none of the time” to “all of the time”). Questions from the Functional Assessment of Chronic Illness Therapy (FACIT)-Fatigue 13-item scale was examined.
Methods: Data from 161 patients (60 cancer, 51 stroke, 50 HIV) were calibrated separately to fit an item response theory-based rating scale model (RSM). The RSM specifies intersection parameters (step thresholds) between two adjacent response categories and the item location parameter that reflects the probability that a problem will be endorsed. Along with patient fatigue scores (“measures”), the spread of the step thresholds and between-threshold ranges were examined. The item locations were also examined for differential item functioning.
Results: There was no mean raw score difference between intensity and frequency rating scales (37.2 vs. 36.4, p = n.s.). The high correlation (r = .86, p < .001) between the intensity versus frequency scores indicated their essential equivalence. However, frequency step thresholds covered more of the fatigue measurement continuum and were more equidistant, and therefore reduced floor and ceiling effects.
Significance of results: These two scaling methods produce essentially equivalent fatigue estimates; it is difficult to justify assessing both. The frequency response scaling may be preferable in that it provides fuller coverage of the fatigue continuum, including slightly better differentiation of people with relatively little fatigue, and a small group of the most fatigued patients. Intensity response scaling offers slightly more precision among the patients with significant fatigue.
Information
- Type
- Research Article
- Information
- Copyright
- © 2003 Cambridge University Press
INTRODUCTION
Over the past 20 years, interest in extending treatment evaluation beyond traditional clinical endpoints has led to an increased effort to systematically measure patient-reported well-being and quality of life (QOL; Coons & Kaplan, 1992; Kong & Gandhi, 1997). The emergence of QOL as an important health outcome has been bolstered by the recognition that (1) physiologic measures do not always correlate well with patient-reported health outcomes, and (2) new drug evaluation should include outcomes important to people's lives that include, but are not limited to clinical efficacy and toxicity (MacKeigan & Pathak, 1992). It is often desirable to measure self-reported symptoms in patient populations in order to track disease progression over time or to evaluate the effects of various treatments on the symptom-related aspects of QOL.
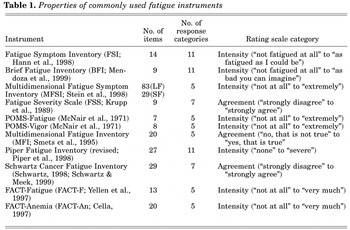
Fatigue is both a common symptom of many illnesses and a side effect of many treatments. Consequently, a number of instruments have been developed to measure it with a variety of rating scales. A summary of the properties of commonly used fatigue instruments is shown in Table 1. Most fatigue instruments assess severity or intensity of fatigue symptoms, whereas the others assess the degree to which respondents endorse a particular statement about fatigue. None of the common fatigue instruments measures frequency of symptom occurrence. However, a survey conducted by the Fatigue Coalition specifically questioned patients about the frequency of their fatigue symptoms (Curt et al., 2000). In addition, the Medical Outcomes Study item pool has many items that assess frequency, and these have been found to be more sensitive than other response choices to differences at the ceiling of measurement (Stewart & Ware, 1992; Hays et al., 1994).
Properties of commonly used fatigue instruments

The purpose of the present study was to compare two rating scales in measuring fatigue, a common symptom in chronic illness (Vogelzang et al., 1997; Yellen et al., 1997; Cella, 1998; Stone et al., 2000; Cella et al., 2001) using item response theory model. One rating scale asks patients to answer fatigue items by endorsing the severity of their fatigue (from “not at all” to “very much”) and the other asks patients to endorse fatigue items according to frequency of their fatigue (from “none of the time” to “all of the time”).
METHODS
Participants
Data were collected from 161 patients (60 cancer, 51 stroke, 50 HIV) as a part of a larger project conducted to develop a fatigue item bank and computerized adaptive testing platform to measure fatigue in various patient populations. Sociodemographic data were collected by interview from patients prior to completing the computer-based testing and were recorded on a standardized form at interview and later entered into a Microsoft Access database.
Cancer patients were approached either following a nurse referral while undergoing chemotherapy or in the waiting area after a visit with their physician. Stroke and HIV patients were recruited while in the waiting area before or after a clinic visit. Thirty-two patients (24 cancer, 8 stroke) were recruited from Evanston Northwestern Healthcare, 86 (36 cancer, 50 HIV) from Northwestern Memorial Hospital, and 43 stroke patients from the Rehabilitation Institute of Chicago.
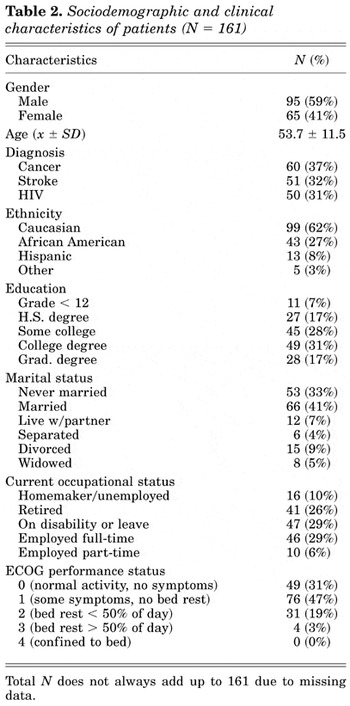
Sociodemographic and clinical characteristics of these patients are presented in Table 2. Cancer patients comprised the following diagnoses: 22% breast, 17% non-Hodgkin's lymphoma, 14% colorectal, 7% lung, 5% ovarian, 4% esophageal or head/neck, 3% cervical, 3% endometrial, 2% melanoma, 2% pancreatic, 20% other cancer, and 4% unknown. Most (70%) of the strokes were of the infarct type, while 30% were due to bleeding. For HIV patients, mean CD4 count was 458 μl (range = 6 to 1,248).
Sociodemographic and clinical characteristics of patients (N = 161)

Instrument and Procedures
Item response data on the Functional Assessment of Chronic Illness Therapy (FACIT)–Fatigue (Cella, 1997; Yellen et al., 1997) were collected. The 13 items, developed specifically to measure fatigue in chronically ill populations (Yellen et al., 1997), were administered twice amidst a larger set of 131 questions about fatigue. The 131 questions were administered using a touch-screen laptop computer. Each question appeared one at a time on the screen with the response categories. The set of 131 items was divided into five blocks of related questions. The two 13-item sets of interest in this report comprised two of the five blocks. Blocks of questions were counterbalanced in order, ensuring that the two 13-item fatigue question sets were never positioned together. The two 13-item sets utilized two different rating scales. One addressed the intensity of fatigue items (“not at all,” “a little bit,” “somewhat,” “quite a bit,” “very much”) and the other addressed the frequency of fatigue symptoms (“none of the time,” “a little of the time,” “some of the time,” “most of the time,” “all of the time”).
Analysis
Rating Scale Model (RSM)
The two rating scale item response data were analyzed separately using Andrich's (1978a, 1978b, 1978c) rating scale model (RSM). The RSM is an item response theory (IRT)-based measurement model and has been implemented in the WINSTEPS computer program (Linacre & Wright, 2001). This model was chosen because it allows examination of the category structure of the two rating scales. The RSM specifies two facets (person latent trait, Bn; item location, Di), and the step threshold (Fi). The probability of person n responding in response category j to item i can then be expressed by the formula

in which Pnij is the probability of person n endorsing or choosing in category j of item i, Pni(j−1) is the probability of person n endorsing or choosing in category j − 1 of item i, Bn is the latent trait measure (e.g., fatigue) of person n, and Di is the location of item i, and Fj is the step threshold between categories j − 1 and j. In the present study, for example, F1 for the intensity scale is the transition from intensity category 1 (“not at all”) to category 2 (“a little bit”) and F4 is the transition from category 4 (“quite a bit”) to category 5 (“very much”). That is the point on the latent trait scale (i.e., fatigue) at which two consecutive category response curves intersect.
Each of the three terms (Bn; Di; Fj) on the right side of the equation above can be compared using intensity versus frequency scaling. In this way, we can directly compare the measurement properties of intensity scaling to those of frequency scaling. We will refer to these as person fatigue measure (Bn) equivalence; item location (Di) equivalence; and step threshold (Fj) equivalence. Each of these terms is now described.
Person Fatigue Measure (Bn) Equivalence
This refers to the actual fatigue score obtained using either intensity or frequency scaling. This was evaluated using correlational data of individual scores using each rating scale and a simple comparison of the average fatigue measures obtained with both approaches. Scores obtained from the two rating scales were also plotted against each other to depict their relationship.
Item Location (Di) Equivalence
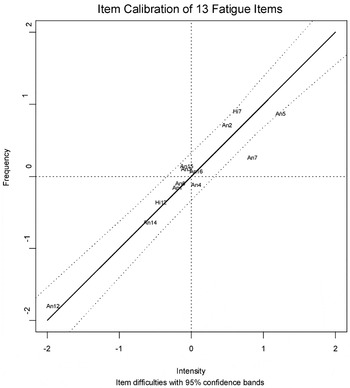
“Item location” is also referred to as item difficulty. Whether the 13 fatigue items measured the same underlying construct (fatigue) with the two rating scales was determined by comparing the two sets of item locations obtained via RSM. The hierarchical structure of item locations (from “easy” to “hard,” reflecting less fatigue to more fatigue) represents the underlying concept for each rating scale as well as its qualitative meaning for study participants and ideally is independent of the two rating scales being used. Items that are located at different points along the continuum are said to display differential item functioning (DIF). Items that displayed DIF were identified using a pairwise comparison between the two sets item locations (difficulties; i.e., intensity versus frequency). The item locations from each separate calibration were centered and plotted against each other (e.g., frequency on the y-axis and intensity on the x-axis). An identity line with a slope of 1 was drawn through the origin of each plot. Statistical control lines (95% confidence intervals) were drawn to guide interpretation, and the plots were examined visually and statistically to see if any items fall outside the control lines, thereby reflecting DIF. Standard z statistics (see Wright & Stone, 1979, pp. 94–95) were calculated to statistically determine the significance level of DIF.
Step Threshold (Fj) Equivalence
To make quantitative comparisons, it is essential to establish cross-category equivalence of the same questionnaire to facilitate an unbiased comparison, if one or the other response category was chosen for data collection. Comparability between the two sets of item step thresholds was evaluated by investigating response category curves.
Overall Test Information
When two or more different rating scales are used to collect information using the same set of questions, it is also important to compare the scales in terms of their measurement precision along the continuum being measured. This can be evaluated by comparing “test information curves,” generally bell-shaped, at any given level of fatigue. The amount of information (I) provided by a set of items at any given level of fatigue is inversely related to the standard error (SE) of the fatigue measure estimate at that level (I(Bn) = [1/SE(Bn)]2). The smaller the standard error of measurement, the greater the precision of measurement, or “test information.”
RESULTS
Person Fatigue Measure (Bn) Equivalence
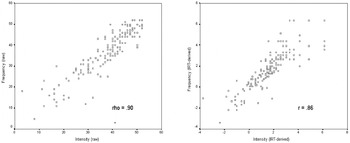
Using the rating scale model, two sets of person fatigue measures from the “intensity” and “frequency” response scales and two sets of raw fatigue scores (summation of response categories) were obtained for comparison. There was a very high correlation between the two raw scores (Spearman's rho = .90, p < .001). There was also a very high correlation between transformed interval-level fatigue measures using the two different rating scales (Pearson's r = .86, p < .001). These relationships are depicted in Figure 1.

Scatter plots of raw and IRT-derived scores for the two rating scales.
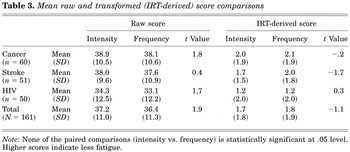
Table 3 further shows that average fatigue scores were comparable across response scales, for both raw scores and transformed interval scores (paired t tests not significant).
Mean raw and transformed (IRT-derived) score comparisons

Item Location (Di) Equivalence
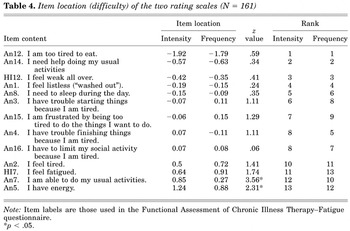
Item difficulties for the two response categories are listed in Table 4, and Figure 2 further depicts the relationship between the two sets of item difficulties. The Pearson's correlation between the two sets of item locations for the combined samples (n = 161) was .95 (p < .001) indicating substantial equivalence. Figure 2 and the z statistics in Table 4 show that two items displayed differential item functioning (DIF): An7 (“I am able to do my usual activities”) and An5 (“I have energy”). It is noteworthy that these two questions are also the only two of the 13-item scale that are worded in a positive direction.
Item location (difficulty) of the two rating scales (N = 161)


Detecting differential item functioning.
Step Threshold (Fj) Equivalence
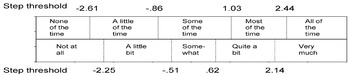
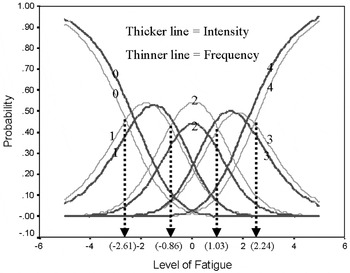
Figure 3 displays the steps thresholds of the two response scales. As predicted by the measurement model, there was no step misorder, meaning that the step measures increase from less to more corresponding to the increase in intensity or frequency for the total sample. Response category curves in Figure 4 further depict this relationship. The patterns for each set of response scales look similar along the measurement continuum (level of fatigue). However, the spread of the step measures of frequency response scale is more equidistant and a bit wider (from −2.61 to 2.44 logits) than the intensity response scale (from −2.25 to 2.14 logits).

Coverage of the fatigue measurement continuum: intensity versus frequency versus intensity. Step threshold = estimated parameter from the rating scale model based on 13 fatigue item responses. This equals the point on the fatigue measurement continuum where the probability of endorsing the lower category to any and all items equals that of endorsing the higher category.

Response category curve by intensity and frequency response scale. All step thresholds from Figure 3 can be “traced” to the x-axis as illustrated by the tracing of the “not at all” step which corresponds to the level of fatigue where the probability of endorsing “not at all” is equal to that of endorsing “a little bit.” 0 = “Not at all” for intensity (“None of the time” for frequency); 1 = “A little bit” (“A little of the time”); 2 = “Somewhat” (“Some of the time”); 3 = “Quite a bit” (“Most of the time”); 4 = “Very much” (“All of the time”).
Overall Test Information
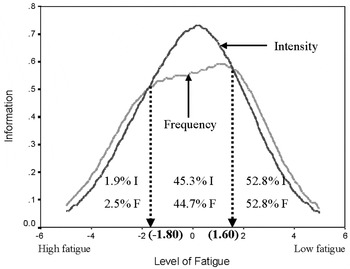
Figure 5 depicts the two test information curves for the same 13 fatigue items using the intensity and frequency response scales. “Test information” peaks with reduction in measurement error, reflecting more precise measurement. Thus, the higher the curve at any given vertical plane, the better the measurement. Therefore, one can conclude from Figure 5 that the intensity response scale provides greater information (more precision) within the −1.80 to +1.60 range when measuring fatigue, where about 45% of patients fall. But the frequency response scale shows measurement precision better than the intensity scale at any given level of continuum outside that range (−1.80,+1.60), where about 55% (2.5% + 52.8%) of patients fall.

Test information of the 13 fatigue items by response scale. I = Intensity rating; F = Frequency rating. “Information” (y-axis) = the amount of information provided by a set of items at any given level of fatigue. This is calculated as [1/(standard error of measurement)]2. Intersections (−1.80) and (1.60) are the points along the level of fatigue continuum where items using either intensity or frequency response scale yield the same precision of measurement. 1.9% and 2.5% of people fall below the (−1.80) cutoff using intensity and frequency response scale, respectively. A total of 45.3% and 44.7% people fall within the (−1.80, 1.60) range using intensity and frequency response scale, respectively. A total of 52.8% people fall above the (1.60) cutoff for both rating scales.
DISCUSSION
Patient fatigue scores (both raw and IRT-derived) are highly correlated regardless of whether patients rate intensity or frequency. The hierarchical structure (order of item locations) of the 13 fatigue items is very similar for both scales. Differential item functioning analysis revealed that two items displayed DIF across the two rating scales. They both were positively worded, as opposed to the other 11 negatively phrased questions, and were positioned at the extreme (positive) end of fatigue measurement. The ordering of the step thresholds between the two scales was similar (but not identical), and the correlation between the two sets of step thresholds was high.
These results suggest that there is little difference in the use of fatigue items utilizing response categories that assess intensity or frequency of fatigue symptoms. This finding should reassure those who doubt that a single rating scale for a symptom is enough assessment to characterize a group of patients. Whether this holds true for other symptoms commonly measured in chronic illness remains to be determined.
One interesting finding is that the use of an intensity response scale provides more precision (less error) in measuring fatigue at the middle range. However, when measuring people at the high and low extreme of fatigue, test information was superior using frequency ratings. This is particularly true for the majority (53%) of patients that had relatively less fatigue. Thus, frequency scaling may have the advantage of differentiating people better when measuring people with comparatively low level of fatigue. Intensity scaling, however, may be superior for more symptomatic patients. A similar finding with the Medical Outcome Study suggested that frequency ratings may be more sensitive to measurement distinctiveness at the ceiling (extreme good health) end of the continuum (Hays et al., 1994; Stewart & Ware, 1992).
The distinction between intensity and frequency scaling is relevant to clinical care. It is not of much clinical concern if a patient has mild fatigue only occasionally, while mild fatigue “all of the time” can have a dramatic impact on function. An intensity scaling approach would classify such a person on the relatively healthy end of the continuum with constant mild fatigue, whereas frequency scaling would suggest more concern. On the other hand, a person who has severe fatigue, but only occasionally, could be classified as very impaired with an intensity scale, yet less so with a frequency scale. The high correlation coefficient between rating scales in this study suggests that such disparities rarely occur. However, when they do, intensity scaling maybe be preferable for more symptomatic patients, whereas frequency scaling maybe preferred for less symptomatic patients (as well as small fraction of patients at the symptomatic extreme, or floor of measurement).
Should both intensity and frequency therefore be used? Probably not, as there was far more evidence for equivalence than distinction, and the burden on the patient must be considered. It can also be argued that a good clinical assessment of fatigue would include not only frequency and intensity, but duration over time (chronicity). However, outside of the individual clinical assessment situation, asking about more than one component of fatigue is difficult to justify in light of these results. The generalizability of these results with symptoms other than fatigue needs to be empirically determined. For example, fatigue tends to be an ongoing and chronic symptom in many chronically ill populations (Coons & Kaplan, 1992; Smets et al., 1995; Cella, 1998; Cella et al., 2001, 2002), whereas other symptoms may be more acute and episodic and/or distinctively tied to treatment (i.e., a side effect, such as nausea). In these cases, frequency and intensity may be more distinguishable aspects of the symptom. Comparable studies in other symptoms can shed light upon this question in other symptoms.
Future research can also collect data from different patient populations and evaluate its generalizability beyond patients diagnosed with cancer, stroke, and HIV disease. Responsiveness to change as a function of rating scale might also be a fruitful avenue for future study.
ACKNOWLEDGMENTS
The study is supported in part by the National Cancer Institute Grant Number CA60068.
References
REFERENCES
Andrich, D.
(1978a).
Application of a psychometric rating model to ordered categories
which are scored with successive integers.
Applied Psychological Measurement,
2,
581–594.Google Scholar
Andrich, D.
(1978b).
Scaling attitude items constructed and scored in the Likert
tradition.
Educational and Psychological Measurement,
38,
665–680.Google Scholar
Andrich, D.
(1978c).
A rating formulation for ordered response categories.
Psychometrika,
43,
561–573.Google Scholar
Cella, D.
(1997).
The Functional Assessment of Cancer Therapy-Anemia (FACT-An) Scale:
A new tool for the assessment of outcomes in cancer anemia and fatigue.
Seminars in Hematology,
34(Suppl.),
13–19.Google Scholar
Cella, D.
(1998).
Factors influencing quality of life in cancer patients: Anemia and
fatigue.
Seminars in Oncology,
25,
43–46.Google Scholar
Cella, D.,
Davis, K.,
Breitbart, W., &
Kurt, G.
(2001).
Cancer-related fatigue: Prevalence of proposed diagnostic criteria
in a United States sample of cancer survivors.
Journal of Clinical Oncology,
19,
3385–3391.Google Scholar
Cella, D.,
Lai, J.-S.,
Chang, C.-H.,
Peterman, A., &
Slavin, M.
(2002).
Fatigue in cancer patients compared to that of the general United
States population.
Cancer,
94(2),
528–538.Google Scholar
Coons, S.J. &
Kaplan, R.M.
(1992).
Assessing health-related quality of life: Application to drug
therapy.
Clinical Therapeutics,
14,
850–858.Google Scholar
Curt, G.A.,
Breitbart, W.,
Cella, D.,
Groopman, J.E.,
Horning, S.J.,
Itri, L.M.,
Johnson, D.H.,
Miaskowski, C.,
Scherr, S.L.,
Portenoy, R.K., &
Vogelzang, N.J.
(2000).
Impact of cancer-related fatigue on the lives of patients: New
findings from the Fatigue Coalition.
Oncologist,
5(5),
353–360.CrossRefGoogle Scholar
Hann, D.M.,
Jacobsen, P.B.,
Azzarello, L.M.,
Martin, S.C.,
Curran, S.L.,
Fields, K.K.,
Greenberg, H., &
Lyman, G.
(1998).
Measurement of fatigue in cancer patients: Development and
validation of the Fatigue Symptom Inventory.
Quality of Life Research,
7,
301–310.Google Scholar
Hays, D.,
Sherbourne, C.D., &
Mazel, R.M.
(1995).
User's manual for the Medical Outcomes Study (MOS) core measures
of health-related quality of life.
Santa Monica, CA:
RAND.
Hays, R.D.,
Bell, R.M.,
Damush, T.,
Hill, L.,
DiMatteo, M.R., &
Marshall, G.N.
(1994).
Do response options influence alcohol use self-reports by college
students?
International Journal of Addictions,
29(14),
1909–1920.Google Scholar
Kong, S.X. &
Gandhi, S.K.
(1997).
Methodological assessments of quality of life measures in clinical
trials.
Annals of Pharmacotherapy,
31,
830–836.Google Scholar
Krupp, L.B.,
LaRocca, N.G.,
Muir-Nash, J., &
Steinberg, A.D.
(1989).
The fatigue severity scale.
Archives of Neurology,
46,
1121–1123.Google Scholar
Linacre, J.M. &
Wright, B.D.
(2001).
WINSTEPS Rasch model computer program.
Chicago:
MESA Press.
MacKeigan, L.D. &
Pathak, D.S.
(1992).
Overview of health-related quality of life measures.
American Journal of Hospital Pharmacy,
49,
2236–2245.Google Scholar
McNair, D.M.,
Lorr, M., &
Droppleman, L.F.
(1971).
EdITS manual for the profile of mood states.
San Diego, CA:
Educational and Industrial Testing Service.
Mendoza, T.R.,
Wang, X.S.,
Cleeland, C.S.,
Morrissey, M.,
Johnson, B.A.,
Wendt, J.K., &
Huber, S.L.
(1999).
The rapid assessment of fatigue severity in cancer patients: Use of
the Brief Fatigue Inventory.
Cancer,
85,
1186–1196.Google Scholar
Piper, B.F.,
Dibble, S.L.,
Dodd, M.J.,
Weiss, M.C.,
Slaughter, R.E., &
Paul, S.M.
(1998).
The revised Piper Fatigue Scale: Psychometric evaluation in women
with breast cancer.
Oncology Nursing Forum,
25,
677–684.Google Scholar
Schwartz, A.L.
(1998).
The Schwartz Cancer Fatigue Scale: Testing reliability and validity.
Oncology Nursing Forum,
25,
711–717.Google Scholar
Schwartz, A. &
Meek, P.
(1999).
Additional construct validity of the Schwartz Cancer Fatigue Scale.
Journal of Nursing Measurement,
7,
35–45.Google Scholar
Smets, E.M.,
Garssen, B.,
Bonke, B., &
de Haes, J.C.
(1995).
The Multidimensional Fatigue Inventory (MFI): Psychometric
qualities of an instrument to assess fatigue.
Journal of Psychosomatic Research,
39,
315–325.CrossRefGoogle Scholar
Stein, K.D.,
Martin, S.C.,
Hann, D.M., &
Jacobsen, P.B.
(1998).
A multidimensional measure of fatigue for use with cancer patients.
Cancer Practice,
6,
143–152.CrossRefGoogle Scholar
Stewart, A.L. &
Ware, J.E., Jr.
(1992).
Measuring Functioning and Well-being: The Medical Outcomes Study
Approach.
Durham, NC:
Duke University Press.
Stone, P.,
Hardy, J.,
Huddart, R.,
A'Hern, R., &
Richards, M.
(2000).
Fatigue in patients with prostate cancer receiving hormone therapy.
European Journal of Cancer,
36(9),
1134–1141.Google Scholar
Vogelzang, N.J.,
Breitbart, W.,
Cella, D.,
Curt, G.A.,
Groopman, J.E.,
Horning, S.J.,
Itri, L.M.,
Johnson, D.H.,
Scherr, S.L., &
Portenoy, R.K.
(1997).
Patient, caregiver, and oncologist perceptions of cancer-related
fatigue: Results of a tripart assessment survey; The Fatigue
Coalition.
Seminars in Hematology,
34,
4–12.Google Scholar
Wright, B.D. &
Stone, M.H.
(1979).
Best Test Design.
Chicago:
MESA Press.
Yellen, S.B.,
Cella, D.,
Webster, K.,
Blendowski, C., &
Kaplan, E.
(1997).
Measuring fatigue and other anemia-related symptoms with the
Functional Assessment of Cancer Therapy (FACT) measurement system.
Journal of Pain and Symptom Management,
13,
63–74.CrossRefGoogle Scholar
Properties of commonly used fatigue instruments
Sociodemographic and clinical characteristics of patients (N = 161)
Scatter plots of raw and IRT-derived scores for the two rating scales.
Mean raw and transformed (IRT-derived) score comparisons
Item location (difficulty) of the two rating scales (N = 161)
Detecting differential item functioning.
Coverage of the fatigue measurement continuum: intensity versus frequency versus intensity. Step threshold = estimated parameter from the rating scale model based on 13 fatigue item responses. This equals the point on the fatigue measurement continuum where the probability of endorsing the lower category to any and all items equals that of endorsing the higher category.
Response category curve by intensity and frequency response scale. All step thresholds from Figure 3 can be “traced” to the x-axis as illustrated by the tracing of the “not at all” step which corresponds to the level of fatigue where the probability of endorsing “not at all” is equal to that of endorsing “a little bit.” 0 = “Not at all” for intensity (“None of the time” for frequency); 1 = “A little bit” (“A little of the time”); 2 = “Somewhat” (“Some of the time”); 3 = “Quite a bit” (“Most of the time”); 4 = “Very much” (“All of the time”).
Test information of the 13 fatigue items by response scale. I = Intensity rating; F = Frequency rating. “Information” (y-axis) = the amount of information provided by a set of items at any given level of fatigue. This is calculated as [1/(standard error of measurement)]2. Intersections (−1.80) and (1.60) are the points along the level of fatigue continuum where items using either intensity or frequency response scale yield the same precision of measurement. 1.9% and 2.5% of people fall below the (−1.80) cutoff using intensity and frequency response scale, respectively. A total of 45.3% and 44.7% people fall within the (−1.80, 1.60) range using intensity and frequency response scale, respectively. A total of 52.8% people fall above the (1.60) cutoff for both rating scales.
 You have
Access
- 35
- Cited by