1 Introduction
Magnetic reconnection is a well-known high-temperature particle acceleration process in both laboratory (e.g. Ji et al. Reference Ji, Alt, Antiochos, Baalrud, Bale, Bellan, Begelman, Beresnyak, Blackman and Brennan2019) and astrophysical plasmas (e.g. Wyper, Antiochos & DeVore Reference Wyper, Antiochos and DeVore2017). While the two-dimensional (2-D) model of reconnection of merging anti-parallel flux ropes has been well explored experimentally (e.g. Ji et al. Reference Ji, Yamada, Hsu and Kulsrud1998), there are far more complex 3-D magnetic topologies that occur in Nature (e.g. Mason, Antiochos & Viall Reference Mason, Antiochos and Viall2019). A deeper understanding of the magnetic reconnection process as a whole will benefit from new experimental set-ups exploring these more complex, fully 3-D models of magnetic reconnection (e.g. Parnell et al. Reference Parnell, Neukirch, Smith and Priest1997; Priest & Pontin Reference Priest and Pontin2009). It is well known that 3-D null point reconnection is a nearly ubiquitous process in the solar atmosphere (Longcope & Parnell Reference Longcope and Parnell2009; Pontin Reference Pontin2012; Pontin, Priest & Galsgaard Reference Pontin, Priest and Galsgaard2013; Edwards & Parnell Reference Edwards and Parnell2015; Pallister, Pontin & Wyper Reference Pallister, Pontin and Wyper2019) with new observations demonstrating their significant contributions to the solar wind budget (Mason et al. Reference Mason, Antiochos and Viall2019; Mason, Antiochos & Vourlidas Reference Mason, Antiochos and Vourlidas2021). These observed 3-D null point topologies typically follow the fan-spine topology (figure 1a), where a 2-D radial fan plane of magnetic field lines converges upon a central null point and collimates along a 1-D, bi-directional spine axis perpendicular to the fan (Parnell et al. Reference Parnell, Smith, Neukirch and Priest1996, Reference Parnell, Neukirch, Smith and Priest1997). In the solar atmosphere, the fan plane is line tied to the photospheric network and the spine axis extends into the corona (Pontin et al. Reference Pontin, Priest and Galsgaard2013). It will be a benefit to both the laboratory and astrophysical plasma communities investigating these topologies to investigate feasible particle acceleration profiles in experimental set-ups designed to induce reconnection in these imposed geometries.
(a) Generalized geometry of a radial 3-D null point with magnetic field lines of a 2-D fan plane converging toward a null point and collimating into a 1-D spine axis. (b) A rotational perturbation localized to the fan plane and centred around the null point in the presence of plasma leads to the torsional spine magnetic reconnection mode (Pontin & Galsgaard Reference Pontin and Galsgaard2007; Pontin, Al-Hachami & Galsgaard Reference Pontin, Al-Hachami and Galsgaard2011; Chesny et al. Reference Chesny, Orange, Oluseyi and Valletta2017). The maximum magnetic perturbation curvature occurs at a radius of $[r, \theta, \phi ] = [\sqrt {2}, 0, 0]$ as calculated from (2.2).

Currently, there are three known modes of driven magnetic reconnection about a 3-D null point fan-spine topology: torsional fan, torsional spine and spine fan (Priest & Pontin Reference Priest and Pontin2009; Pontin Reference Pontin2011, Reference Pontin2012). Torsional fan reconnection (TFR) is characterized by a rotational perturbation to the spine axis resulting in a fan-aligned current sheet, whereas torsional spine reconnection (TSR) features a rotational perturbation to the fan plane (figure 1b) resulting in a spine-aligned current sheet (Pontin, Hornig & Priest Reference Pontin, Hornig and Priest2004, Reference Pontin, Hornig and Priest2005; Pontin & Galsgaard Reference Pontin and Galsgaard2007; Pontin et al. Reference Pontin, Al-Hachami and Galsgaard2011). A cross-planar rotational perturbation bending the spine axis toward the fan plane leads to the spine-fan reconnection mode (Thurgood, Pontin & McLaughlin Reference Thurgood, Pontin and McLaughlin2017), but lacks a self-consistent model of the resulting electric and magnetic fields (see below). One way of investigating particle acceleration from torsional reconnection modes at laboratory scales is with relativistic particle tracking simulations combined with self-consistent theoretical models of the resulting electromagnetic fields. Both TFR and TSR modes benefit from such magnetohydrodynamic (MHD) models (Wyper & Jain Reference Wyper and Jain2010, Reference Wyper and Jain2011). Using such 3-D null point fan-spine topology numerical models, previous authors have investigated ion responses at solar coronal scales (Dalla & Browning Reference Dalla and Browning2005, Reference Dalla and Browning2006, Reference Dalla and Browning2008; Stanier, Browning & Dalla Reference Stanier, Browning and Dalla2012; Hosseinpour Reference Hosseinpour2014a; Hosseinpour, Mehdizade & Mohammadi Reference Hosseinpour, Mehdizade and Mohammadi2014; Hosseinpour Reference Hosseinpour2014b, Reference Hosseinpour2015). These numerical tools have recently led to investigating similar plasma responses to laboratory scaling parameter inputs to the TFR mode (Chesny, Orange & Hatfield Reference Chesny, Orange and Hatfield2021b). The results of this study showed that accelerated plasma jets ($\sim$ keV-level) are feasible in future experimental set-ups. Thus, it is of use to expand on this architecture to investigate laboratory-scale particle acceleration resulting from the torsional spine mode.
This paper extends the numerical infrastructures of Chesny et al. (Reference Chesny, Orange and Hatfield2021b) and Chesny et al. (Reference Chesny, Orange, Oluseyi and Valletta2017) to solve the torsional spine mode via solutions to the steady-state, resistive, kinematic (MHD) equations (Wyper & Jain Reference Wyper and Jain2011). The comprehensive computational routine of this infrastructure and the release of ions into these electric and magnetic fields is described in § 2. Plasma parameter scaling to typical laboratory inputs is outlined in § 2.3. Results of the relativistic particle tracking simulations are shown in § 3. We discuss our results in § 4 and conclude in § 5.
2 Computational routine
All routines were written in Python using standard NumPy and SciPy packages. Three-dimensional visualizations are created using the Matplotlib package.
2.1 Field structure
We use the 3-D magnetic field and electric potential solutions to the steady-state, kinematic, resistive MHD equations given by Wyper & Jain (Reference Wyper and Jain2010) and Wyper & Jain (Reference Wyper and Jain2011). In the torsional spine case, the twist in the magnetic field is localized to the fan plane and centred about the null point (figure 1b). All field structures are given in cylindrical coordinates $[r, \theta, z]$ . The torsional spine magnetic field is of the form

with distances scaled to a characteristic length $L_{0}$ (Chesny & Orange Reference Chesny and Orange2020; Chesny, Orange & Dempsey Reference Chesny, Orange and Dempsey2021a; Chesny et al. Reference Chesny, Orange and Hatfield2021b). The free parameters, $j$
 , $l$
 and $c$
 govern the degree and spatial extent of the twist, and $\alpha$
 and $\beta$
 are positive integers. Throughout this paper, we set $j = 3$
 , $\alpha = 4$
 , $l = 1$
 and $\beta = c = 0$
 , corresponding to a generic radial perturbation, and consistent with the TSR simulations of Hosseinpour et al. (Reference Hosseinpour, Mehdizade and Mohammadi2014) and Hosseinpour (Reference Hosseinpour2014b). Using these values, (2.1) reduces to

Figure 2(a,b) displays $XZ$ and $XY$
 streamlines of (2.2), with the distance scaled to a characteristic length (see below). The location of greatest twist is at the radial distance $R = \sqrt {2}$
 defined by setting ${\rm d}B_{\theta }/{\rm d}r = 0$
 in (2.2). To approximate a controlled injection of plasma, we apply a localized resistivity profile $\eta$
 depending only on radius $r$
 as

where $\eta _{0} = m_{e} \nu _{e,i} / n_{e} e^{2}$ is the plasma resistivity calculated from the characteristic parameters of electron mass $m_{e}$
 , electron–ion collision frequency $\nu _{e,i}$
 , electron number density $n_{e}$
 and the elementary charge $e$
 (see § 2.3). We set $\lambda = 2$
 to localize the resistivity profile to the radius $R = \sqrt {2}$
 of maximum magnetic field twist predicted by (2.2). This choice, as will be shown in § 2.3, inherently confines and localizes the injected plasma sheath to the region of stressed, non-potential magnetic field. This choice also satisfies the constraints for realistic solutions when the sum of parameters $\alpha + \lambda \ge 4$
 and is even (Wyper & Jain Reference Wyper and Jain2011). The electric potential in TSR with the above resistivity profile is of the form

with the recurrence relation for $F(r, A)$ being

and solutions for all values of $A$ found using the error function (erf) as

and

Vector field quantities of resistive TSR (Wyper & Jain Reference Wyper and Jain2010). The blue markers denote the radius of maximum magnetic perturbation curvature at $[r, \theta, \phi ] = [\sqrt {2}, 0, 0]$ . Panels show the (a) $XZ$
 magnetic field (Y=0), (b) $XY$
 magnetic field (Z=0), (c) $XZ$
 electric field (Y=0), (d) $XY$
 electric field (Z=0). (e) $XZ$
 drift velocity (Y=0) computed from $\boldsymbol {E} \times \boldsymbol {B}$
 , (f) $XY$
 drift velocity (Z=0).

As in Wyper & Jain (Reference Wyper and Jain2011), the initial electric potential $\varPhi _{0}$ is in units of volts and depends on the current density $j_{0}$
 and magnetic field as $\varPhi _{0} = j_{0} \eta _{0} B_{0}$
 (Wyper & Jain Reference Wyper and Jain2010; Chesny et al. Reference Chesny, Orange and Hatfield2021b). The electric field can then be derived using $\boldsymbol {E} = - \boldsymbol {\nabla } \varPhi$
 . Using our numerical parameters, these equations reduce to

and in cylindrical units $[r, \theta, z]$

Figure 2 displays cross-sections of the vector fields of the torsional spine magnetic field ((a,b), (2.2)), electric field ((c,d), derived from (2.8)) and the drift velocity ((e,f), (2.10)) calculated from

It is important to understand that, in torsional reconnection modes, we do not consider the particle dynamics close to the null point where $|B|=0$ and $v_{d} \approx 0$
 within which the gyroradius would be large. Vector maps of the drift velocity (figure 2e,f) demonstrate that $v_{d} \rightarrow 0$
 close to the null, whereas significant magnitudes of $v_{d}$
 occur away from the null, which is where we consider particle dynamics and acceleration. Blue contours denote the radius of maximum perturbing magnetic field twist applied to the fan plane at $r = \sqrt {2}$
 . Figure 3 shows the scalar fields of electric potential ((a,b), (2.8)), and plasma resistivity profile ((c,d), (2.3)) localized to the region of maximum magnetic twist. The localized resistivity profile demonstrates the spine-aligned, tubular current sheet of the TSR mode (Pontin & Galsgaard Reference Pontin and Galsgaard2007).
Scalar field quantities of resistive TSR (Wyper & Jain Reference Wyper and Jain2010). The blue markers denote the radius of maximum magnetic perturbation curvature at $[r, \theta, \phi ] = [\sqrt {2}, 0, 0]$ . Panels show (a) $XZ$
 electric potential (Y=0), (b) $XY$
 electric potential (Z=0), (c) $XZ$
 resistivity (Y=0), (d) $XY$
 resistivity (Z=0).

The time-dependent dynamics leading to the breakdown of ideal MHD conditions and the slipping of stressed magnetic field lines through the plasma to generate the electric potential, electric field and resistivity profiles of figures 2 and 3 are details that have been explored by the resistive MHD simulations of Pontin et al. (Reference Pontin, Al-Hachami and Galsgaard2011) and Pontin & Galsgaard (Reference Pontin and Galsgaard2007), while the equations of § 2.1 are solutions assuming that torsional reconnection has already occurred (Wyper & Jain Reference Wyper and Jain2010, Reference Wyper and Jain2011). Therefore, it is of interest to the experimental plasma physics community as to how to set up and initiate these conditions in a laboratory setting. Section 2.3 introduces one possible method by which the initial global magnetic field and a plasma with an embedded magnetic field can superimpose to form the general TSR magnetic field of figures 1(b) and 2(a,b), consistent with the laboratory TFR parameters of Chesny et al. (Reference Chesny, Orange and Hatfield2021b). While this manuscript is focused on addressing the efficacy of TSR as a particle accelerator under typical laboratory settings, the time-dependent plasma and magnetic field dynamics of scaled laboratory hardware component models are left for more advanced simulation methods, including particle-in-cell (PIC).
2.2 Particle trajectories
Particle trajectories are computed using the relativistic equations of motion for velocity and the Lorentz force in a collisional plasma, respectively,


In these equations, $\boldsymbol {p}$ is momentum, $\boldsymbol {r}$
 is the 3-D Cartesian position, $\gamma = (1 - \boldsymbol {p} \boldsymbol {\cdot } \boldsymbol {p} )^{-1/2}$
 is the relativistic Lorentz factor, $e$
 is the charge of a singly ionized particle, $A$
 is the atomic mass, $m_{p}$
 is the proton rest mass in MeV c$^{-2}$
 and $\nu _{in}$
 is the ion–neutral collision frequency (see below). Equations (2.11) and (2.12) can be solved in dimensionless form by defining the following characteristic relations:

where $\boldsymbol {x}$ is a 3-D position unit vector, $\boldsymbol {n}$
 is a unit vector in the direction of motion, $\boldsymbol {b}$
 is a unit vector defining the local magnetic field direction and the time step $t^{\prime }$
 is scaled to the characteristic non-relativistic gyroperiod $\tau _{0} = 2 {\rm \pi}m_{0} / e B_{0}$
 (Dalla & Browning Reference Dalla and Browning2005, Reference Dalla and Browning2006, Reference Dalla and Browning2008). Using these relations, the dimensionless equation of motions for velocity and the Lorentz force can be written as respectively,


with the unitless velocity, electric field and collisional constants represented as, respectively,

and $|c| = 3\times 10^{8}$ is the magnitude of the speed of light in m s$^{-1}$
 . The initial momentum $p_{0}$
 in MeV c$^{-1}$
 is calculated from the initial particle kinetic energy $K_{0}$
 in eV as $p_{0} = (K_{0}^{2} + 2 A m_{p} K_{0} )^{1/2}$
 . Our choices of $L_{0}$
 and $B_{0}$
 will be described in § 2.3.
Since full orbit particle tracing in plasmas is not limited by inelastic collisions (e.g. Marchand Reference Marchand2010; Homma et al. Reference Homma, Hoshino, Tokunaga, Yamoto, Hatayama, Asakura, Sakamoto and Tobita2018), the effects of collisions are accounted for in the final term on the right-hand side of (2.12). The addition of this collisional term has been shown to be effective in particle tracking studies of magnetic reconnection in high density laser plasmas up to ${\sim }10^{25}$ m$^{-3}$
 (Zhong et al. Reference Zhong, Lin, Li, Wang, Li, Zhang, Yuan, Ping, Wei and Wang2016). The magnitude of the collision frequency is solved from the plasma parameters in § 2.3. Most laboratory plasmas are weakly ionized, where the degree of ionization is dependent on the ion ($n_{i}$
 ) and neutral gas ($n_{g}$
 ) number densities $\chi = n_{i} / ( n_{g} + n_{i} )$
 and $\chi \ll 1$
 . Weakly ionized plasmas are further defined by the electron–ion collision frequency $\nu _{ei}$
 being less than the electron–neutral collision frequency $\nu _{en}$
 ($\nu _{ei} < \nu _{en}$
 ; Park et al. Reference Park, Choe, Moon and Yoo2019). In the case of low-energy electrons (a few eV), the main collisional process in a weakly ionized plasma is dominated by polarization scattering of ions against ambient neutral particles $\nu _{in}$
 (Lieberman & Lichtenberg Reference Lieberman and Lichtenberg2005). Electron and ion polarization scattering rate constants in units of cm$^{3}$
 s$^{-1}$
 are calculated from

and

respectively, where $\alpha _{R}$ is the species-dependent relative polarizability ($\alpha _{R, He} = 1.384$
 for helium; Schwerdtfeger & Nagle Reference Schwerdtfeger and Nagle2019). The charged particle collision frequencies against neutrals are then calculated using

Parameters using typical laboratory values given in table 1 demonstrate numerically that the chosen helium plasma is weakly ionized ($\chi = 1$ % and $\nu _{ei} < \nu _{en}$
 ) and polarization scattering is the dominant collisional process. We note that (2.19) is independent of the background ion temperature of the plasma and that temperature-dependent collision frequencies are left for more advanced plasma simulation beyond particle tracking, such as PIC. In fact, considering the temperature-independent collision frequency as in this work may represent the worst-case scenario for particle acceleration, since particles with higher kinetic energies have a larger mean free path between collisions. In the TSR case here, and in the TFR case of Chesny et al. (Reference Chesny, Orange and Hatfield2021b), the final particle temperatures could actually become substantially higher by considering a temperature-dependent collision frequency.
Laboratory parameters used for the CPG helium plasma regime. The model assumes a capacitor bank discharge of 6 kV over 10 cm ($E=60$ kV m$^{-1}$
 ) (Chesny et al. Reference Chesny, Orange and Hatfield2021b).

The dimensionless equations (2.14) and (2.15) are solved numerically using the scipy.integrate.odeint package which uses LSODA from the FORTRAN library to dynamically monitor data and reduce errors by automatically switching between stiff and non-stiff methods. Numerical validation of this routine first verified the relativistic ion gyro-radius $r_{g,i} = \gamma A m_{p} v_{\bot } / e B$ within uniform magnetic fields ($\boldsymbol {E} = 0$
 V m$^{-1}$
 ). Then, summing the kinetic and electric potential energies throughout test runs with collisionless single particle trajectories when $\boldsymbol {E} \neq 0$
 V m$^{-1}$
 demonstrated total energy conservation to five significant figures, of the order of $0.1$
 eV, using (Dalla & Browning Reference Dalla and Browning2005, Reference Dalla and Browning2006, Reference Dalla and Browning2008; Gascoyne Reference Gascoyne2015)

Monitoring the total energy in the collisional plasma regime will elucidate the energy loss and energy loss rate due to collisions and scattering during TSR.
2.3 Laboratory plasma scaling parameters and particle injection
In our simulations, the laboratory plasma parameter space follows the typical profile of a coaxial plasma gun (CPG; Marshall Reference Marshall1960), which is a common plasma generation device across a range of fields from plasma jet magneto-inertial fusion (PJMIF, e.g. Yates et al. Reference Yates, Langendorf, Hsu, Dunn, Brockington, Case, Cruz, Witherspoon, Thio and Cassibry2020) to in-space electric propulsion. Previous numerical investigations of torsional reconnection (Chesny et al. Reference Chesny, Orange, Oluseyi and Valletta2017, Reference Chesny, Orange and Hatfield2021b) also used CPG plasma sheath parameters to investigate feasible experimental particle acceleration by exploiting their general azimuthal magnetic field profile as a source of magnetic field twist (2.2). The CPGs are cylindrically symmetric, pulse power devices consisting of a central anode rod surrounded by an annular outer electrode and separated by an insulator (e.g. Larson, Liebing & Dethlefsen Reference Larson, Liebing and Dethlefsen1966; Witherspoon et al. Reference Witherspoon, Case, Messer, Bomgardner, Phillips, Brockington and Elton2009; Subramaniam & Raja Reference Subramaniam and Raja2017). The CPG plasma profiles follow the snowplough model in which a capacitor bank discharge forms a thin plasma sheath along the insulator that then propagates down the electrodes due to the self $\boldsymbol {J} \times \boldsymbol {B}$ force (e.g. Hart Reference Hart1964; Lee & Serban Reference Lee and Serban1996; Gonzalez et al. Reference Gonzalez, Clausse, Bruzzone and Florido2004). This CPG is theorized to be located within a global fan-spine magnetic field, as enabled by conventional pulse power conducting coil technology (Chesny et al. Reference Chesny, Orange and Dempsey2021a, Reference Chesny, Moffett, Cole, Baptiste and Orange2022a), centred at the null point, and axially aligned with the spine axis.
In this study, individual particle injection positions vary radially due to the localized perturbation in the fan plane taken to be the embedded azimuthal magnetic field of a CPG-based plasma sheath (Moffett et al. Reference Moffett, Chesny, Cole, Hatfield and Rusovici2022). Due to the drift velocity calculations shown in figure 2(e), the only asymmetry in the axial vector components occur within the cylindrical $r = \pm L_{0}$ boundary and point in the $-Z$
 direction only. Thus, we inject each particle with an identical initial momenta in the $-Z$
 direction (kinetic energy $K_{0} = 10$
 eV; e.g. Schaer Reference Schaer1994; Chesny et al. Reference Chesny, Orange and Hatfield2021b). This approximates to the bulk plasma velocity of a CPG-based sheath due to the $\boldsymbol {J} \times \boldsymbol {B}$
 force in the snowplough mode (e.g. Kwek, Tou & Lee Reference Kwek, Tou and Lee1990). The authors note that other pitch angles, including along $+Z$
 , were attempted and which demonstrated that peak morphological behaviour and peak kinetic energy gain are invariant. Thus, the choice of displaying solutions to $-Z$
 injection presents no loss of generality. Due to the cylindrical symmetry of (2.2) and (2.9), we solved for individual particle trajectories at five representative input radii along the $x$
 axis $r_{x} = [ 0.50 \sqrt {2}, 0.75 \sqrt {2}, \sqrt {2}, 1.25 \sqrt {2}, 1.50 \sqrt {2} ]$
 . In § 3, we divide the results into three representative ‘regions:’ region 1 ($r < \sqrt {2} L_{0}$
 ), region 2 ($r = \sqrt {2} L_{0}$
 ) and region 3 ($r > \sqrt {2} L_{0}$
 ). This choice of three representative regions showing five discrete trajectories, similar to the analyses of Hosseinpour (Reference Hosseinpour2014a,Reference Hosseinpourb, Reference Hosseinpour2015) and Hosseinpour et al. (Reference Hosseinpour, Mehdizade and Mohammadi2014) at solar scales rather than a bulk particle input (Dalla & Browning Reference Dalla and Browning2005, Reference Dalla and Browning2006, Reference Dalla and Browning2008; Chesny et al. Reference Chesny, Orange and Hatfield2021b), is necessary due to the dynamics of collisional energy losses. It was found that the particles injected into different regions required different total simulation times to properly diagnose the energy balance. Regardless, we will discuss in § 4 how bulk particle behaviour can be inferred from these representative particles.
Table 1 shows the experimentally derived numerical input plasma parameters for our relativistic particle tracking algorithm. Following the TFR analysis of Chesny et al. (Reference Chesny, Orange and Hatfield2021b), the parameters of a 6 kV capacitive discharge over 10 cm using helium fuel (Schaer Reference Schaer1994) and a magnetic field strength of 1 T follow achievable experimental values (Chesny et al. Reference Chesny, Moffett, Cole, Baptiste and Orange2022a,Reference Chesny, Moffett, Hatfield, Cole, Landers, Shokrollahi and Egeb). These are the parameters used in the scalar and vector field plots in figures 2 and 3. By inspecting the drift velocity vector plots of figure 2(e,f), particle trajectory behaviour can be anticipated when the injection positions are considered. For region 1 ($r < \sqrt {2}$ ), particles should be accelerated in the $-Z$
 direction. The $XY$
 plane shows that the particles may be directed toward and rotationally around the central spine axis, and the $XZ$
 plane shows that the drift may rapidly end when the particles approach the spine axis before $Z \approx -1$
 . In region 2 ($r = \sqrt {2}$
 ), the drift velocity pushes out along the $XY$
 fan plane and down toward the fan in the $XZ$
 plane. In region 3 ($r > \sqrt {2}$
 ), the $XY$
 drift velocity seems to push particles out along the fan while still spiralling around the central spine axis. The $XZ$
 drift suggests an additional mild force along the $+Z$
 direction. The highest acceleration due to the peak drift velocity profile should occur with particles that enter the vicinity $x, z \approx [\pm 0.50, -0.50]$
 .
3 Results
Each discrete particle trajectory was solved for a sufficient time such that they reach their peak kinetic energy and subsequently lose a majority of their kinetic energy due to collisional dissipation. Considering particle injection regions 1, 2 and 3 about the peak perturbation radius $r = \sqrt {2} L_{0}$ will allow us to extrapolate bulk particle behaviour due to the cylindrical symmetry inherent in the system. All trajectory time steps were solved at $dt=0.001$
 to properly resolve their gyroradii. First, for region 1 containing the two inner particles at $r_{x} = [ 0.50 \sqrt {2}, 0.75 \sqrt {2} ]$
 , five characteristic times were solved (5$\tau _{0}$
 ), where $\tau \approx 0.26\,\mathrm {\mu }{\rm s}$
 is the ion gyroperiod (Chesny et al. Reference Chesny, Orange and Hatfield2021b). For region 2, in which the single particle is injected at the radius of maximum perturbation $r_{x} = [ \sqrt {2} ]$
 , thirty characteristic times were solved (30$\tau _{0}$
 ). Finally, in region 3 for the two outer particles at $r_{x} = [ 1.25 \sqrt {2}, 1.50 \sqrt {2} ]$
 , fifty characteristic times were solved ($50\tau _{0}$
 ).
3.1 Region 1 ($r < \sqrt {2} L_{0}$ )

Figure 4(a,b) shows the solved particle trajectories of the $r_{x} = [0.50 \sqrt {2}]$ case. Each trajectory is shown in colours blue to red, denoting the increasing time evolution, against black streamlines of the background 3-D null point fan-spine magnetic field topology. For the $r_{x} = [ 0.50 \sqrt {2} ]$
 injection radius, the particle is immediately accelerated inward along the fan plane toward the spine axis and tightly gyrates about the spine axis below the central null point. Figure 4(c,d) shows the energy budget evolution throughout its trajectory. The confinement behaviour is evident as the particle bounces about the null in the $XY$
 plane, with its peak kinetic energy $K = 2.89$
 keV occurring after 1294 time steps (of 5000 total time steps). The particle rapidly loses total and kinetic energy from collisional effects after being confined about the null point. Figure 4(e,f) tracks the momentum components $p_{\|} / p_{\bot }$
 and magnetic moment $\mu / \mu _{0}$
 ratios, which further elucidates possible mirroring or jet-like behaviour. The momentum ratio in figure 4(e) shows the lack of spine-aligned jet-like behaviour due to the ratio $p_{\|} / p_{\bot } \ll 1$
 during the later evolution of its trajectory after reaching its peak kinetic energy ($t = 1294$
 ). An evolution toward full mirroring behaviour, while seen by its tightening trajectory about the null point, is demonstrated by the ratio $\mu / \mu _{0}$
 approaching unity (i.e. conservation) by the time it loses all of its kinetic energy due to collisions.
Test particle results for region 1 ($r < \sqrt {2} L_{0}$ ) for injection position $[r, \theta, \phi ] = [0.50 \sqrt {2}, 0, 0]$
 . Particle trajectories are coloured going from blue to red in time. Background 3-D null point magnetic field lines are projected with black lines. Enlarged trajectories are shown in the inset boxes. Panels show (a) $XZ$
 with inset boundaries $(-0.20:0.70, -0.07:0.08)$
 and (b) $XY$
 trajectories with inset boundaries $(-0.20:0.70, -0.25:0.00)$
 , showing trapping about the null point. Time evolution of the (c) total energy and (d) kinetic energy only. The kinetic energy peak of 2.89 keV occurs at $t = 1294$
 . (e) Time evolution of the parallel-to-perpendicular momentum ratio $p_{\|} / p_{\bot }$
 and (f) magnetic moment ratio $\mu / \mu _{0}$
 .

As we move to the particle injected at $r_{x} = [ 0.75 \sqrt {2} ]$ , it begins to exhibit slight jet-like behaviour as it is accelerated toward the spine axis and also in the $-Z$
 direction to $Z \approx -1.00$
 (figure 5a,b). Its acceleration toward and along the spine axis takes more time as the particle reaches its peak kinetic energy $K = 2.02$
 keV after 2696 time steps (of 5000 total time steps, figure 5c,d). The particle takes over half of its total trajectory time to reach its peak kinetic energy before rapidly dissipating the energy through collisions. Figure 5(e,f) highlights the behaviour of this slight jet-like behaviour as its initially long-lived momentum ratio $p_{\|} / p_{\bot } > 1$
 and $\mu / \mu _{0}$
 ratio hovering around unity until $t \approx 2500$
 where both ratios greatly increase. Despite this particle losing energy while travelling along the spine axis, these results suggest that it ultimately escapes confinement about the magnetic null point as the limit of $\mu / \mu _{0}$
 settles above unity (i.e. conservation).
Test particle results for region 1 ($r < \sqrt {2} L_{0}$ ) for injection position $[r, \theta, \phi ] = [0.75 \sqrt {2}, 0, 0]$
 . Particle trajectories are coloured going from blue to red in time. Background 3-D null point magnetic field lines are projected with black lines. Enlarged trajectories are shown in the inset boxes. Panels show (a) $XZ$
 with inset boundaries $(-0.20:1.10, -1.00:0.00)$
 and (b) $XY$
 trajectories with inset boundaries $(-0.20:1.10, -0.20:0.20)$
 , showing trapping about the null point. Time evolution of the (c) total energy and (d) kinetic energy only. The kinetic energy peak of 2.02 keV occurs at $t = 2696$
 . (e) Time evolution of the parallel-to-perpendicular momentum ratio $p_{\|} / p_{\bot }$
 and (f) magnetic moment ratio $\mu / \mu _{0}$
 .

3.2 Region 2 ($r = \sqrt {2} L_{0}$)

When the particle injection radius reaches $r_{x} = \sqrt {2}$ at the location of maximum magnetic field twist (figure 6a,b), the qualitative formation of an extended jet along the spine axis is evident as the particle is accelerated to $Z \approx -3.00$
 . The particle also gyrates around the spine axis, as seen in the $XY$
 plane (figure 6b). It is key to note here that this particle simulation had to be carried out to 30 000 time steps to fully diagnose its dynamic behaviour. Figure 6(c,d), showing its energy budget evolution, denotes a peak kinetic energy of only $K = 350$
 eV after 13 138 time steps. Interestingly, each of the region 2 particles injected at smaller radii (figures 4 and 5) complete their full acceleration and dissipation profiles well before the $r_{x} = \sqrt {2}$
 particle is even accelerated to any significant level (see § 4). Figure 6(e,f) denotes long-lived jet-like behaviour from the evolution of both $p_{\|} / p_{\bot } > 1$
 and $\mu / \mu _{0} > 1$
 ratios up until the particle reaches its maximum kinetic energy. The strong peak of $p_{\|} / p_{\bot }$
 at $t \approx 9000$
 corresponds to the nearly vertical $-Z$
 path of the particle half-way through its qualitative trajectory (light blue-to-green). During the approximately first half of the particle trajectory $t \lesssim 15\,000$
 , the particle gyrates toward the spine axis along the fan plane. The jet-like behaviour is anticipated from $p_{\|} / p_{\bot } > 1$
 while its overall distance from the null point decreases, as seen by $\mu / \mu _{0} < 1$
 as $|\boldsymbol {B}|$
 decreases. The particle is then unconfined by the rapid transition $\mu / \mu _{0} > 1$
 (i.e. non-conserved magnetic moment) while the particle begins to rapidly lose energy due to collisions and $p_{\|} / p_{\bot } \approx 1$
 and decreasing $\mu / \mu _{0}$
 .
Test particle results for region 2 ($r = \sqrt {2} L_{0}$ ) for injection position $[r, \theta, \phi ] = [\sqrt {2}, 0, 0]$
 . Particle trajectories are coloured going from blue to red in time. Background 3-D null point magnetic field lines are projected with black lines. Panels show (a) $XZ$
 and (b) $XY$
 trajectory which shows acceleration downward and gyration around the $-Z$
 spine axis. Time evolution of the (c) total energy and (d) kinetic energy only. The kinetic energy peak of 0.35 keV occurs at $t = 13,138$
 . (e) Time evolution of the parallel-to-perpendicular momentum ratio $p_{\|} / p_{\bot }$
 and (f) magnetic moment ratio $\mu / \mu _{0}$
 .

3.3 Region 3 ($r > \sqrt {2} L_{0}$)

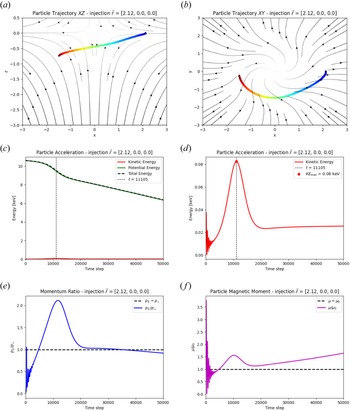
The particles injected at larger radii $r_{x} = [ 1.25 \sqrt {2}, 1.50 \sqrt {2} ]$ are shown in figures 7 and 8, respectively. Both particles exhibit similar qualitative trajectories where the accelerations force the particle into a wide orbit around the spine axis and they only reach peak heights less than $Z = -1.00$
 . Neither of the particles are accelerated to significant energies, $K \approx 55$
 eV for the $r_{x} = [ 1.25 \sqrt {2} ]$
 particle at around time step 9000, and $K = 80$
 eV for the $r_{x} = [ 1.50 \sqrt {2} ]$
 particle at time step 11,105. As seen from figure 7(c,d), the true peak kinetic energy occurs almost immediately after the injection ($t = 163$
 ), whereas the featured peak of the kinetic energy occurs later ($t \approx 9000$
 ). The inset of figure 7(d) shows the zoomed-in portion of this early trajectory evolution from time steps 0–2000, which shows still approximately the same peak kinetic energy ($K \approx 0.06$
 keV) as at the later time step $t \approx 8230$
 . It is clear from these single particle trajectories that particle acceleration in TSR becomes much less efficient outside of the peak magnetic field perturbation, and is consistent with the results of Hosseinpour (Reference Hosseinpour2014b). Figures 7 and 8 show nearly identical behaviour of the ratios $p_{\|} / p_{\bot }$
 and $\mu / \mu _{0}$
 . As qualitatively seen by their trajectories, neither particle becomes trapped about the null point during their relatively small acceleration and orbit about the spine axis, and quantitatively, these momentum and magnetic moment ratios suggest minor jet-like behaviour (i.e. fairly non-conserved $\mu / \mu _{0}$
 ) until the particles lose their kinetic energy.
Test particle results for region 3 ($r > \sqrt {2} L_{0}$ ) for injection position $[r, \theta, \phi ] = [1.25 \sqrt {2}, 0, 0]$
 . Particle trajectories are coloured going from blue to red in time. Background 3-D null point magnetic field lines are projected with black lines. Enlarged trajectories are shown in the inset boxes. Panels show (a) $XZ$
 (b) $XY$
 trajectory showing wide circulation around the fan plane centred around the null and minor acceleration in the $Z$
 -direction. Time evolution of the (c) total energy and (d) kinetic energy only. The kinetic energy peak of 0.06 keV occurs at $t = 163$
 (inset), with a comparable kinetic energy gain at $t \approx 8230$
 . (e) Time evolution of the parallel-to-perpendicular momentum ratio $p_{\|} / p_{\bot }$
 and (f) magnetic moment ratio $\mu / \mu _{0}$
 .

Test particle results for region 3 ($r > \sqrt {2} L_{0}$ ) for injection position $[r, \theta, \phi ] = [1.50 \sqrt {2}, 0, 0]$
 . Particle trajectories are coloured going from blue to red in time. Background 3-D null point magnetic field lines are projected with black lines. Enlarged trajectories are shown in the inset boxes. Panels show (a) $XZ$
 (b) $XY$
 trajectory showing wide circulation around the fan plane centred around the null and minor acceleration in the $Z$
 -direction. Time evolution of the (c) total energy and (d) kinetic energy only. The kinetic energy peak of 0.08 keV occurs at $t = 11,105$
 . (e) Time evolution of the parallel-to-perpendicular momentum ratio $p_{\|} / p_{\bot }$
 and (f) magnetic moment ratio $\mu / \mu _{0}$
 .

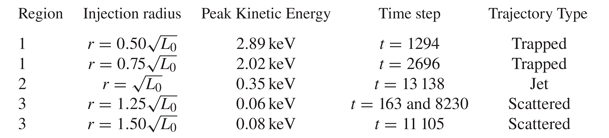
The peak kinetic energy gains of each of the five test particles have been consolidated with their respective timestamps in table 2. These results taken together provide an approximate expected energy spectrum evolution resulting from TSR. As will be further elaborated upon in § 4, different particle populations accelerated at different times seem to form at least three distinct trajectory types: trapped (region 1), jet (region 2), and scattered (region 3). These approximations can be useful for predicting the fast ion energy spectra using diagnostics such as retarding potential analysers (Böhm & Perrin Reference Böhm and Perrin1993), optical emission spectroscopy (Stark et al. Reference Stark, Fox, Egedal, Grulke and Klinger2005) and laser-induced fluorescence, all of which have been shown to be critical in magnetic reconnection experiments resulting in particle acceleration. Understanding the spatio-temporal kinetic energy distribution of high-temperature ions resulting from TSR and other torsional magnetic reconnection modes can have implications for other technology development efforts, including PJMIF.
Consolidated results of the five particle trajectories examined in this study. The first particle in region 3 has two nearly identical $KE$ (kinetic energy) peaks at two separate time steps.

4 Discussion
In this paper, we have simulated particle acceleration in 3-D TSR using laboratory scaling parameters typical of high-voltage CPGs (Chesny et al. Reference Chesny, Orange, Oluseyi and Valletta2017, Reference Chesny, Orange and Hatfield2021b) and pulse power conducting coils (Chesny et al. Reference Chesny, Orange and Dempsey2021a, Reference Chesny, Moffett, Cole, Baptiste and Orange2022a). Using vector and scalar field solutions to the resistive, kinematic, steady-state MHD equations, helium ion trajectories were mapped to determine the efficacy of TSR as an efficient particle accelerator. Although these solutions are limited in that they assume the onset of reconnection has already occurred, they are the first to quantify feasible particle responses for laboratory-scale TSR (see below). These results can act as a transition benchmark for both more advanced PIC simulations of TSR and for constructing experimental infrastructures that are designed to induce and study torsional reconnection modes. The rapid acceleration of helium ions from 10 up to $\sim 10^{2}--10^{3}$ eV is the first demonstration that TSR can act as a significant particle accelerator at laboratory scales, whereas TSR is already known to accelerate jets at solar coronal scales (Hosseinpour et al. Reference Hosseinpour, Mehdizade and Mohammadi2014; Hosseinpour Reference Hosseinpour2014b).
The requirement of altering the time scales of per-particle trajectories to isolate their time steps of peak kinetic energy demonstrates that the efficiency of TSR is radially dependent. Internal region 1 particles ($< \sqrt {2} L_{0}$ ) become quickly trapped and mirrored, while outer region 3 particles ($> \sqrt {2} L_{0}$
 ) are generally scattered and confined to orbiting the central spine axis close to the fan plane for relatively longer periods of time. Although the peak energy particles (${\gtrsim }2$
 keV) occur close to and trapped close in toward the null region, the particles injected near the radius of maximum perturbation and close to peak resistivity in region 2 ($\sqrt {2} L_{0}$
 ) form the most significant jet phenomenon. These results suggest that future experimental results of TSR will be best diagnosed by particle injection that forms morphologically resolvable jet structuring on spatial scales of $L_{0}$
 (see below). The $\boldsymbol {E} \times \boldsymbol {B}$
 electric field ($\boldsymbol {E}$
 ) and magnetic field ($\boldsymbol {B}$
 ) drift velocity vector mappings and scalar resistivity profiles in figures 2(e,f) and 3(c,d), respectively, highlight the usefulness of considering regions 1 through 3 of particle acceleration behaviour in TSR. These predictive fields demonstrate that in TSR the particle trajectory morphology and peak kinetic energy dynamics are far more sensitive to the injection radius than in TFR (Chesny et al. Reference Chesny, Orange and Hatfield2021b), where a large sheath of 10 000 particles under identical laboratory parameters was accelerated to a single centimetre-scale jet formation in a narrow range of peak root mean squared kinetic energies ($KE_{RMS} \approx 2.03$
 keV). While the peak kinetic energy of region 1 particles (2.02–2.89 keV) exceed that of the TFR case, these particles are trapped about the null point, do not form jet-like structuring and may contribute significant radiative losses. Only the region 2 particle in TSR forms a centimetre-scale jet structure similar to the TFR case, but with an almost order of magnitude smaller peak kinetic energy (350 eV). The peak kinetic energy of region 3 particles outside the region 2 jet is essentially scattered out along the fan plane at relatively low energies (60–80 eV), whereas in the TFR case there are zero scattered particles.
Section 1 suggested the importance of new experimental infrastructures to study complex geometries of fully 3-D models of torsional reconnection. The results of these TSR simulations in conjunction with previous TFR results (Chesny et al. Reference Chesny, Orange and Hatfield2021b) shed insight into how the details of experimental 3-D torsional reconnection may be set up by the initial potential fan-spine field (figure 1a; e.g. Chesny et al. Reference Chesny, Moffett, Cole, Baptiste and Orange2022a) and its superposition upon the CPG plasma with an embedded azimuthal magnetic field (figure 1b; e.g. Chesny et al. Reference Chesny, Moffett, Hatfield, Cole, Landers, Shokrollahi and Ege2022b; Moffett et al. Reference Moffett, Chesny, Cole, Hatfield and Rusovici2022). The vector and scalar fields in figures 2 and 3 are solutions to resistive MHD and are solved from the background fan-spine magnetic field with a superimposed perturbation. Key to understanding the onset of torsional reconnection is the generation of the electric potential and electric field (e.g. Pontin & Galsgaard Reference Pontin and Galsgaard2007). The differences between the current sheet structure, electric fields and resultant particle acceleration profiles in TSR and TFR were explored in time-dependent resistive MHD simulations (Pontin & Galsgaard Reference Pontin and Galsgaard2007; Pontin et al. Reference Pontin, Al-Hachami and Galsgaard2011) and are due to the geometric importance of where the perturbation is imposed upon the background fan-spine magnetic field. Herein for the TSR case, the confinement of the perturbation to the fan plane forces field line slippage that generates a vertical, tubular current sheet extending axially along the spine axis, closely matching the resistivity profile of figure 3(c,d). The delineation between radial regions, in terms of the electric potential and resistivity, is immediately evident from the resultant $\boldsymbol {E} \times \boldsymbol {B}$ profile. In contrast, during TFR the geometrical confinement of the perturbation is located axially along and centred around the spine, but forces an electric field generation in a horizontal disc shape where it and the plasma resistivity create a near uniform, radially symmetric drift velocity up along the spine axis.
Another takeaway for the TSR results presented here is that considerations of regions 1–3 can be incorporated into new CPG designs, including electrode spacing and gas puff sites (Chesny et al. Reference Chesny, Moffett, Hatfield, Cole, Landers, Shokrollahi and Ege2022b). Such master control of where electric breakdown occurs should help localize gas (particle) injection sites and optimize the study of experimental TSR vs TFR dynamics. The results of these simulations also suggest that if plasma injection along with the required rotation to the fan plane structuring were optimized, a resolvable jet structure would propagate without being shrouded by higher-energy radiation from mirrored particles. In this way, proper diagnoses of particle energy spectra could be directly associated with morphological structuring. Phenomenologically identifying resolvable plasma shapes in laboratory experiments according to these expected spatio-temporal distributions, as evident from tubular spine-aligned current sheets in TSR, can assist with quantitative diagnostics of particle spectra. This can also be extrapolated to an enhanced design of experimental hardware. Typical CPGs are constructed with a single central electrode which serves as the inner boundary of the axially propagating plasma sheath. If the central electrode was instead constructed as a distributed ring of electrically connected electrodes, mimicking the outer electrode array but at a smaller radius, then the plasma sheath formation can be confined to a scalable radial range. If the plasma and its inherent azimuthal magnetic field were radially confined in this way, particle injection can follow the dynamics found in this study in which a single jet structure can be formed. This would isolate the magnetic field perturbation away from the inner and outer radial extents that result in particle trapping and weak acceleration.
5 Conclusion
This manuscript presents the first investigation of simulated charged particle responses to resistive torsional spine magnetic reconnection (TSR) using typical laboratory-scale parameters. It was found that significant particle heating to ${\approx }3$ keV temperatures was achieved, but these particles are trapped in a typical mirror state about a magnetic null point. The most optimal particle propagation to a significant jet-like structure demonstrated heating to ${\approx }0.35$
 keV and was localized to the region of peak magnetic field perturbation within the global fan-spine magnetic field topology. These positions are considered optimal due to their formation of resolvable centimetre-scale jet structures which are of interest to astrophysical and laboratory plasma science. The results of this paper also demonstrate the efficacy of particle acceleration and morphology in TSR in comparison with the torsional fan case (TFR). The regions of particle injection as shown herein suggest that confining plasma injection to certain sites may become a method for deploying diagnostics on future experimental architectures designed for inducing the TSR process.
Acknowledgements
Editor T. Carter thanks the referees for their advice in evaluating this article.
Funding
This study was supported by Department of Energy Office of Science program grant DE-SC0024657.
Declaration of interests
The authors report no conflict of interest.
Data availability
The data that support the findings of this study are available from the corresponding author upon reasonable request.