I. INTRODUCTION
With the increase of turbine engine thrust-weight ratio, the properties of aerospace turbines need to be improved urgently. Due to harsh environment a turbine disc has to rotate at high temperatures and complex stress levels. Processing superalloy by casting is frequently encountered with chemical segregation and coarse grained microstructures. In addition processing via powder metallurgy (P/M) route involves various processing steps such as argon atomization, compaction, hot isostatic pressing (HIP), and extrusion leading to long production cycle and surface oxidation of powders. Reference Leatham1
Alloy LSHR was designed by the NASA Glenn Research Center for advanced turbine disc application. The alloy combined the low solvus temperature of Rene104 and high refractory elements of Alloy10. LSHR was initially processed by the conventional P/M route (CE-LSHR). 2 In this work we adopt spray forming (SF) as a substitute that is a more attractive processing method. Spray forming is a quick-solidifying technology that stems from metal atomization and powder metallurgy, besides it overcomes the disadvantages of conventional P/M manufacturing route.
The objective of improving disk superalloy is driven by the need for larger disks or higher temperature use. Most of the first and second generation turbine disks are submitted to temperatures less than or equal to 650 °C. In these conditions, tensile and fatigue strengths are the main criteria retained for the alloy design. But an increase in design temperature to 700 °C would give a growing importance to the creep strength capability. As the superalloy is designed as a disk material, a great deal of research focuses on the fatigue properties. Reference Chan3,Reference Gabb, Gayda, Telesman, Ghosn and Garg4 Limited information is available concerning about the creep resistance of alloy LSHR. Reference Everitt, Jiang, Gao, Starink, Brooks and Reed5 Better understanding of the creep properties at 700 °C service conditions is significantly important for the application and further improvement of spray formed (SF)-LSHR alloy.
With regard to creep in polycrystalline alloys utilized in disk applications, several studies show that the creep response is not only dependent on the microstructure, but also is sensitive to the external factors of stress and temperature. Reference Viswanathan, Sarosi, Henry, Whitis, Milligan and Mills6–Reference Gu, Harada, Cui, Ping, Sato and Fujioka8 Hence, as described in this work the microstructure of SF-LSHR was firstly studied, then creep behaviors were investigated at seven different stress condition at about 700 °C. The stress exponent n under a given condition was obtained. The creep properties of the alloy were evaluated with other nickel-based superalloys by using Larson–Miller parameter (LMP). Dislocation structures, macroscopic, and microscopic fracture structures were investigated, with the result that the creep deformation mechanism and fracture mechanisms were discussed.
II. MATERIALS AND PROCEDURE
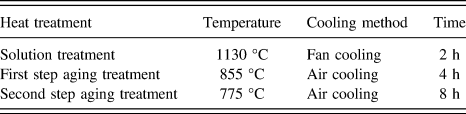
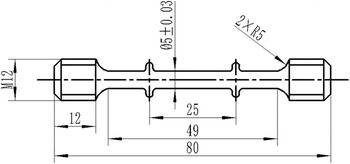
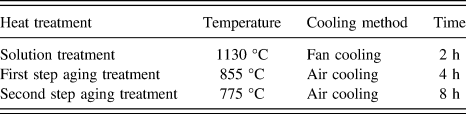
The master alloy of SF-LHSR was prepared in Fushun Special Steel Shares Co. Ltd. (Fushun, China) using vacuum induction melting (VIM) followed by vacuum arc remelting (VAR). The chemical composition is listed in Table I. The spray forming of the deposited billet was conducted on an SK-II spray-forming device at University of Bremen (Bremen, Germany). HIP was undertaken on the as-sprayed billet at the condition of 1140 °C and 140 MPa for 3 h, which was at the height of 262 mm, and the diameter of the billet was from 182 mm to 192 mm. Afterward that the billet was isothermally forged to produce a pancake-shaped forging. The heat treatment regime of the SF-LSHR alloy is listed in Table II, and the error ranges of the used heating furnace were ±2 °C. Creep samples were machined as shown in Fig. 1.
Chemical composition of SF-LSHR powder metallurgy superalloy (weight percent).

Heat treatment regime of LSHR.
Geometry of creep specimen (mm).

Samples for micro-observation were chemically etched by modified Kalling’s reagent (5 g CuCl2 + 100 mL H2O + 100 mL C2H5OH) and electrically etched by a solution of 170 mL orthophosphoric acid, 16 g chromic oxide, and 10 mL sulfuric acid. Optical microscopy (OM) was conducted on the Olympus GX51 (Olympus Corporation, Tokyo, Japan). Linear intercept grain size and porosity volume fraction were measured using Image Pro Plus 6.0 software.
Constant load tensile creep tests were performed at 704 °C, as many creep tests in references were performed at 1300 °F. Reference Garosshen, Tillman and McCarthy9–Reference Kim, Kim, Sa, Lee, Park and Moon11 Consideration of the service condition and experimental condition of turbine disk, seven different load stress were chosen: 690, 733, 750, 776, 793, 862, and 897 MPa. All creep tests were proceeded until rupture, and 5 mm long longitudinal sections were wire-electrode cut from fractured creep samples for further investigations.
An Inspect F50 field emission gun scanning electron microscope (FEG-SEM; FEI Company, Eindhoven, The Netherlands) was used to examine the bulk specimens, most of which were prepared via mechanical grinding and polishing, followed by etching. Transmission electron microscope (TEM) foils were mechanically thinned to 50–100 µm and electro-polished using a 10% perchloric acid ethanol solution at −30 °C. They were observed under TECNAI F20 TEM (FEI Company). Minor phases were identified using selected area electron diffraction patterns (SAEDP) and energy dispersive X-ray spectroscopy (EDS). The electron backscatter diffraction (EBSD) specimens were prepared by ion etching, and the microstructural analysis was performed by NordlysNano system integrated in the scanning electron microscope.
III. RESULTS
A. Microstructure
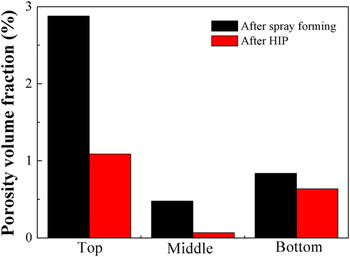
The microstructure and porosity of SF-LSHR deposit are a result of alloy composition and solidification of spray forming. The porosity contents vary within the height of deposit. From top to bottom the porosity volume fractions are 2.88, 0.48, and 0.84, respectively. Figure 2 shows porosity volume fraction reduces greatly after HIP, which is less than 1% on average.
Porosity levels in the as-sprayed condition and after HIP of SF-LSHR.

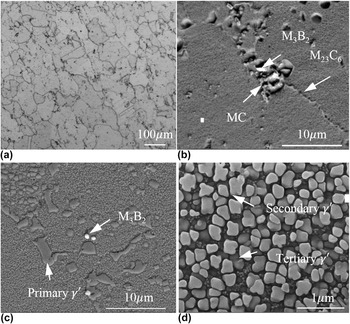
Typical graphs of the alloy after heat treatment are shown in Fig. 3. The minor phases of powder metallurgy disk superalloy SF-LSHR were observed and studied. There are three different phases including MC carbides, M23C6 carbides, and M3B2 borides with the arrow marking in Figs. 3(b) and 3(c). The heat treatment was below the γ′ solvus temperature, thus the primary γ′ did not dissolve completely. The grain size of alloy SF-LSHR is about 58 μm [Fig. 3(a)], and the dark phase particles are primary γ′ with an average diameter of about 1.0 μm. The primary γ′ acts to constrain grain growth during forging. Also the images show that the structure consists of secondary cubical γ′ with mean dimension of 0.20 μm, and tertiary circular γ′ with mean dimension of 35 nm Figs. 3(c) and 3(d).
Microstructure of the SF-LSHR superalloy; (a) optical graph, (b) SEM micrograph showing carbides and boride, (c) BSEM showing boride and primary γ′, (d) SEM micrograph showing secondary γ′ and tertiary γ′.

B. Creep properties
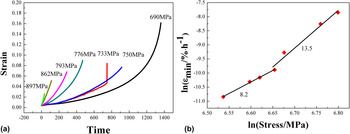
Creep curves display three stages of creep: a short stage of primary, a transient secondary state, and a long tertiary stage. In many cases the secondary state is transient, especially under high stress, so the minimum strain rate
 $\left( {{{\dot \varepsilon }_{{\rm{min}}}}} \right)$
is in replacement of the steady state strain rates
 $\left( {{{\dot \varepsilon }_{\rm{s}}}} \right)$
.
Reference Paslay, Wells and Leverant12,Reference Rösler and Arzt13
The minimum strain rates are plotted in against the applied stress σ on a log–log scale, a linear fitting of the points is also included in Fig. 4(b). Rupture life as well as ductility decreases sharply with increasing load, while the minimum strain rate increases significantly (Fig. 4). The relationship between the minimum strain rate and stress can be expressed by Sharper–Dorn Reference Harper and Dorn14 equation:
 $${\dot \varepsilon _{min }} = A\sigma _{\rm{a}}^n\exp ({{ - {Q_{\rm{c}}}} \mathord{\left/ {\vphantom {{ - {Q_{\rm{c}}}} {RT}}} \right. \kern-\nulldelimiterspace} {RT}})\quad .$$
A was a constant related with the material,
 ${\sigma _{\rm{a}}}$
is the load stress, Q
c is the creep activation energy, and R is ideal gas constant. At a specific temperature the equation above is taken form of logarithm, then it turns into Eq. (2).
 $$\ln {\dot \varepsilon _{min }} = n\ln {\sigma _{\rm{a}}} + c$$
LSHR superalloy creep properties; (a) creep curves at 704 °C and stress conditions of 690, 750, 776, 793, 862, and 897 MPa, (b) stress dependence of minimum strain rate at 704 °C.

The values of the stress exponent is about 8 in the low stress regime and 13 under higher stress from the slope of Eq. (2) and c is a constant. Based on the references the true stress exponent of dislocation creep in pure metals was about 3–5, while for particle strengthened superalloy the stress exponent will be higher. Reference Ig Hong15 The stress exponent of SF-LSHR is close to other disk superalloy such as Waspaloy (7.1) and Inconel 718 (between 8 and 11). Reference Byrne, Hall and Grabowski16,Reference Floreen and Kane17 A high n value (10.4–12) is frequently interpreted as indication of dislocation shearing mechanism. Reference Huo, Gou, Zhou, Qin and Li18 In this work massive grain boundaries are also associated.
C. Fracture morphology
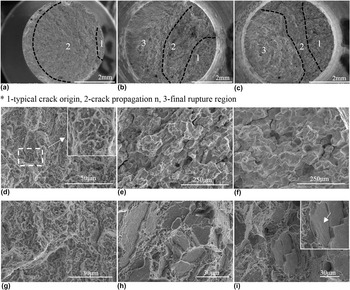
The failed creep specimens were sectioned and metallographic prepared for fracture observation by SEM (Fig. 5). Typical intergranular surface failure initiations under all stress conditions are clearly identified by color, as initiations are gravely oxidized compared with other regions on fractures, besides secondary cracks are confirmed to initiate along the specimen surfaces. A transition of fracture appearance was observed from low stress regime (690–750 MPa) to high stress regime (776–897 MPa). At the stress of 690 MPa the failure mode surface is ductile with lots of dimples [Figs. 5(a) and 5(d)]. The area of crack propagation under this stress is much larger than others. Furthermore due to the long duration of test, the planar fracture surface is covered with oxide layer [Fig. 5(g)].
Fracture morphology of specimens; (a–c) macroscopic morphology; (d–f) typical crack origin; (g–i) final rupture region, (a, d and g) 690 MPa, (b, e and h) 776 MPa, (c, f and i) 862 MPa.

The macroscopic fracture is transgranular and intergranular mixed fracture under higher stress. Moreover the surface of the fracture is ragged compared with the specimen at 690 MPa. The final rupture region is convex. The area between crack initiation and final rupture is the region of propagation [Figs. 5(b) and 5(c)]. The crack region manifests evidently intergranular characteristics. With increasing stress the extent of intergranular fracture increases [Figs. 5(e) and 5(f)]. The area of propagation and final rupture occurrs by scattered transgranular facets and steps. A few sliding traces could be observed on fracture facets [Figs. 5(h) and 5(i)]. The shear lip is narrow, and only a handful of dimples could be seen in the propagation zone.
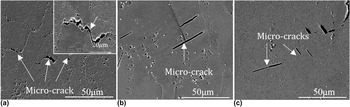
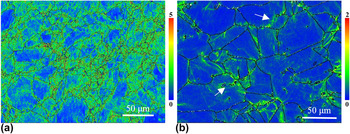
The longitudinal section fractures vary a lot in two stress regimes which are shown in Fig. 6. The microcracks are located along the grain boundaries at low stress, while at higher stress microcracks are all in grains. The microstructure of crept specimens such as grain shape and γ′ precipitates morphology is as stable as before deformation. Since there are essentially two different approaches to analyze plastic strain: the first based on the degradation of the diffraction patterns in strained materials, and the second based on local-misorientation. Local-misorientation analysis are preformed to identify the strain distribution in the deformed materials. Reference Wright, Nowell and Field19,Reference Kamaya20 It can be observed large local misorientation intends to locate along the grain boundary under low stress, while under higher stress the misorientation are in the grain, as schematically illustrated in Fig. 7. Taken together local misorientation data EBSD, fracture observation, and grain boundary characteristics, the large strain under higher stress concentrate in areas where slip bands are observed.
Morphologies of longitudinal section final fractures, (a) 704 °C/690 MPa, (b) 704 °C/776 MPa and (c) 704 °C/862 MPa.

Local misorientation map and color key. (a) 704 °C/690 MPa, (b) 704 °C/862 MPa.

D. Dislocation configuration
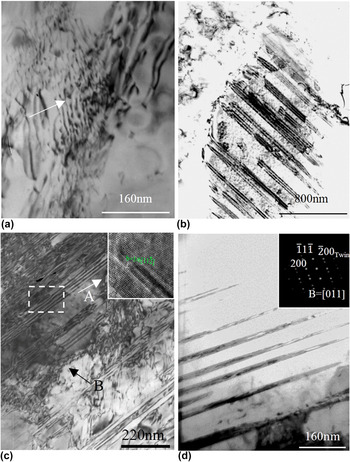
To investigate the transition of creep behavior and failure mode, the dislocation microstructures of crept until fractured SF-LSHR are analyzed. Dislocation tangles piling up along the grain boundary and γ/γ′ interface is observed, furthermore dislocation networks form in the matrix in the deceleration creep stage. As the creep goes on lots of stacking faults shear into γ′ precipitates. Isolated stacking faults, extended stacking faults, and microtwinning are all typical dislocation structures shown in Fig. 8.
Dislocation configurations of the crept specimens; (a) dislocation network at 704 °C/776 MPa; (b) isolated stacking faults at 704 °C/776 MPa; (c) extended stacking faults (inset high resolution image) (A), and dislocation piling-up (B) at 704 °C/862 MPa; (d) microtwinning at 704 °C/690 MPa.

As both isolated faults and extended faults are observed, it indicates that the formation of two kind of stacking faults may obey an identical mechanism. The stacking faults energy is as low as 77.1 mJ/m2 at 700 °C, which is calculated by JMatPro software, thus stacking faults are prone to form during the deformation. It is known that isolated stacking faults are created by the dislocation shearing in γ′ precipitate. Caron et al. and other researchers believed that the operative dislocation was directly created by the dissociation of the perfect a/2 〈110〉 dislocation at γ/γ′ interface. Reference Caron, Khan and Veyssière21,Reference Chen and Knowles22 However, Condat and Decamps thought the dislocation was formed by the reaction between a Shockley partial and an antiphase boundary (APB) in γ′ precipitate. Reference Caron, Khan and Veyssière21–Reference Milligan and Antolovich23 The a/2 〈110〉 matrix dislocation dissociates into two Shockley partials at γ/γ′ interface, and the leading partial dislocation enters a γ′ precipitate, which will produce narrow complex stacking faults as proposed by Viswanathan. Reference Viswanathan, Sarosi, Henry, Whitis, Milligan and Mills6,Reference Condat and Décamps24 The nucleation of another Shockley partial on the (111) plane above or below the complex stacking faults plane will remove the high energy. Then the two-layer Shockley partials would shear the γ′ precipitate leaving isolated stacking faults in the γ′ precipitates.
As the extended stacking faults and microtwinning both are substructures during the deformation, the Shockley partial shearing mechanism of isolated stacking faults is corresponded with other substructures. Moreover
 ${a \over 6}\left\langle {112} \right\rangle$
partial dislocation is identified by high resolution transmission electron microscopy. The dislocation reaction is as follows:
 $${a \over 2}\left\langle {101} \right\rangle \to {a \over 6}\left\langle {112} \right\rangle + {a \over 6}\left\langle {2\bar 11} \right\rangle \quad .$$
 $${a \over 6}\left\langle {112} \right\rangle + {a \over 6}\left\langle {112} \right\rangle \to {a \over 3}\left\langle {112} \right\rangle \quad .$$
The formation mechanism of extended stacking fault was studied by many researchers, and the viewpoint of Decamps appears to be reasonable in this work. Reference Viswanathan, Sarosi, Henry, Whitis, Milligan and Mills6,Reference Décamps, Morton and Condat25,Reference Pope and Ezz26 This model is similar with the mechanism of isolated stacking faults. The perfect dislocation a/2 〈110〉 dissociates in the matrix leaving extended stacking faults. More importantly extended stacking faults could transform into microtwinning as strain increases due to the diffusion-mediated reordering. Reference Kolbe27
From the reference in the unaged samples of NR3, shearing of γ′ particles occurred by 〈112〉 slip leaving stacking faults in extended deformation bands. Reference Raujol, Pettinari, Locq, Caron, Coujou and Clément28 However in finer Rene88DT Reference Zhao, Lin, Chen, Xue and Huang29 samples microtwinning is the leading mechanism during creep. Apart from the stacking faults microtwining is also the substructure under all stress conditions [Fig. 8(d)]. At the intermediate temperature regime twinning has been documented in not only single-crystal, but also polycrystalline disk superalloy. Reference Knowles and Chen30–Reference Kovarik, Unocic, Li, Sarosi, Shen, Wang and Mills32 The explanation of microtwinning formation obeys the crystallography model, which is put forward by Kolbe and verified by G.B. Viswanathan. Reference Viswanathan, Sarosi, Henry, Whitis, Milligan and Mills6,Reference Kolbe27 Successive shearing by 1/6〈112〉 Shockley partials on adjacent (111) planes, coupled with rearrangement of atoms in the precipitates, would result in microtwinning. Moreover Kovarik Reference Kovarik, Unocic, Li, Sarosi, Shen, Wang and Mills32 summarizes that the atomic reordering which requires vacancy-mediated exchange between Al and Ni atoms is necessary for the deformation microtwinning mechanism. The dislocation structures of specimens under different stress are similar, so they cannot be used to directly explain the differences observed in creep response.
IV. DISCUSSION
A. Creep properties compared with other superalloy
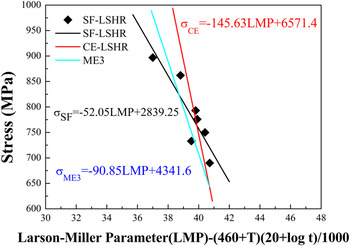
The objective of study is assessing the alloy SF-LSHR creep properties at about 700 °C (1300 °F). Two powder metallurgy superalloys ME3 and conventional CE-LSHR were being screened to compare their respective capabilities with SF-LSHR. The creep results data of SF-LSHR were used to generate conventional Larson–Miller curves of stress versus Larson–Miller parameter (LMP). The result plots are shown in Fig. 9, and a simple regression equation is included for estimating creep response at intermediate response. The regression Larson–Miller equations of ME3 and CE-LSHR are given from references which are used to estimate creep life ranging from 650 to 820 °C. 2,33 Likewise, two other regression Larson–Miller curves are included in Fig. 9 to compare creep responses at different stress.

It indicates that SF-LSHR has higher creep resistance low stress, while CE-LSHR perform better at high stress. The creep resistance of ME3 is not outstanding compared with two kinds of LSHR superalloy. It should be notable that the estimation of creep resistance in the way of Larson–Miller parameter is only suitable at the intermediate temperature in the work. Moreover alloy SF-LSHR performs poor ductility under higher stress according to the creep curves in Fig. 4. The LMP curve of SF-LSHR is consistent of the failure mode under high stress condition (776–897 MPa).
B. Transition on creep behaviors
The results illustrated in Figs. 4(b) and 5 represent the first experimental evidence of a transition in creep deformation. To interpret and account for the transition in creep behaviors, it’s crucial to concentrate on the intergranular and intragranular deformation. As Ni-based superalloy has a face-centered cubic (fcc) crystal structure, slip is an important way during deformation. After the sub-solvus heat treatment grain boundary sliding (GBS) of fine grains could not be neglected in creep deformation. The studies on polycrystalline superalloys suggest that grain boundary deformation could play a key role as a creep-controlling mechanism at high temperature. Reference Locq, Caron, Raujol, Pettinari-Sturmel, Coujou, Clément, Pollock, Green, Harada, Howson, Reed, Schirra and Walston34,Reference Dubiez-Le Goff, Couturier, Guétaz and Burlet35 Besides A. Soula et al. supports GBS needs the accommodation of intragranular slip. Reference Soula, Renollet, Boivin, Pouchou, Locq, Caron and Bréchet36 The overall strain of creep is constituted by three parts:
 $$\varepsilon = {\varepsilon _{{{gbs}}}} + {\varepsilon _{{g}}} + {\varepsilon _{{{dc}}}}$$
ε is the overall strain in creep, and ε gbs is the strain contributed by GBS. ε g is the strain associated with intragranular slip and intragranular dislocation. ε dc is the strain due to diffusion creep. At the intermediate temperature the contribution from diffusion creep is negligible, and equation form changes into:
 $$\varepsilon = {\varepsilon _{{{gbs}}}} + {\varepsilon _{{g}}}\quad .$$
The contribution of GBS, which is simplified by φ can be expressed as:
 $$\varphi = {{{\varepsilon _{{{gbs}}}}} \over \varepsilon }\quad .$$
As a result the contribution of intragranular slip and intragranular dislocation which is simplified by ψ stated as:
 $$\psi = 1 - \varphi \quad .$$
 $${\varphi \over \psi } = {{{\varepsilon _{{{gbs}}}}} \over {{\varepsilon _{{g}}}}} = {{{{\partial {\varepsilon _{{{gbs}}}}} \over {\partial t}}} \over {{{\partial {\varepsilon _{{g}}}} \over {\partial t}}}} = {{{{\dot \varepsilon }_{{{gbs}}}}} \over {{{\dot \varepsilon }_{{g}}}}}\quad .$$
In this way the contributions of GBS and intragranular slip are associated with strain rate. As grain shapes are not regular in practice, GBS could not cope with deformation all alone. GBS has to be accommodated by intragranular slip within the local deformation.
T.G. London has an opinion that the Rachinger sliding is a characteristic of high temperature deformation. He thinks the formula of
 ${\dot \varepsilon _{{{gbs}}}}$
change corresponding with the grain size.
Reference Langdon37
Since slip could not stretch over the whole grain when it is too large, hence slip trace occur within a small region in this case. In contrast sliding occurs exclusively within grain at small grain size.
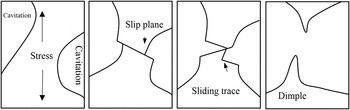
In the work the grain size under different creep condition is the same, however the stress condition is different. The experiment results show that in the low stress regime failure mode is dimple fracture. During the process of dimple formation cavitation would interact with slip band, which is illustrated in Fig. 10. In this condition the expression of
 ${\dot \varepsilon _{{{gbs}}}}$
become:
 $${\dot \varepsilon _{{{gbs}}}}({\rm{ls}}) = {{A'D'G{\bi b}} \over {kT}}\left( {{\bi {b} \over d}} \right){\left( {{\sigma \over G}} \right)^3}\quad {\rm{,}}$$
where A is a dimensionless constant, D is the diffusion coefficient (
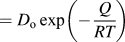 $= {D_{\rm{o}}}\exp \left( { - {Q \over {RT}}} \right)$
,
 ${D_{\rm{o}}}$
is a frequency factor, Q is the appropriate activation energy for diffusive process, and R is the gas constant), G is the value of shear modulus at the temperature of tests,
b
is the Burgers vector, k is Boltzmann’s constant.
Reference Mohamed and Langdon39
The model of the dimple formation in the low stress regime. Reference Peidao38

Under higher stress (776–897 MPa) intragranular slip which crosses the whole grain could easily be observed on the surface of macroscopic fracture and longitudinal section of fracture. In this condition
 ${\dot \varepsilon _{{{gbs}}}}$
(Ref. Reference Mohamed and Langdon39) can be expressed:
 $${\dot \varepsilon _{{{gbs}}}}({\rm{hs}}) = {{A''D''Gb} \over {kT}}\left( {{\bi {b} \over d}} \right){\left( {{\sigma \over G}} \right)^2}\quad .$$
In practice the value of the constant A is related to structural features in the material such as the stacking fault energy or the presence of precipitates. As the temperature of those creep tests is not a variable, it is convenient to compare the
 ${\dot \varepsilon _{{{gbs}}}}$
in two regime according to the values of
 ${\left( {{\sigma \over G}} \right)^3}$
in the low stress regime and
 ${\left( {{\sigma \over G}} \right)^2}$
in the high stress regime.
At higher stress φ is lower compared that in low stress regime, thus the accommodation of ψ will be prominent. As the creep goes on, the strain rate accelerates sharply during accelerate stage in high stress regime. When the strain rate is rapid enough, the time of grain boundary adjustment is not sufficient. Grain boundary sliding alone cannot cope with the whole creep deformation, thus intragranular slip weighs a lot in this occasion. Strain concentration is prone to locate in the site of slip bands Reference Laird, Finney and Kuhlmann-Wilsdorf40 when the strain rate is so high, and this is also supported by the results of EBSD. It is clear that microcracks are susceptible to initiate along the strain concentration, as a result in the high stress regime secondary cracks nucleate along the slip bands. It is proposed that grain boundary deformation is first activated during creep and intragranular deformation accommodates GBS when creep strain increases, Reference Soula, Renollet, Boivin, Pouchou, Locq, Caron and Bréchet36 but the prominent deformation mode is different during fracture in two regimes. High stress level is corresponding with high strain rate in the acceleration stage in most cases, so it is certain that failure mode is related to strain rate. It is important to note that the approach to the determination of strain rate is qualitative, however it is beneficial to understand the significant variation in fracture behaviors.
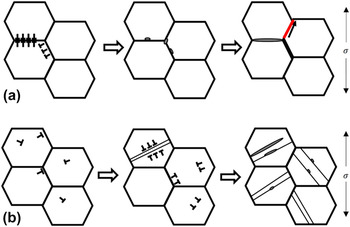
In summary grain boundary deformation is the main fashion in the low stress regime. However under higher stress, that is to say when strain rate is so rapid that larger local deformation will be localized in grain. The models of fracture behaviors are illustrated in Fig. 11. The difference about fracture modes among crept samples also supports the result that SF-LSHR alloy shows a better creep resistance in the low stress regime, which is consistent with the prediction results using Larson–Miller parameter.
The models of fracture behaviors; (a) intergranular deformation, (b) intragranular deformation.

V. CONCLUSION
-
(1) The creep curves of alloy SF-LSHR at about 700 °C in the stress range of 690–897 MPa were studied. The values of exponent n were calculated to be about 8.2 and 13.5 in two stress regime, respectively. With the increasing of the stress, the elongation and reduction in area decreased significantly.
-
(2) The dislocation substructures of all crept specimens were similar, included isolated stacking faults, extended stacking faults, and microtwinning.
-
(3) In the low stress regime the intergranular deformation was the main fashion. In contrast largest local deformation occurred in grain especially along the intragranular slip bands in the high stress regime.
-
(4) The typical cracks of SF-LSHR favorably initiated along creep specimen surface grain boundaries. However there was a transition of final failure mode in two stress regime. In the range of 690–750 MPa the fracture mode was typical ductile fracture with dimples, while in the regime of 776–897 MPa the morphology turned into intergranular and transgranular mixed fracture.
-
(5) The creep resistance of the alloy was compared with other superalloys using the Larson–Miller parameter. SF-LSHR showed good creep resistance at the low stress, while under higher stress the creep property was not comparable to the other two disk superalloys.
Supplementary Material
To view supplementary material for this article, please visit https://doi.org/10.1557/jmr.2016.510.
ACKNOWLEDGMENTS
This research is supported by the Technical Support Division of Shenyang R & D Center for Advanced Materials, we are all grateful to the members of division for their contribution and ideas.