1. Introduction
Customer churn (also known as customer attrition, dropout, turnover, or defection) refers to the non-renewal of existing customers for an insurance company. In general insurance, customer churn poses a major challenge to insurers because contracts are renewed periodically (commonly after one year), and with substantial competition and diverse contracts, it is easy for customers to switch insurance providers to satisfy their needs at the time. Customer churn also poses a challenge in life insurance and other industries such as banking and telecommunications; keeping a current customer rather than acquiring a new one is often a more profitable strategy for a company (Simchi-Levi et al., Reference Simchi-Levi, Kaminsky, Simchi-Levi and Shankar2008), because long-term consumers typically take up less of the company’s resources compared to new customers (Min and Zhou, Reference Min and Zhou2002). As such, analyses to determine the drivers and customer behaviours involving churn are critical to a company’s customer retention programme (Okongwu et al., Reference Okongwu, Lauras, François and Deschamps2016); identifying those customers with high intention to churn can help insurers secure continued loyalty.
This paper is motivated by customer churn analysis for commercial insurance, which plays an important role in the general insurance industry. According to the direct premium written reported by Brian Briggs (Reference Brian Briggs2021), the commercial market represents 49% of the total direct premium written in the US property & casualty insurance industry. Commercial insurance contracts can include several coverages such as building, equipment, and auto coverage, and it is common for customers to have multiple contracts with the same company or (alternatively) have multiple coverages under a single bundled contract (Dong et al., Reference Dong, Frees and Huang2022). Additionally, customers add or drop coverages, or switch providers entirely, on a regular basis to meet their benefits and budgets. Indeed, as revealed in a survey for Australian small commercial insurance consumers (Brant Carson, Reference Carson and Christine Korwin-Szymanowska2017), in the small and medium enterprise insurance market, around three-quarters of small business owners are dissatisfied with their commercial insurance providers. Approximately 19% of small business owners choose to switch insurance providers every year.
Since commercial insurance contracts are typically of short duration (so that customer churn is more about the non-renewal of a contract rather than breaking an existing contract), traditional customer churn analysis has focused on static models applied to data from a single period. This is despite the fact that commercial insurers can trace information about their customers over multiple periods, resulting in readily available longitudinal data. Moreover, with single period data, various methods such as logistic regression, decision trees, and neural networks have been proposed to predict the probability of customer churn for the next contract period (e.g., Yeo et al., Reference Yeo, Smith, Willis and Brooks2001; Guillen et al., Reference Guillen, Parner, Densgsoe and Perez-Marin2003; He et al., Reference He, Xiong and Tsai2020). However, with multi-period or longitudinal data, customers often traverse a larger number of states beyond simply deciding whether to churn or not. That is, as discussed above, during a multi-period contract term, commercial policyholders may regularly adjust their coverages combination by adding and dropping coverages. For example, an organisation policyholder taking both building and equipment coverages as a bundled contract in one year may decide to drop equipment coverage but add auto coverage in the following year. Put simply, multi-period data more accurately reflect the dynamic changes in the needs of policyholders and the broader market, for example, the coverage first dropped by a policyholder is usually an important signal to predict subsequent likelihood to churn (Brockett et al., Reference Brockett, Golden, Guillen, Nielsen, Parner and Perez-Marin2008). Thus, there is a strong motivation for commercial insurers to break away from traditional customer churn analysis. In this paper, we propose and advocate using multi-period data to perform multi-state customer churn analysis, focusing not only on the customer churn per-se but also on the coverage adjustment behaviour of commercial customers over time.
While there are a number of ways by which multi-state customer churn analysis can be performed, in this article, we adopt a method that prioritises interpretability over predictive performance, namely multinomial logistic regression (MLR) with a higher-order Markov framework. To our knowledge, this paper is the first to use a higher-order Markov model for customer churn research in actuarial science. We illustrate the use of this MLR and multi-state customer churn analysis on a longitudinal commercial insurance dataset from the Wisconsin Local Government Property Insurance Fund (LGPIF). Exploratory analysis of this data reveals that transition probabilities tend to depend strongly on the states of the policyholder in their two previous periods, which motivates considering a second-order MLR model to study policyholders’ states transition. We demonstrate how different sets of predictors tend to drive the various likelihoods of transition, which we visualise through conditional effect and average marginal effect plots. A comparison of multi-state customer churn analysis to traditional (single-state) customer churn analysis reveals that the former can lead to more accurate calculations of customer lifetime value. Furthermore, the second-order MLR model has consistently strong out-of-sample predictive performance relative to several parametric models of different orders and also compared to more non-parametric techniques such as support vector machines (SVMs) and gradient boosting machines (GBMs).
The remainder of this paper is organised as follows. In Section 2, we review the literature on customer churn and multi-state modelling. In Section 3, we illustrate how to perform multi-state customer churn analysis using MLR models under the first- and second-order Markov assumptions. In Section 4, we illustrate an application of second-order MLR models to study multi-state customer churn in the LGPIF data, visualising the estimated effects along with demonstrating differences in calculating customer lifetime value between multi-state versus traditional customer churn modelling. In Section 5, we compare the out-of-sample prediction performance of the second-order MLR model with several other methods for forecasting transition. Section 6 offers some concluding remarks.
2. Literature review
In actuarial science, multi-state models are commonly divided into time-discrete and time-continuous approaches (see Haberman and Pitacco, Reference Haberman and Pitacco2018, for an overview), with the primary difference being whether the transitions between states are assumed to occur at any time or at equally spaced time points during a certain research period. In this paper, motivated by commercial insurance data from the LGPIF and to be consistent with traditional customer churn analysis (e.g., Guillen et al., Reference Guillen, Parner, Densgsoe and Perez-Marin2003; Brockett et al., Reference Brockett, Golden, Guillen, Nielsen, Parner and Perez-Marin2008), we adopt the former and assume that the results of policyholders’ renewal decisions are realised at the end of each contract period. However, we acknowledge the vast literature on time-continuous multi-state models used in long-term care insurance (e.g., Pritchard, Reference Pritchard2006; Fong et al., Reference Fong, Shao and Sherris2015), life insurance (e.g., Norberg, Reference Norberg2013; Buchardt, Reference Buchardt2014; Buchardt et al., Reference Buchardt, Møller and Schmidt2015), and general insurance (e.g., Orr, Reference Orr2007; Hürlimann, Reference Hürlimann2015).
In terms of traditional customer churn analysis, particularly in general insurance, there exists an array of different techniques for modelling the likelihood of customer churn (a binary response). By far, the most popular of these is logistic regression, or some variation thereof, to quantify the factors driving customer churn (see Guillen et al., Reference Guillen, Parner, Densgsoe and Perez-Marin2003; Günther et al., Reference Günther, Tvete, Aas, Sandnes and Borgan2014; Staudt and Wagner, Reference Staudt and Wagner2018; Frees et al., Reference Frees, Bolancé, Guillen and Valdez2021, among many others). More recently, data mining techniques such as tree-based methods and neural networks have grown in popularity for predicting churn rates (Bolancé et al., Reference Bolancé, Guillen and Padilla-Barreto2016; He et al., Reference He, Xiong and Tsai2020). Yet another approach uses survival analysis to study how long a customer will stay with a company after their first policy cancellation (see for instance Brockett et al., Reference Brockett, Golden, Guillen, Nielsen, Parner and Perez-Marin2008; Guillen et al., Reference Guillen, Nielsen and Pérez-Marn2009, Reference Guillen, Nielsen, Scheike and Pérez-Marn2012).
It is important to highlight the general trade-offs among these different techniques for traditional customer churn analysis. Logistic regression is more parsimonious in the sense of having coefficients that explicitly quantify the effects of predictors on the response variable (churn rate), on which one can perform statistical inference on. In contrast, machine learning models often exhibit superior predictive capacity due to their relative flexibility, but the parameters of (most) machine learning models are related more to controlling the learning process, without necessarily having a practical meaning. Such trade-offs also exist in the context of multi-state customer churn analysis. In this paper, we adopt MLR, which is a natural extension of logistic regression to the case of categorical responses with more than two levels, as we prioritise interpretability over predictive capacity (although we note that in our application to the LGPIF data, MLR worked reasonably well in predicting transitions compared to some machine learning techniques for multi-state modelling).
MLR has already been used in actuarial science to study various multi-class classification problems. For example, Christiansen et al. (Reference Christiansen, Eling, Schmidt and Zirkelbach2016) employed MLR to study policyholders’ decisions to switch insurance coverage in long-term health insurance, Zhu et al. (Reference Zhu, Li, Wylde, Failor and Hrischenko2015) used MLR to model the claim rate, lapse rate, and in-force rate jointly in life and annuity insurance, while Alai et al. (Reference Alai, Arnold and Sherris2015) and Kwon and Nguyen (Reference Kwon and Nguyen2019) applied MLR to model cause-specific mortality. A more relevant work is that of Antonio et al. (Reference Antonio, Godecharle and Van Oirbeek2016), who used MLR with a first-order Markov assumption to build a multi-state model for the development of a non-life insurance claim process. However, to the best of our knowledge, this paper is the first to propose its use with a second-order Markov assumption in customer churn analysis.
3. Multi-state customer churn modelling
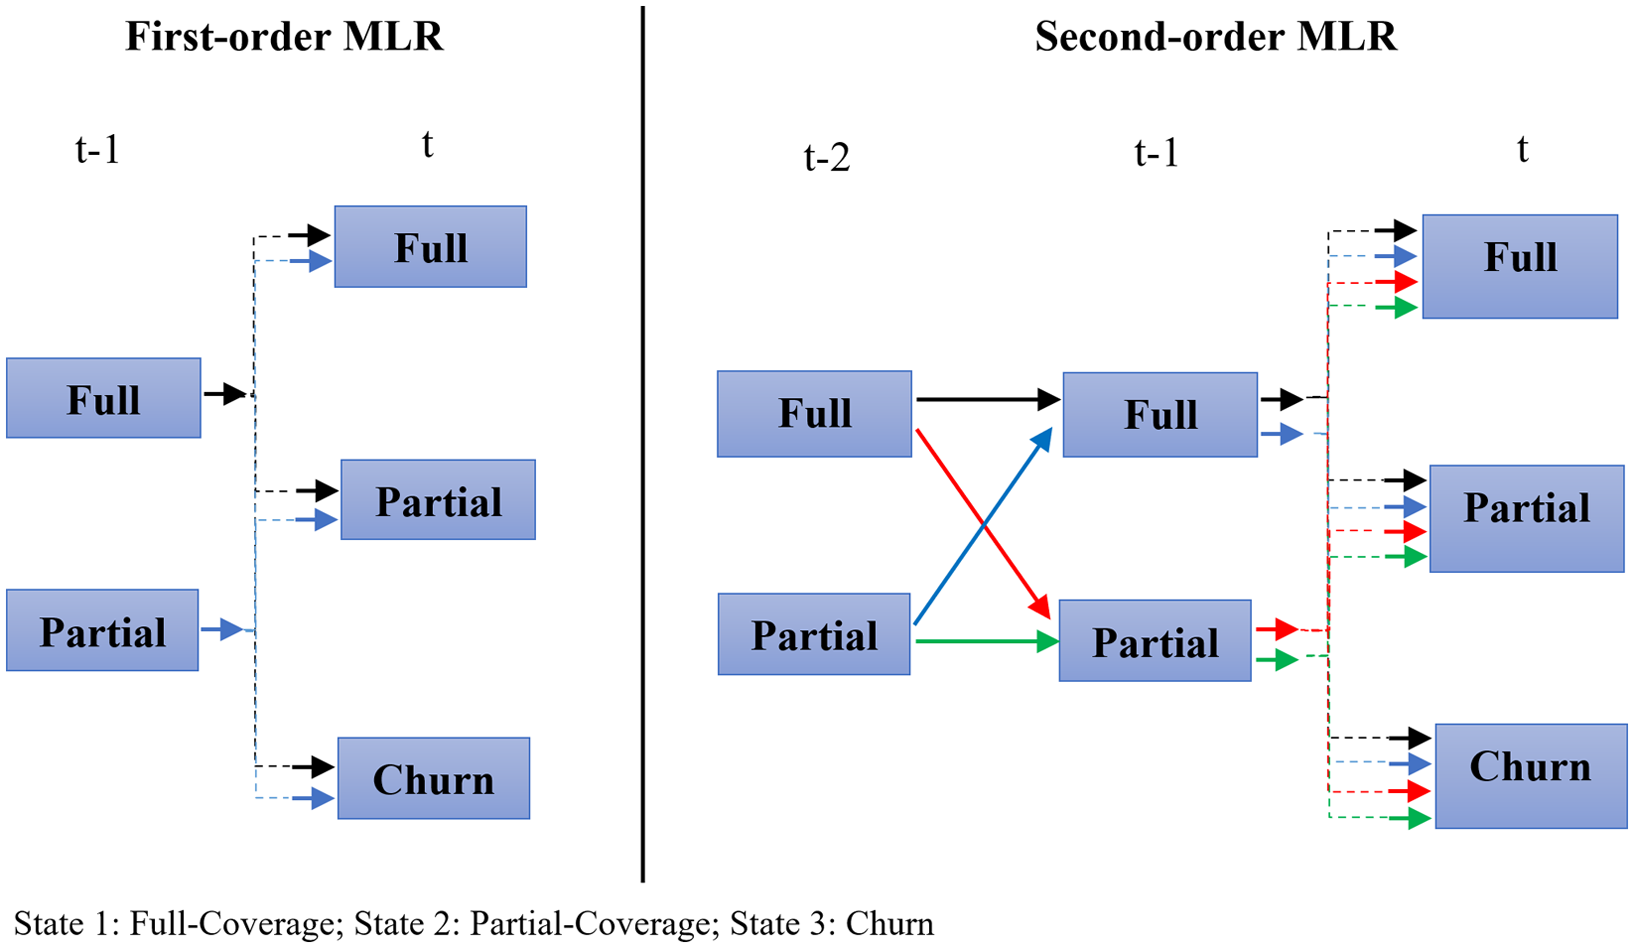
For constructing time-discrete multi-state models of customer churn, there are two strategies we can adopt in terms of fitting MLR models; see Chapter 11.3 of Frees (Reference Frees2004). First, we can split the data into separate subsets based on each state of origin and build a separate MLR model for each subset. For example, suppose there is a total of three possible states that a policyholder can be in, namely full-coverage, partial-coverage, and churn, and we want to model the probabilities of transitioning into these states based (only) on the current state. Then, we could split the data based on the policyholder’s current state, such that we have a subset comprising all observations whose current state is full-coverage, and another subset comprising all observations whose current state is partial-coverage (note we ignore the subset comprising all observations whose current state is churn; see also Figure 1 later on). Then, we fit a separate MLR model to each subset, thereby modelling the transition probabilities from these two states of origin.
Multi-state customer churn analysis: first-order MLR model (left) and second-order MLR model (right).

Alternatively, we can fit a single MLR model to the whole data and use indicator variables to denote the states of origin when calculating the likelihood contribution. That is, we can construct interaction terms between each of the explanatory variables and a factor variable indicating the state of origin (in the above example, either full-coverage or partial-coverage) and then include this expanded set of predictors in the MLR model when calculating the likelihood contribution.
Both the above strategies have their advantages, with the former being computationally more efficient (especially using parallel computing), while the latter is more unified and offers a convenient means of (say) testing the equality of parameters; that is, the effect of a particular explanatory variable is the same irrespective of the state of origin and thus simplifying the regression structure. Importantly though, both methods of fitting the MLR model will produce the same estimates, statistical inference, and predictions. With this in mind, we will adopt the second strategy in this paper and use an expanded set of covariates in what follows.
To trace the path of a policyholder’s states over time, let
 $y_{i,t}$
denote the state of i-th policyholder at current time t, and
 $\{y_{i,1},\ldots, y_{i,t-1}\}$
denote the history of i-th policyholder’s states from time 1 up to the previous time point
 $(t-1)$
. Throughout the paper, we assume independence among individuals i for
 $i= (1, 2, \ldots, N)$
, which is standard and widely used in the actuarial studies (see e.g., Frees et al., Reference Frees, Lee and Yang2016; Okine et al., Reference Okine, Frees and Shi2022, among others for the LGPIF data specifically) as well as more broadly in the longitudinal data analysis literature; see also our discussion in Section 6. To build a MLR model (or any general approach for customer churn analysis as a matter of fact), a key decision to be made is how much of the policyholder’s state history is associated with the likelihood of being in their current state. That is, what order a Markov assumption should be assumed for transition probabilities. In actuarial science, by far the most common assumption is that of the first-order Markov property (Kwon and Jones, Reference Kwon and Jones2006, Reference Kwon and Jones2008; Bettonville et al., Reference Bettonville, d’Oultremont, Denuit, Trufin and Van Oirbeek2021), meaning that the probability of being in the current state depends only on the state at the previous time point, and not on earlier states. That is,
 $P(\,y_{i,t}|y_{i,1},\ldots, y_{i,t-1}) = P(\,y_{i,t}|y_{i,t-1})$
. For multi-state customer churn analysis, this leads to the following first-order MLR model. Assume there are a total of Q states that the policyholder can transition to, that is, states of destination. Then for the i-th policyholder, the transition probability from state r at time
 $(t-1)$
to state s at time t is given by
 \begin{align} P(\,y_{i,t}=s|y_{i,t-1}=r) = \frac{\exp \left(\boldsymbol{{x}}_{i,t-1,r}^\top \boldsymbol{\beta}_{rs} \right)}{\sum_{s^{\prime}=1}^{Q} \exp\left(\boldsymbol{{x}}_{i,t-1,r}^\top\boldsymbol{\beta}_{rs^{\prime}} \right)},\end{align}
where
 $\boldsymbol{{x}}_{i,t-1,r}$
is a vector of explanatory variables for the i-th policyholder who was in state r at time
 $(t-1)$
, with its first element set equal to one to reflect an intercept term, and the quantity
 $\boldsymbol{\beta}_{rs}$
denotes the vector of regression coefficients quantifying the effect of the explanatory variables on the transition probability from state r to state s. Note the dependence of explanatory variables on the state of origin reflects the idea that one may wish to, whether based on a-priori knowledge or exploratory data analysis, include different sets of explanatory variables for the transitions with different states of origin. Indeed, we adopt this approach in the LGPIF application, for example, see Table 3. At the same time, the dependence on r also reflects the construction of an expanded set of covariates, that is, interaction terms between each of explanatory variable and a factor variable indicating the state of origin. In traditional customer churn analysis, it is assumed that the probability of churn from
 $(t-1)$
to t depends only on the explanatory variables
 $\boldsymbol{{x}}_{t-1}$
at time
 $(t-1)$
(see Guillen et al., Reference Guillen, Parner, Densgsoe and Perez-Marin2003; Brockett et al., Reference Brockett, Golden, Guillen, Nielsen, Parner and Perez-Marin2008). In this paper, we further allow
 $\boldsymbol{{x}}_{i,t-1,r}$
in Equation (3.1) to include (values of) explanatory variables previous to
 $(t-1)$
, for example, in the LGPIF application these include time-variant predictors such as the ratio of total premium of this to previous year minus one (
 $\boldsymbol{{x}}_{i,t-1,r} / \boldsymbol{{x}}_{i,t-2,r} - 1$
); see Table 2.
When building a MLR model as in Equation (3.1), we need to decide on a reference state or reference category among all states of destination
 $s = 1,\ldots,Q$
. All the coefficients corresponding to this reference state will then be set to zero for reasons of parameter identifiability. For instance, if we choose
 $s=1$
to be the reference state, then we set
 $\boldsymbol{\beta}_{r1} = \textbf{0}$
for all states of origin r, and as such Equation (3.1) for this particular state of destination simplifies to
 $P(\,y_{i,t}=1|y_{i,t-1}=r) = \left(\sum_{s^{\prime}=2}^{Q} \exp\left(\boldsymbol{{x}}_{i,t-1,r} ^\top\boldsymbol{\beta}_{rs^{\prime}} \right)+1\right)^{-1}$
. Note this constraint is consistent with logistic regression, and it is also consistent with the interpretation of the coefficients in an MLR model in terms of log-odds. Following on from the above example, we have
 $\log \left(P(\,y_{i,t}=s|y_{i,t-1}=r) / P(\,y_{i,t}=1|y_{i,t-1}=r)\right) = \boldsymbol{{x}}_{i,t-1,r}^\top \boldsymbol{\beta}_{rs}$
, for
 $s = 2,\ldots,Q$
, meaning
 $\boldsymbol{\beta}_{rs}$
explicitly quantifies changes in the log-odds of transitioning (from state r) to state s relative to transitioning to state 1.
As discussed above, the first-order Markov assumption is a common one made in the context of (traditional) customer churn analysis. In this paper however, motivated specially by our exploration of the LGPIF data, we consider a second-order MLR model where the probability of being in the current state now depends upon the states in the previous two time points. More generally, a MLR model of order k implies that the probability of being in the current state depends on the k earlier states that is,
 $P(\,y_{i,t}|y_{i,1},\ldots, y_{i,t-1}) = P(\,y_{i,t}|y_{i,t-k}, y_{i,t-k+1},\ldots, y_{i,t-1})$
. Mathematically, a second-order MLR model expands on Equation (3.1) as follows. For the i-th policyholder, the transition probability from states (q,r) at time points
 $(t-2,t-1)$
to state s at time t is given by
 \begin{align} P(\,y_{i,t}=s|y_{i,t-2}=q,y_{i,t-1}=r) = \frac{\exp\left(\boldsymbol{{x}}_{i,t-1,qr} ^\top \boldsymbol{\beta}_{qrs}\right)}{\sum_{s^{\prime}=1}^{Q} \exp\left(\boldsymbol{{x}}_{i,t-1,qr} ^\top \boldsymbol{\beta}_{qrs^{\prime}}\right)}.\end{align}
The state of origin is now defined by two prior states (q,r) together, while
 $\boldsymbol{\beta}_{qrs}$
denotes the vector of regression coefficients quantifying the effect of the explanatory variables on the transition from state of origin (q,r) to state s. We use the second-order MLR model given by Equation (3.2) as an example to calculate the likelihood. Following the second-order Markov assumption, that is,
 $P(\,y_{i,t}|y_{i,1},\ldots, y_{i,t-1}) = P(\,y_{i,t}|y_{i,t-2}, y_{i,t-1})$
, we can write the likelihood function as
 \begin{equation}\begin{aligned} L = \prod_{i=1}^N P(\,y_{i,1}, y_{i,2}) \times P(\,y_{i,3}| y_{i,1}, y_{i,2}) \times \ldots \times P(\,y_{i,T_i} | y_{i,T_i-2}, y_{i,T_i-1}),\end{aligned}\end{equation}
where
 $T_i$
is the total number of observed states for i-th policyholder. Note that if a policyholder churned during the study period, then we treated the churn state as the last observed state (
 $\,y_{i,T_i}$
) for this policyholder. For the second-order MLR model, we focus on those policyholders who have entered their contracts for more than one year and ignore the new policyholders; in practice, these new policyholders are treated differently compared to existing policyholders. Hence, we treat the first two states of each policyholder as given, that is,
 $P(\,y_{i,1}, y_{i,2})=1$
. Then, we can replace the second-order conditional probabilities in Equation (3.3) with the second-order MLR formula on the right-hand side of Equation (3.2). The likelihood of the second-order MLR model can be written as
 \begin{align} & L(\boldsymbol{\beta}| \boldsymbol{{y}},\boldsymbol{{x}})\nonumber\\[3pt] &\quad = \prod_{i=1}^N \prod_{t=3}^{T_i} \prod_{s=1}^{Q} \prod_{r=1}^{Q-1} \prod_{q=1}^{Q-1} \left(\frac{\exp\left(\boldsymbol{{x}}_{i,t-1,qr} ^\top \boldsymbol{\beta}_{qrs}\right)}{\sum_{s^{\prime}=1}^{Q} \exp\left(\boldsymbol{{x}}_{i,t-1,qr} ^\top \boldsymbol{\beta}_{qrs^{\prime}} \right)}\right)^{\mathbb{I}(\,y_{i,t-2}=q) \mathbb{I}(\,y_{i,t-1}=r) \mathbb{I}(\,y_{i,t}=s)},\end{align}
where indicator variables
 $\mathbb{I}(\,y_{i,t-2}=q)$
,
 $\mathbb{I}(\,y_{i,t-1}=r)$
, and
 $\mathbb{I}(\,y_{i,t}=s)$
identify the states of origin and destination separately of the transition from
 $(t-2,t-1)$
to t for i-th policyholder. Note the number of states of origin for q and r is
 $(Q-1)$
because they excludes the churn (absorbing) state. In Equation (3.4), three successive observations (
 $y_{i,t-2}, y_{i,t-1}, y_{i,t}$
) of a policyholder can contribute to the likelihood once, which is the reason that fitting a higher-order MLR model requires more data as the order increases. Note that similar to its first-order counterpart, we again need to select a reference state and set the coefficients corresponding to this reference state to zero for reasons of parameter identifiability, for example,
 $s = 1$
and
 $\boldsymbol{\beta}_{qr1} = \textbf{0}$
for all (q,r).
By comparing Equations (3.1) and (3.2), we observe that a second-order MLR model greatly expands the states of origin and subsequently accounts for more of policyholders’ past history when determining the likelihood of moving to different states or staying in the same state. If such an assumption is appropriate, then Equation (3.2) will generally improve model fitting and predictive power compared to a first-order MLR model. On the other hand, fitting a higher-order MLR model requires more data as the order increases, for example, policyholders who are observed for less than three time points will not be useful for fitting a second-order MLR model, and we require a bigger sample size overall to ensure we have sufficient data within each state of origin to model the transition probabilities effectively.
To better illustrate the difference between using first- and second-order MLR models for multi-state customer churn analysis, we consider an insurance company that offers auto insurance (obliged) and homeowners insurance (optional). A policyholder of this company can reside in three possible states: full-coverage (state 1) where a customer is covered by both auto insurance and homeowners insurance, partial-coverage (state 2) where a customer is covered by auto insurance only, and churn (state 3) meaning a customer drops all insurance coverage and leaves the company. If we adopt the first-order MLR model, then we need only consider two states of origin at time
 $(t-1)$
, namely full and partial-coverages (Figure 1 left panel). Since churn is an absorbing state, we do not model transition probabilities from this state. Following the notation in Equation (3.1), we have
 $r=\{1,2\}$
,
 $s=\{1,2,3\}$
, and
 $Q=3$
. On the other hand, if we adopt the second-order MLR model, then we will need to consider four potential states of origin, depending on whether the policyholder had full or partial-coverage at time points
 $(t-2)$
and
 $(t-1)$
(Figure 1 right panel). Following Equation (3.2), we have
 $q=\{1,2\}$
,
 $r=\{1,2\}$
, and
 $s=\{1,2,3\}$
. It is clear from Figure 1 that a larger number of parameters need to be involved in the second-order MLR model: after choosing the reference state, under a first-order Markov assumption, we have four sets of coefficients
 $\boldsymbol{\beta}_{rs}$
to model, while under a second-order Markov assumption we have eight sets of coefficients
 $\boldsymbol{\beta}_{qrs}$
to model.
4. Application to data from Wisconsin local government property insurance fund
We illustrate an application of multi-state customer churn analysis to commercial insurance data, using a data set publicly available from the Wisconsin Local Government Property Insurance Fund (LGPIF); see Frees et al. (Reference Frees, Lee and Yang2016), Shi and Yang (Reference Shi and Yang2018), Dong et al. (Reference Dong, Frees and Huang2022) among others for previous uses of the LGPIF data in actuarial science. The LGPIF is administered by the Wisconsin Office of the Commissioner of Insurance, with its overarching purpose being to make property insurance available for local government units. The LGPIF offers six coverages for policyholders to choose building and content (BC), contractor’s equipment (IM), comprehensive new vehicles (PN), comprehensive old vehicles (PO), collision new vehicles (CN), and collision old vehicles (CO). Since the last four coverages all represent the vehicle coverage, and also to ensure that there is sufficient data to model the transition probabilities reasonably well, we choose to combine the four vehicle coverages as a single coverage that we refer to simply as “Car” coverage. Only BC coverage is compulsory, while IM and Car coverages are optional for a policyholder.
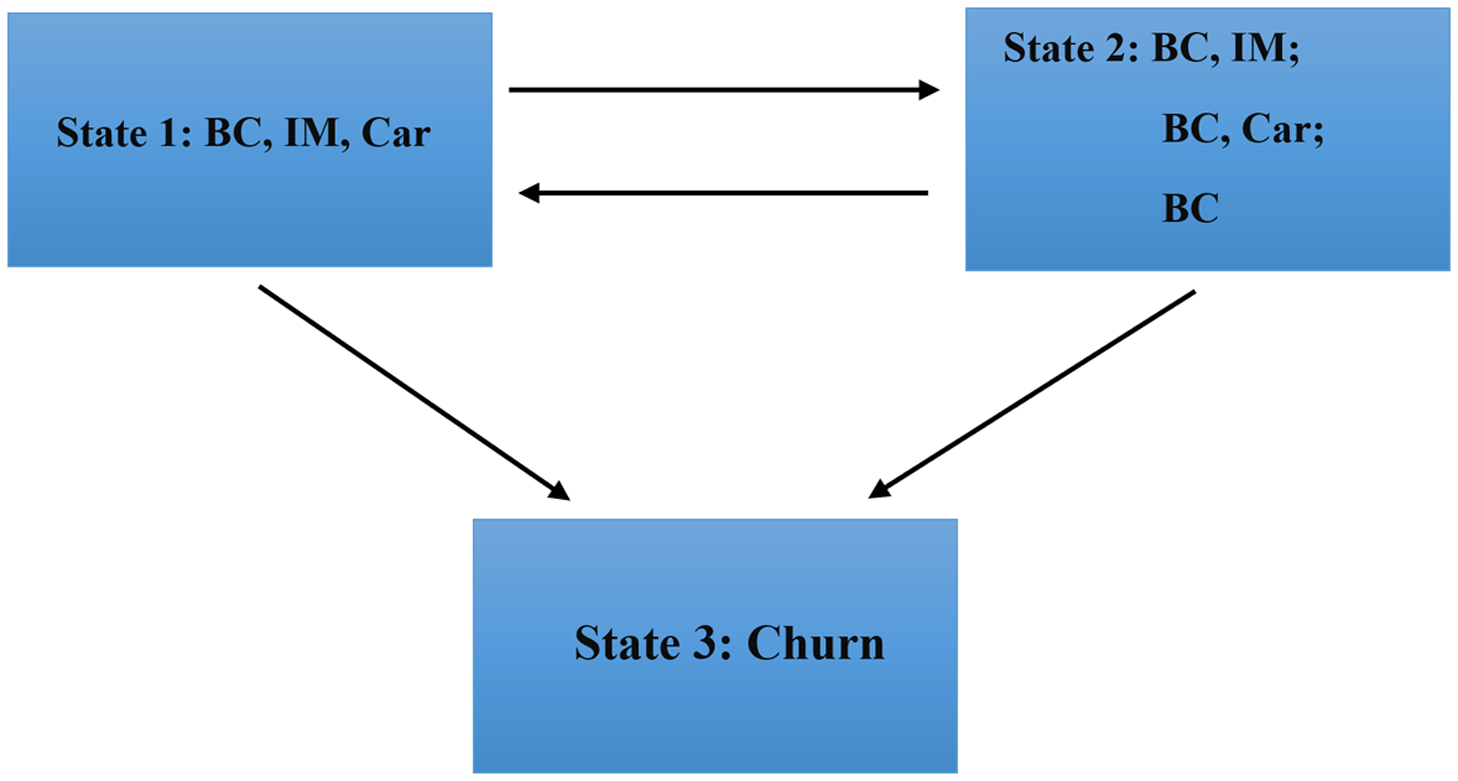
Based on the above, we set up a three-state transition framework for multi-state customer churn analysis, as exemplified by Figure 2. When a policyholder enters a contract, they can take either a full-coverage contract (state 1, which includes BC, IM and Car coverage) or a partial-coverage contract (state 2, which includes BC plus optional IM or Car coverage). Afterwards, if a policyholder does not adjust their combination of coverages, then the contract will be in the same state in the following period, that is, they stay in the same state. Alternatively, a policyholder may drop or add certain coverages without churning, which indicates a transition from state 1 to state 2 or vice versa. Finally, if a policyholder decides to cancel all the coverages in a contract, then the state of the contract will move to state 3, that is, will churn, which is the absorbing state. Note state 2, that is, partial-coverage, actually includes three types of contracts (Figure 2); again, the reason we collect these three forms of contracts into one state is to address data imbalance (a very small number of observations for some transitions) and subsequently to ensure that there is sufficient data to model all transition probabilities reasonably well. We refer the reader to Section 1 of Supplementary Material for a discussion of an expanded five-state transition framework as well as the issue of data imbalance in the LGPIF data.
A three-state transition diagram of the application to data from LGPIF. BC refers to building and content insurance, IM refers to contractor’s equipment insurance, while Car refers to vehicle coverage.

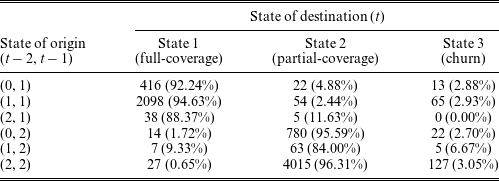
As part of our exploratory data analysis, Table 1 lists the second-order transition data and corresponding empirical transition probabilities from 2006 to 2013. As discussed in Section 3, although we will not model new policyholders’ behaviour, we list these new policyholders’ transitions (referred to as state “0” at time (
 $t-2$
)) in Table 1 to offer a complete picture of the data. From time
 $(t-2)$
to
 $(t-1)$
, there are more observations in the states of origin (1, 1) and (2, 2), that is, staying in the same state, compared to changing states. More importantly, we notice that observations staying in the same states over the past two years have higher empirical transition probabilities of staying in the same state next year. For example, one can compare the empirical transition probabilities based on state of origin (1, 1), that is, having full-coverage in the past two years, with those based on state of origin (2, 1), that is, having partial-coverage and then full-coverage in the past two years. The empirical transition probability of moving from state of origin (1, 1) to state 3, that is, churn, is 2.93%, while the empirical transition probability of moving from state of origin (2, 1) to churn is 0%. Furthermore, the empirical transition probability of moving from state of origin (1, 1) to state 2, that is, partial-coverage, is 2.44%, while the empirical transition probability of moving from (2, 1) to partial-coverage is 11.63%. That is, policyholders who stayed with full-coverage over the past two years are more likely to churn and less likely to move to partial-coverage, relative to policyholders who moved from partial to full-coverage in the past two years. Overall, these initial results suggest that a policyholder’s coverage at time
 $(t-2)$
plays an important role in affecting their behaviour, beyond that seen at time
 $(t-1)$
. With this in mind, we decide to build a second-order MLR model, as exemplified by Equation (3.2), to analyse multi-state customer churn in the LGPIF data.
Second-order transition counts and empirical transition probabilities in per cent (in parentheses) from 2006 to 2013. In each row, the sum of counts represents the total observations in the corresponding state of origin.

Finally, it is important to highlight that we did not consider orders higher than two in our application, primarily because the LGPIF did not contain sufficient information to do so, that is, the data did not contain enough time points or observations such that we should feasibly fit a higher-order MLR model effectively. For life insurance companies that do have long-term policyholders’ data available (say), then an exploration of subsequent higher-order analysis is warranted.
4.1. Review of variables in customer churn analysis
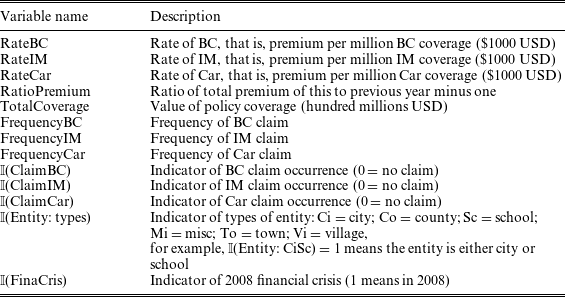
In Table 2, we summarise the explanatory variables that we will consider in our multi-state customer churn analysis of the LGPIF data based on a combination of our background knowledge and exploratory data analysis (see also the discussion at the beginning of Section 4.2). These explanatory variables are commonly used in customer churn analysis in general insurance, and we refer the reader to Section 2 of the Supplementary Material for a discussion on these variables. Note in particular that we included an indicator variable for the 2008 financial crisis, because it was one of the most important global financial events within the training set and statistically highly significant. As part of our exploratory data analysis for the LGPIF data, we examined several other continuous economic growth variables such as GDP and federal rate, but found that none of them were statistically significant predictors for the transition probabilities. Also, note that since the LGPIF is a commercial insurance fund targeting government units as policyholders, then variables commonly seen and used in personal insurance such as age and gender are not present for inclusion in our analysis.
Variable description for our application to the LGPIF data.

Note: All the variables take the values at time
 $(t-1)$
, when considering the transition probability from time
 $(t-1)$
to t.
For the purposes of this paper, we treat all variables as strictly exogenous, and we do so to be consistent with the existing literature on traditional customer churn analysis (see for instance Guillen et al., Reference Guillen, Parner, Densgsoe and Perez-Marin2003; Brockett et al., Reference Brockett, Golden, Guillen, Nielsen, Parner and Perez-Marin2008, among others). We refer the reader to Section 3 of the Supplementary Material for a discussion on exogeneity in the context of general insurance and leave the issue of treating certain variables as sequentially exogenous/endogenous for future research. It is also important to point out that not all of the variables will be used in our final model. Moreover, we will allow different sets of explanatory variables to drive the transition probabilities with different states of origin, that is, the dependence on the subscripts (q,r) in the covariates
 $\boldsymbol{{x}}_{i,t-1,qr}$
in Equation (3.2). On the explanatory variables themselves, we calculate and use rates (premium per coverage) instead of using premiums directly for each type of coverage, as we found that the premium of a contract was highly affected by the coverage size of the contract. Since the size of coverage in commercial insurance is relatively large and varies from year to year, then we want to separately study the effect of rate variation and coverage variation on the transition behaviour of policyholders.
4.2. Second-order MLR model: Estimated effects
We fitted second-order MLR models to the LGPIF data from years 2006 to 2012, and left year 2013 as a holdout set that we will use later on to assess out-of-sample performance in Section 5. We performed exploratory data analysis to assess which explanatory variables to include as part of
 $\boldsymbol{{x}}_{i,t-1,qr}$
. In particular, we started with all variables listed in Table 2 and chose the final set of covariates as the set of explanatory variables which were statistically significant at the 10% level for at least one transition probability (either to partial-coverage or to churn, where full-coverage was set to be the reference state). Note from Table 2, there were only a handful of observations with states of origin equal to (2, 1) and (1, 2). As such, we restricted the number of explanatory variables to two for the transitions with these two states of origin, so as to avoid (excessive) overfitting. We used the multinom function from R package nnet (Venables and Ripley, Reference Venables and Ripley2002) to fit the second-order MLR model. Note the standard errors calculated are non-robust, as the function does not support calculating robust standard errors currently; we refer the reader to Section 4 of Supplementary Material for the same analysis using Stata 17, which also returns robust standard errors.
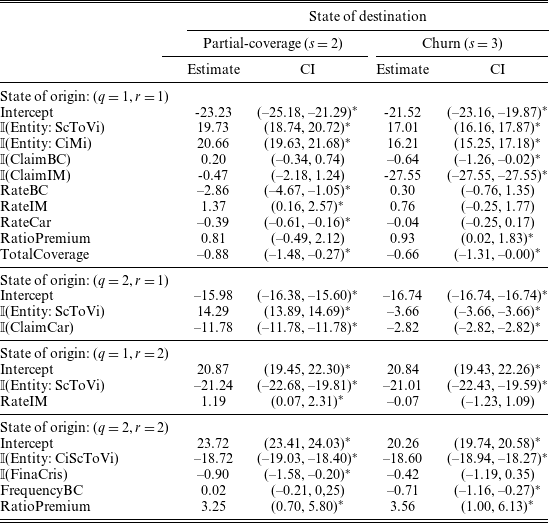
Table 3 presents the estimated coefficients and corresponding 90% confidence intervals for the explanatory variables included in the fitted second-order MLR model. From the estimated MLR model, we observe that both the set of important explanatory variables and the resulting effect sizes differed greatly depending on the state of origin. This in turn reflected a notion that the second-order states of origin play an important role in distinguishing between different transition probabilities, and we discuss the results for each of the four states of origin separately below.
The second-order MLR model estimates with 90% confidence interval in parentheses.

Note: *confidence intervals excluding zero.
For policyholders with full-coverage in the previous two time points, that is, state of origin equal to (1, 1), there was statistically clear evidence of an association between the likelihood of transitioning to partial-coverage and the three coverage rates. In particular, a higher rate of IM was related to a higher transition probability to partial-coverage, while higher rates of BC and Car were associated with a lower transition probability to partial-coverage. Both the occurrence of BC claim and the occurrence of IM claim significantly reduced the likelihood of churn, while the occurrence of BC claim suggested that the customer was likely to drop some coverage (moved to the partial state). That is, we found that different claim types exhibited different effects on transition probabilities, which is an interesting new insight relating to the role of claims in customer churn analysis. The slopes for TotalCoverage suggested that big buyers (policyholders with large coverages) were less likely to move to either partial-coverage or churn compared to small buyers. Finally, policyholders who experienced larger total premium increases in the previous two years (i.e., positive values of RatioPremium) were significantly more likely to churn the next year, although there was no statistically clear evidence of a similar effect on the likelihood of transitioning to partial-coverage.
For policyholders who went from partial-coverage to full-coverage over the previous two time points, that is, state of origin equal to (2, 1), the occurrence of Car claim was found to significantly increase the probability of staying in full-coverage. Also, the three coefficients of the transition to churn were all negative, which suggested the predicted probabilities of this type of transition would always be zero. This result was not surprising given such transitions were not found in the training set in the first place; see the transition from (2, 1) to churn in Table 1.
For policyholders who dropped from full-coverage to partial-coverage over the previous two time points, that is, state of origin equal to (1, 2), there was statistically clear evidence of an effect of a higher rate of IM on the transition probability to partial-coverage, and moreover, the magnitude of this effect was similar to that of policyholders with state of origin (1, 1).
Finally, for policyholders with partial-coverage over the previous two time points, that is, state of origin equal to (2, 2), a large number of BC claims was found to be associated with a significantly lower probability of churn (but no effect on the likelihood of transitioning to partial-coverage). Also, policyholders who experienced total premium increases in the previous two years were significantly less likely to obtain full-coverage in the following year. Finally, we found that the 2008 financial crisis only presented a statistically clear negative effect for this particular group of policyholders, as it strongly decreased their likelihood of retaining partial-coverage in the following year.
For all policyholders, we found that entity type played a statistically significant role in driving the transition probabilities, although this differed depending on the precise state of origin. For example, the entity being equal to either school, town, or village, that is,
 $\mathbb{I}(\text{Entity: ScToVi}) = 1$
was found to be associated with a significantly higher probability of churn when the state of origin was (1, 1), but a significantly lower probability of churn when the state of origin was (2, 1), compared to the corresponding reference entity type.
Finally, it should be noted that several of the statistically significant effects estimated from the MLR model were distinctly large (Table 3). This potentially reflected a level of overfitting by the second-order MLR model to the LGPIF data. For instance, the estimated pair of effects for Entity(ScToVi) when the state of origin was (1, 2) was approximately
 $-21$
. This large negative coefficient was attributed to the fact that in the LGPIF training data, when the entity type was equal to a school, town, or village, all policyholders with a state of origin (1, 2) retained full-coverage.
The large estimated effects in this application arise more as a feature of the data rather than an actual problem with the MLR model. That is, the sample size of the LGPIF data was not overly large, and its time horizon (2006–2012) was not long enough to observe more actual transitions. Importantly, we expect this data problem to be neither common nor serious for most multi-state customer churn analyses, given the majority of insurance companies commonly have (much) more accumulated years of longitudinal data. From a modelling perspective, it is possible to apply regularisation penalties, for example, the lasso, ridge or bias-correction-type penalties, to shrink these coefficients away from large values and hence potentially avoid an excessive degree of overfitting (Madigan et al., Reference Madigan, Genkin, Lewis and Fradkin2005), while also ensuring that overall conclusions in terms of statistically significant effects are retained. We leave such extensions of the MLR model for future research, as the main focus of this paper is on illustrating MLR models as a modelling technique for multi-state customer churn analysis. For readers interested in the goodness-of-fit tests of the fitted MLR model, we provide the results of these in Section 5 of the Supplementary Material.
In summary, for the LGPIF data, we have found that premium information, claim experience, and contract information play statistically significant roles in driving multi-state customer transition probabilities. It is important to highlight that the marketplace we examined in the article has not been previously examined in the actuarial customer churn literature, that is, the LGPIF is a special line of commercial insurance with its overarching purpose being to make property insurance available for local government units. Government units differ from personal customers, this is a smaller marketplace with fewer insurance providers, and there may not be readily available alternatives which government customers can choose from (the original motivation for establishing the fund). This lack of availability will certainly affect policyholders’ decisions to leave the fund, suggesting that the results from this paper may not be consistent with other studies that have focused on personal insurance.
At the same time, our analysis offers a more complete picture of the different roles that factors play in determining customer behaviour beyond simply whether policyholders churn or not. Indeed, understanding the drivers of customer transitions behaviour can assist insurance companies with marketing campaigns, for example, pushing customers to concentrate all their insurance policies in the same company. For example, the estimation result of RatioPremium in Table 3 suggests that a small discount (leading to a negative value of RatioPremium) may attract policyholders to stay with the insurance company or even purchase additional coverages. An open question for future research is how to use the multi-state customer churn analysis to identify target customers for marketing campaigns and design optimal marketing strategies for insurance companies. Note also that the effects and scope of exploratory variables considered depends on the second-order state of origin, which in turn sheds light on the importance of a higher-order analysis.
4.3. Second-order MLR model: Visualisation
We examine two types of figures which can be used to better understand the effects of explanatory variables in MLR models, namely conditional effect figures and average marginal effect figures. Briefly, a conditional effect plot quantifies the estimated effect for an individual policyholder (micro-perspective), while an average marginal effect plot quantifies the effect for an entire population of policyholders (macro-perspective).
A conditional effect is based on varying a single predictor (the focal variable) while fixing all the other variables at some values, such that it quantifies the effect of the focal variable and ignores how it correlates (and thus might hence) with other variables in practice. As a result, in the context of multi-state customer churn analysis, conditional effect plots are useful for interpreting the model results from the perspective of an individual policyholder. The insurer can draw conditional effect figures by setting the “condition” to reflect the characteristics of a target policyholder, and thus understand the role a focal variable plays in triggering this policyholder’s transition behaviour. This in turn can assist the insurer, say, in developing a targeted strategy to maintain a policyholder’s loyalty. By default, when varying the focal variable in a conditional effect plot, we can fix all numerical variables at their mean values, and fix all factor variables at their reference levels (say).
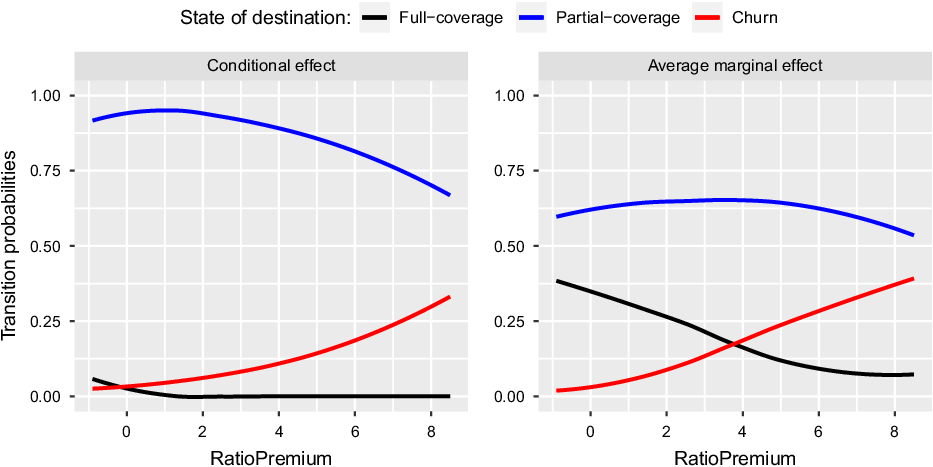
To illustrate the use of a conditional effect plot, we consider the second-order MLR model fitted above to the LGPIF data and target a city entity (policyholder) with partial-coverage over the past two years, that is, state of origin equal to (2,2). In this case, there are only four exploratory variables affecting transition probabilities for this policyholder; see Table 3. Suppose we want to specifically study how the ratio of total premiums affects this policyholder’s transition behaviour. From the resulting conditional effect plot (Figure 3 left panel), we observe that, generally speaking, if that target policyholder experiences a larger total premium increase in the previous two years (i.e., positive values of RatioPremium), then the likelihood of transitioning to full-coverage and even maintaining partial-coverage decreases, as that targeted policyholder is more likely to churn. This full picture is not immediately obvious when we only examine the corresponding estimated effects in Table 3: the estimated coefficients of RatioPremium to partial-coverage and to churn are 3.25 and 3.56, respectively. However, as discussed in Section 3 these coefficients explicitly quantify the effect of the ratio of premiums on the log-odds relative to full-coverage and thus only offer an idea of the relative changes in transition probabilities. By contrast, from the conditional effect plot we see that, in fact, the probability of transitioning to partial-coverage is concave in shape as a function of RatioPremium, while the probability of churn is monotonically increasing.
The effect of RatioPremium on transition probabilities: conditional effect (left panel) for a city entity with state of origin equal to (2, 2), compared to an average marginal effect (right panel).

As an alternative to conditional effects, the average marginal effect calculates each policyholder’s effect of transition probabilities from varying a focal variable and then averages this across the resulting effect estimates among all policyholders. Consequently, this takes into account how variables are naturally correlated with each other as based on the data (Leeper, Reference Leeper2017). Average marginal effect figures are useful for interpreting the fitted MLR model at a population level, that is, macro-perspective for all policyholders. That is, the insurance company can construct average marginal effect plots with different focal variables to understand how the changes affect the transition probabilities across all policyholders currently holding contracts and in turn develop general as opposed to personalised strategies to maintain customer loyalty. As an example of this, and to contrast with the conditional effect plot, we again consider the ratio of premiums as a focal variable, but this time study its average marginal effect among all policyholders in the LGPIF data. The resulting plot is shown in the right panel of Figure 3, from which we see that the probability of transitioning to partial-coverage is (also) concave in shape as a function of premium ratio, while the probability of churn is (also) monotonically increasing. However, the probability of transitioning to partial-coverage (relative to churn) in the average marginal effect plot is consistently lower compared to that in the conditional effect plot. This difference in probability curves indicates the difference of effects from a focal variable to an individual policyholder versus all policyholders. Notice also that in Table 3, the premium ratio was only included to model the transition probabilities from states of origin (1, 1) and (2, 2), that is, policyholders who had the same level of coverage across the two previous years. Interestingly, this alone suffices to induce an effect across the broader population of policyholders with the insurance fund, and the average marginal effect plot of Figure 3 reflects this.
4.4. Comparing multi-state and traditional customer churn analysis
As a comparison between multi-state and traditional customer churn analysis for data from the LGPIF, we use an example based on calculating customer lifetime value (CLV). At the end of each year before the renewal date, an insurer may construct models as part of their customer churn analysis, which are then used to calculate policyholders’ CLV, the discounted future income stream derived from acquisition, retention, and expansion projections and their associated costs (Gupta et al., Reference Gupta, Lehmann and Stuart2004). As a simple illustration of this, we consider an “average” policyholder for a two-year time horizon, defined as a customer whose numerical explanatory variables are set equal to the mean values from the data, and whose factor variables are set equal to their modal categories. All exploratory variables are then fixed for two years. We further assume that the policyholder has had full-coverage over the past two years, that is, state of origin equal to (1, 1), and we use customer churn models to assess their behaviour over the next two years. For readers interested in the precise values of exploratory variables, we refer to Section 6 of Supplementary Material. We also point out that all settings in this section were purposefully designed to make the illustration relatively simple yet insightful. In future applications of the proposed MLR model for multi-state customer churn modelling, it is perhaps recommended to adopt richer techniques such as generalised linear models or machine learning techniques to predict claims and interest rates for the CLV calculation.
We calculate the CLV of this average policyholder for the next two years via multi-state customer churn modelling and traditional customer churn modelling. The formula for the CLV of a policyholder is given by
 $\text{CLV} = \sum_{t=1}^T \text{P}_t(E_t-A_t) / (1+i_t)^t$
, where
 $E_t$
and
 $A_t$
denote the revenue and expenses respectively for a customer at time t,
 $P_t$
denotes the probability that the customer still has a valid contract up to time t, and
 $i_t$
is interest rate at time t. For illustrative purposes, we assume
 $E_t$
is the premium paid in dollar value by the policyholder at time t, and that it is fixed at the state-specific average value in the data set. Moreover,
 $A_t$
is the expected claim cost in dollar value from the policyholder after paying deductibles, and it is also fixed at the state-specific average value in the data set. We fix
 $i_t$
at 1.78%, that is, the annual average federal funds rate from 2006 to 2012 in the LGPIF data. Table 4 lists the values of these quantities according to the state of the policyholder. For a policyholder in full-coverage, the revenue is higher than the expense. However, the revenue is lower than the expense for a policyholder in partial-coverage.
CLV calculation: state-specific revenue, state-specific expense, and interest rate.

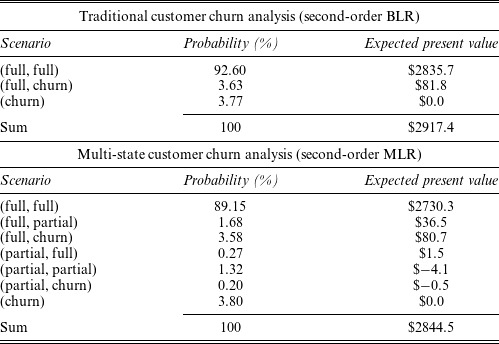
For traditional customer churn analysis, we assume the insurance company will build a second-order binary logistic regression (BLR) model to predict the probability of churn for this policyholder in the next two years, while for multi-state customer churn analysis, we use the second-order MLR model fitted in Section 4.2. We refer the reader to Section 7 of Supplementary Material for the illustration of the second-order one-versus-all BLR models in the context of multi-state customer modelling. Importantly, multi-state customer churn analysis focuses on all types of transition among states (see Figure 2), while traditional customer churn analysis only focuses on the transition to churn. Consequently, there are three scenarios to consider if the insurer performs traditional customer churn analysis, but seven scenarios to consider if the insurer performs multi-state customer churn analysis. We refer to Section 8 of Supplementary Material for the visualisation of all scenarios for traditional and multi-state customer churn analysis.
Table 5 presents results of CLV calculations comparing traditional and multi-state customer churn analysis. In the case of the former, the CLV over the three possible scenarios was $2917.4. In the latter, we notice that when the (average) policyholder’s future path is to partial-coverage for both years or to partial-coverage followed by churn, the expected present value is negative. This is because when the policyholder takes partial-coverage (in state 2), the revenue is less than the expense; see Table 4. Across the seven possible scenarios, the CLV of the policyholder calculated by multi-state customer churn analysis was
 $\$$
2844.5.
Scenarios of future path and CLV calculation: traditional customer churn analysis versus multi-state customer churn analysis.

Through Table 5, we can see the difference in calculating CLV between traditional versus multi-state customer churn analysis, which in case ends up being
 $\$$
72.9. In practice, customer lifetime is commonly longer than two years, and so it is likely that an even larger difference in CLV between the two approaches would be observed. Furthermore, while we have considered an “average” policyholder, insurers are typically more interested in those who pay a lot of premiums annually, that is, big buyers. The difference in CLV between the two approaches will again likely be larger for this select group, relative to what we saw in this example. To summarise, because multi-state customer churn analysis considers all possible transitions among states when calculating CLV, and since policyholders in different states naturally have different values for insurers, then we believe such an analysis will generally improve the accuracy of CLV calculations. Ultimately, this is relevant to the profitability of insurance companies (Neslin et al., Reference Neslin, Gupta, Kamakura, Lu and Mason2006), as it helps them better distinguish valuable customers and trivial customers.
5. Assessing out-of-sample performance
Using the LGPIF data, we assessed the out-of-sample prediction performance of the proposed second-order MLR model, and compared it with several other models for predicting customer transition/churn rates. In particular, we also considered a first-order MLR model as formulated in Equation (3.1), along with a first-order and a second-order one-versus-all BLR models (see Section 7 of the Supplementary Material). We also included two non-parametric methods that are widely used in traditional customer churn analysis (He et al., Reference He, Xiong and Tsai2020), namely gradient boosting machines (GBMs) and support vector machines (SVMs). As both can be applied for multi-class classification problems also, then they can be straightforwardly adapted for use in multi-state customer churn analysis. We refer to Section 9 of Supplementary Material for details of applying GBMs and SVMs to the LGPIF data.
All methods were fitted to LGPIF data from years 2006 to 2012, and out-of-sample validation was performed on data in year 2013. In terms of assessing performance, a widely used evaluation metric in traditional customer churn analysis is
 $\text{error rate} = (1 - \text{accuracy})$
, which is defined as the percentage of incorrectly classified observations in the test set (see for example Bolancé et al., Reference Bolancé, Guillen and Padilla-Barreto2016; Loisel et al., 2019; Scriney et al., Reference Scriney, Nie and Roantree2020). However, a major disadvantage of error rate is that it is not well suited to imbalanced data with rare events (with imbalanced classes, it is easy to get a low error rate without actually making useful predictions, Morrison, Reference Morrison1969), and this is the case here with the LGPIF data, as exemplified in Table 1. As such, we require alternatives to error rate, and here we consider the area under the receiver operating characteristic curve (AUC, Cortes and Mohri, Reference Cortes and Mohri2003). The AUC is better suited for assessing classification accuracy in imbalanced data, since it is independent of the choice of classification threshold and avoids choosing the largest estimated probability for the multi-class classification; see Hand and Till (Reference Hand and Till2001) and He and Ma (Reference He and Ma2013). In this paper, we calculate both multi-class AUCs and the standard binary-class AUCs for model assessment. Additionally, we calculate the top-decile lift, which is a well-established evaluation metric in traditional customer churn research of marketing, and is noted for its ability to target critical customers (Pendharkar, Reference Pendharkar2009; De Bock and Van den Poel, Reference De Bock and Van den Poel2011). We demonstrate how to make use of the top-decile lift for multi-state customer churn analysis.
Note we compare different models’ predictive power using widely accepted metrics, namely AUCs and the top-decile lift. But we also acknowledge they are not always the best choices depending on the specific setting. For instance, Guelman et al. (Reference Guelman, Guillén and Pérez-Marn2012) suggest that insurers should develop models and metrics to instead identify the target customers who are likely to respond positively to a customer retention campaign. Designing and choosing appropriate metrics in multi-state customer churn analysis for insurers, in order to maximise their utility, is an interesting topic that we leave for future research.
5.1. AUC
While AUC is well-established for assessing binary classification, here we consider two other types of AUC for multi-class classification problems, namely micro-AUC and macro-AUC (Wu and Zhou, Reference Wu and Zhou2017). Macro-AUC is derived from the receiver operating characteristic curve based on macro-average true positive and false positive rates (TPR and FPR), where the macro-average is defined by calculating TPR and FPR independently for each class and then taking the average. Because macro-average quantities treat all classes equally, then they better reflect the statistics of the smaller classes and so are more appropriate when performance on all the classes is equally important. By contrast, micro-AUC is derived from the receiver operating characteristic curve based on micro-average TPR and FPR. The micro-average pools the contributions of all classes before constructing TPRs and FPRs. As such, micro-average quantities are dominated by the more frequent class.
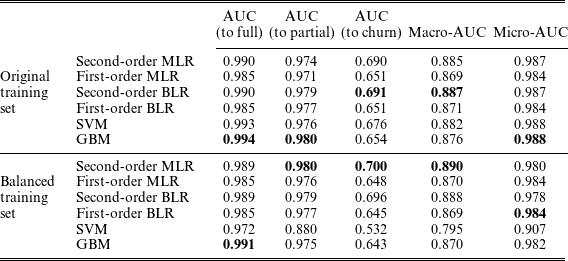
Table 6 presents the binary AUCs for each type of transition, along with the micro- and macro-AUCs for all six methods considered. Additionally, we consider applying the methods both to the original training set and to a balanced training set constructed through oversampling. Since the main aim of this paper is not about optimising a model’s predictive performance, then we used the upSample function from R package caret (Kuhn, Reference Kuhn2021) to oversample the training set based on the state of destination in order to deal with data imbalance issue. We ensured the numbers of transitions with different states of destination (full-coverage, partial-coverage, and churn) were equal by adding additional samples to the minority transitions with replacement. In contrast to oversampling, undersampling is also widely used in customer churn analysis when a data set includes a large number of records; see Scriney et al. (Reference Scriney, Nie and Roantree2020). However, as discussed in Section 4, the LGPIF data do not contain enough time points or observations for this to be relevant. Note for each of the BLR and MLR models, we used explanatory analysis to determine the appropriate regression forms based on the original training set (explanatory variables were chosen if they were statistically significant at the 10% level for at least one transition probability). We then used these forms in the models fitted to the balanced training set. For GBMs and SVMs, we tuned the relevant hyperparameters using the original training set and the balanced training set separately.
Out-of-sample validation: AUCs of six models (top: original training set; bottom: balanced training set).

For methods fitted to the original training set (Table 6 top half), there is no single-best method across all AUCs. The second-order BLR model had the highest AUC to churn and macro-AUC, which indicates that it performed well at predicting the likelihood of customer churn specifically. If we compare the two second-order models with the two first-order models, then the former was consistently better than the latter in terms of AUC. This further supports the notion that, for MLR models, a second-order Markov assumption leads to more accurate classifications of customer transition. The GBM had the highest AUC to full-coverage, AUC to partial-coverage, and micro-AUC. When we compare methods fitted in the balanced training set (Table 6 bottom half), the second-order MLR model had the highest AUC to partial-coverage, AUC to churn, and macro-AUC, while GBM had the highest AUC to full-coverage. Again, if we compare the two second-order models with the two first-order models, then the former had higher AUCs than the latter in all cases except micro-AUC.
Lastly, when comparing methods across the original and balanced training sets, we observe that the second-order models tended to achieve higher AUC to churn in the balanced training set. However, the overall prediction performance of the other four models became worse in the balanced training set compared to the original training set. This suggests that, at least for the LGPIF data, balancing the data set for second-order models had the potential to improve their prediction performance.
5.2. Top-decile lift
Top-decile lift is commonly used in customer churn analysis to focus on the most critical group of customers and their churn risk (see e.g., Neslin et al., Reference Neslin, Gupta, Kamakura, Lu and Mason2006; Holtrop et al., Reference Holtrop, Wieringa, Gijsenberg and Verhoef2017; Devriendt, Berrevoets and Verbeke, Reference Devriendt, Berrevoets and Verbeke2021). Broadly speaking, those with the highest 10% predicted churn rates in a test set present the riskiest customers and subsequently an ideal segment for targeting a customer retention programme. Top-decile lift is then calculated as the proportion of churners in this riskiest segment, divided by the proportion of churners in the whole test set. It thus acts as a practical measure to compare different methods for predicting customer churn by assessing their relative abilities to identify the set of riskiest customers. Put another way, a predictive method with a high top-decile lift gives confidence to insurers that they can still reach a majority of all potential churners by targeting the top 10% riskiest segment only (Neslin et al., Reference Neslin, Gupta, Kamakura, Lu and Mason2006).
We extend the idea of top-decile lift to multi-state customer churn analysis. That is, we calculate top-decile lift and target the corresponding top 10% riskiest segments for transitions with different states of destination. In detail, for a given state of destination s, we firstly identify the 10% riskiest segment, that is, the policyholders with the highest 10% of predicted transition probabilities to that state of destination. The top-decile lift is then given by
 $\text{TDL}_{s} = \hat{\pi}^{10\%}_{s} / \hat{\pi}_{s}$
, where
 $\hat{\pi}^{10\%}_{s}$
is the proportion of the actual transitions to state s in the corresponding 10% riskiest segment, and
 $\hat{\pi}_{s}$
is the proportion of the true transitions to state s across the entire test set. A higher value of top-decile lift reflects a better capacity to predict the riskiest policyholders for a particular type of transition.
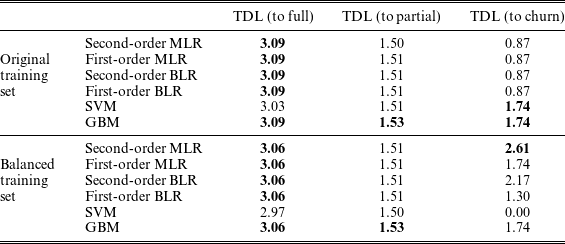
Table 7 presents the results from calculating top-decile lifts to full-coverage, partial-coverage, and churn in both the original and balanced training sets of the LGPIF data. GBM and SVM had the highest top-decile lift to churn in the original training set, while the second-order MLR model had the highest top-decile lift to churn in the balanced training set. Both first- and second-order MLR models performed equivalently in terms of top-decile lifts to churn in the original training set, but when fitted in the balanced training set, the second-order MLR model performed noticeably better than its first-order counterpart. A similar conclusion can be drawn if we compare first- and second-order BLR models. This again supported the use of the second-order Markov assumption for customer churn analysis in the LGPIF data.
Out-of-sample validation: top-decile lifts of six models (top: original training set; bottom: balanced training set).

Finally, when we compare Tables 6 and 7, we can see that balancing the training set had the potential to improve a model’s out-of-sample predictive performance, especially for predicting transitions to churn. This reflected the fact that, in the original training set, the transitions to churn were in the minority and dominated by transitions to full- and partial-coverage (Table 1). When we balanced the original training set through oversampling, we oversampled the transitions to churn, and so their corresponding weight was increased when fitting models, thus generally improving out-of-sample predictions for this minority class.
6. Conclusion
In this paper, we have proposed the concept of multi-state customer churn analysis for commercial insurance. To study policyholders’ behaviour beyond just churn/not churn and across multiple periods, we develop MLR models with a second-order Markov assumption. Through the use of such models, which favour interpretability over predictive power, insurance companies can gain a complete picture of how a policyholder’s past states affect their decision to move to the next state, as well as the complex relationships between transition probabilities and various explanatory variables related to premium information, claim information, and contract type. To the best of our knowledge, this is the first paper to employ a second-order MLR model for customer churn research in actuarial science.
We present an application of multi-state customer churn analysis by fitting second-order MLR models to investigate policyholders’ behaviour on data from the Wisconsin LGPIF. Empirical analysis demonstrates that explanatory variables play differing roles in triggering different types of transitions and this in turn leads to a more nuanced understanding of how a policyholder’s previous history and attributes are associated with their decision to future behaviour. We present conditional and average marginal effect plots to interpret the estimated effects on the probability scale. Insurers can intuitively understand the effect of a focal variable on different types of transitions for a specific policyholder using the former, while the latter allows the study of a broader customer group or population of policyholders. We use the example of an average policyholder to illustrate the difference in calculating customer lifetime value between multi-state and traditional customer churn modelling, the latter based on one-versus-all binary logistic regression (BLR) models. Because policyholders in different states naturally have different values for insurers, we believe that multi-state customer churn analysis will improve the accuracy of customer lifetime value calculation for insurers as a whole.
Although prediction is not the primary aim of this paper as a whole, the second-order MLR model was shown to predict relatively well. Specifically, compared to a first-order MLR model, BLR models, GBMs and SVMs, the proposed second-order models performed strongly in terms of out-of-sample AUCs and top-decile lift. We also find that balancing the data through oversampling the minority groups tended to improve the predictive performance of most methods, although the improvement for second-order models was more substantial compared to their first-order counterparts in the LGPIF data. Overall, our findings open up a new way of perceiving and understanding customer behaviour in the insurance market and shed light on the importance of multi-state customer churn modelling.
The multi-state, multi-period modelling used in this paper presents a new approach to churn modelling, and so naturally, there are several variations that warrant further investigation. First, we have implicitly treated all variables as strictly exogenous, which means that we assume all variables are completely unaffected by the customers’ state transitions in the past, present, and future. For future research, variables can be treated as sequentially exogenous, which indicates that current or future customers’ state transitions would cause variables to change in the future. For example, premium and claim could be treated as sequentially exogenous variables, an approach that may provide insights into contractual moral hazard and adverse selection. Second, we assume that the effect of each covariate is fixed across all time points. Future research could examine the use time-varying coefficients instead for multi-state customer churn analysis, perhaps building on the dynamic survival model approach of Guillen et al. (Reference Guillen, Nielsen, Scheike and Pérez-Marn2012). Allowing for time-varying coefficients would enhances the flexibility of the model and potentially improve prediction performance. However, it would generally require more data to estimate than fixed coefficients models, noting also that the records in our motivating LGPIF data are in discrete time, in contrast to continuous time approach of Guillen et al. (Reference Guillen, Nielsen, Scheike and Pérez-Marn2012). Third, the assumption that all policyholders are independent is not only questionable in our application but also in studies of personal homeowners and automobiles where things being insured that is, houses and cars, are close to one another, sharing common environmental hazards such as hail, windstorm, and so forth. Some research has been being done to accommodate these dependencies, such as the spatial autocorrelation approach (Brechmann and Czado, Reference Brechmann and Czado2014) and the more recent marked point process approach (Shi et al., Reference Shi, Fung and Dickinson2022). Both of these, among others, may serve as valuable reference points for relaxing such assumption in future developments of multi-state customer churn modelling.
Fourth, if prediction is the primary goal of a customer churn analysis, then a better-performing classifier can be obtained from a balanced sample with appropriate sampling techniques. Future research could examine the use of bias correction methods such as intercept correction and weighting correction (Lemmens and Croux, Reference Lemmens and Croux2006), along with regularisation and feature selection techniques (e.g., extending the work of Devriendt et al., Reference Devriendt, Berrevoets and Verbeke2021, to support higher-order MLR models). Fifth, for higher-order MLR models, the value of order can be regarded as a hyperparameter that (also) needs to be tuned for optimising the predictive performance. In practice though, building higher-order models (whether they be parametric or more machine-learning based techniques) ideally requires a large data set with many time points, and demands close collaboration between academia and industry. Finally, there are a plethora of advanced multi-class classification models available in the machine learning literature, such as convolutional neural networks and XGBoost, which have already been used in traditional customer churn analysis (Loisel et al., 2019; He et al., Reference He, Xiong and Tsai2020). Applying these to build higher-order models for multi-state customer churn analysis presents an important and challenging avenue for future research.
Acknowledgments
FKCH was supported by an Australian Research Council Discovery Early Career Research Award DE200100435.
Supplementary Material
To view supplementary material for this article, please visit http://dx.doi.org/10.1017/asb.2022.18.