

1. Introduction
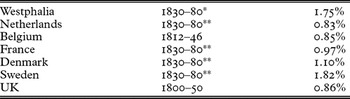
Westphalia's agricultural development began to accelerate during the last third of the eighteenth century. In the five decades from 1830 to 1880, Westphalia's agricultural growth accelerated to 1.75 per cent per annum. Most western and northern European countries showed significantly lower growth rates (Table 1). The agricultural upswing occurred in an environment of pre-industrial agriculture without changing farm structure, which was dominated by family farms during the whole period. However, the Ruhr, an area that mostly belonged to the Prussian province of Westphalia, quickly industrialised and evolved into the largest European urban-industrial agglomeration after 1840. In the period under consideration, no other European region experienced a stronger expansion of its food demand.
Annual agricultural growth in western and northern Europe (constant prices)

Sources: Westphalia: Table 3; The Netherlands: Smits and Van Zanden Reference Smits and Van Zanden2000, pp. 225–36; Belgium: Goosens Reference Goosens1992, p. 259; France: Lévy-Leboyer and Bourguinon Reference Lévy-Leboyer and Bourguignon1985, pp. 327–30; Denmark: Johansen Reference Johansen1985, pp. 395–6; Sweden: Krantz and Schön Reference Krantz and Schön2007, pp. 31–2; UK: Allen (Reference Allen, Floud and McCloskey1994) re-estimated by Turner, Beckett and Afton Reference Turner, Beckett and Afton2001, pp. 22–3.
Notes: Output based on averages for several years: *1822/35 and 1878/82, **1828/32 and 1878/82.
The five decades between 1830 and 1880 formed a distinguishable period of agricultural growth in Westphalia. During this ‘liberal period’, there was for the first time the creation of a domestic market in Westphalia as a result of rapid urbanisation, transport revolution and far-reaching trade liberalisation. After a price slump during the 1820s, the agricultural price level rose steeply until the 1870s, forming the ‘golden age’ of Westphalian, if not German, agriculture (Abel Reference Abel1966, pp. 253–5; Kopsidis Reference Kopsidis1996, pp. 527–37). Additionally, designed to abandon the Grundherrschaft (manorial system), the Prussian agrarian reforms did not start in Westphalia before 1829. The diffusion of new science-based industrial inputs, such as chemical fertilisers or other technical achievements of the emerging age of modern growth in agriculture, began to have a deep impact on Westphalia's agriculture only after 1880.
Thus, Westphalia presents an appropriate example of how to analyse the effects of industrialisation on agricultural growth in the setting of pre-industrial peasant agriculture. However, the reasons for Westphalia's extraordinary agricultural growth during the five decades prior to 1880 have not yet been studied in detail. In order to fill this gap, the following questions will be investigated:
1. What were the sources of output growth in Westphalian agriculture between 1830 and 1880? Was growth caused by more intensive factor use or by technical change?
2. Given that technical change was a crucial factor of growth, which kind of technical change prevailed?
3. Which factors caused the development of total factor productivity (TFP) and determined its regional differences within Westphalia?
The following section discusses possible sources of growth. Special attention is paid to the peculiarities of growth in pre-industrial agriculture as well as to the recent debate about the driving forces of Europe's ‘first agricultural revolution’ (Grantham Reference Grantham1989, pp. 70–1) from the sixteenth to the nineteenth century. In the third section, economic, agricultural and demographic key indicators of the area under investigation are presented. Section 4 deals briefly with methodological aspects. Section 5 provides the key part of this article: the estimation of a translog production function and a regionally differentiated determination of the extraordinary dynamics of Westphalia's ‘first agricultural revolution’. After discussing Westphalian TFP growth from a European perspective in Section 6, a comparison with the preceding English agricultural revolution is provided in the conclusions.
2. Theoretical considerations and current state of research
According to the literature, until the end of the nineteenth century, changes in cultivation practices played a crucial role in accelerating agricultural growth in Europe (Federico Reference Federico2005, pp. 88–9). The diffusion of the ‘new husbandry’ led to unprecedented levels of labour and capital intensity per unit land. Farming intensified substantially. Land-saving technologies became increasingly important in compensating for or outweighing land scarcity. At least since the mid eighteenth century, they have dominated farming in western Europe. However, prior to 1870, it remains far from clear to what extent particular aspects could contribute to agricultural growth. Here, especially the role of productivity gains compared to augmented factor input is of interest. Without technical change, intensification would have led to ‘Boserupian growth’ characterised by constant land use and rising intensity of all other inputs; a development that would have resulted in increasing output and land productivity combined with falling labour productivity (Boserup Reference Boserup1993; Federico Reference Federico2005, pp. 83–4). Boserup clearly concluded that, with respect to the demographically and economically most dynamic European countries during the eighteenth and nineteenth centuries, the accelerated agricultural growth could be ascribed to additional labour input. All improvements in crops, animals and equipment, as well as market-induced specialisation gains, were considered as only minor elements of growth which could not prevent labour productivity from stagnating, if not falling. Accordingly, the introduction of stable feeding and production of fodder on arable land was subject to substituting fallow land for pasture, which indeed enhanced output. But these gains ‘would have failed to compensate for the addition of labour input’ (Boserup Reference Boserup1993, p. 39). Agricultural (labour) productivity started to rise only after the introduction of new industrial- and scientific-based inputs in the second half of the nineteenth century (Boserup Reference Boserup1981, pp. 114–17).
Unlike Boserup, other scholars argue that the intensification of farming in western Europe prior to 1870 not only covered the usual interregional spread of long-existing, approved farming systems but, even more so, productivity-enhancing new farming practices. In this respect, increasing land use intensity is an appropriate indicator for the diffusion of productivity-enhancing methods (Federico Reference Federico2005, p. 95). Moreover, this view emphasises the role of continuous and gradual improvements of crop rotations and animal husbandry in technical progress; it illustrates that the permanent trial-and-error process over more than four centuries finally resulted in rather new, highly productive farming systems that permitted significant productivity increases over time (Overton Reference Overton1996). Recent studies following Adam Smith have identified market integration processes that aim at securing the supply of quickly expanding urban agglomerations as the driving forces of an unprecedented and sustainable agricultural growth during Europe's ‘first agricultural revolution’ (De Vries Reference De Vries1974; Wrigley Reference Wrigley1987, Reference Wrigley1988; Grantham Reference Grantham1989, Reference Grantham1999; Kussmaul Reference Kussmaul1990; Hoffman Reference Hoffman1996; Van Zanden Reference Van Zanden, van Bavel and Thoen1999; Allen Reference Allen2000). A so-called Smithian growth is driven by gains in allocative efficiency as a result of increasing specialisation. Moreover, changes of allocative efficiency not only have the potential of being pivotal to TFP growth (Federico Reference Federico2005, p. 82) but also for inducing substantial increases in TFP, such as technical progress based on innovations.
Compared to England and the Low Countries, the acceleration of agricultural growth through the introduction of more intensive farming systems took hold in Westphalia on a large scale very late. Around 1800, Westphalia was still dominated by very extensive traditional farming systems. However, peasants could leapfrog older forms of more intensive crop rotation to immediately realise the newer but more productive ones, i.e. they could exploit the ‘advantage of backwardness’. Thus, if ‘intensification’ really was connected with productivity gains, the initial backwardness of Westphalian agriculture would enable high TFP growth. In other words, the lower the initial farming intensity, the higher TFP contributed to further output growth, if not TFP growth itself.
Of course, the existence of such a relationship would have had far-reaching consequences for agricultural growth within Westphalia. Consequently, in the nineteenth century, the growth effects of improved market access could have varied regionally depending on the degree of a region's isolation at the beginning of the integration process. Furthermore, taking into account the ongoing process of ‘Smithian growth’, it could be assumed that TFP gains were the highest in initially completely isolated regions – an assumption that is in line with Federico, who concludes that ‘The gains are the greater the bigger the gap between the actual and the optimal allocation of resources is’ (Federico Reference Federico2005, p. 185).
However, whether there exists a negative relation between initial farming intensity and share of TFP in further output growth has never been investigated for the period prior to 1870. Certainly, given pre-industrial agriculture, such a relationship would indicate that it was not possible to fully neutralise growth-decelerating effects of diminishing returns, even if technical change did take place – the more so because decreasing returns are aggravated with increasing farming intensity.
3. Westphalia and its regions: initial situation and agricultural development 1830–80
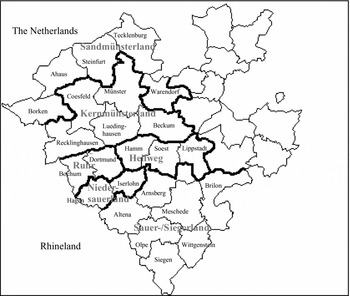
The province of Westphalia consisted of three administrative districts (Regierungsbezirke): Münster, Arnsberg and Minden (Map 1). Out of all three districts only Münster and Arnsberg could be included in the study because the original data sources of Minden no longer exist. However, the Münsterland, which became by far the most important supply region for the Ruhr in the decades after 1840, could be analysed completely. The area under investigation totalled 14,937 km2, stretching 100 km from east to west and 190 km from north to south, and is slightly larger than Flanders (13,522 km2).
The Prussian province of Westphalia: its regions and counties (1865)
Source: Based on Kopsidis (Reference Kopsidis2002, p. 90).
Notes: The administrative district Münster contains the regions of Sand- and Kernmünsterland. The remaining three regions formed the administrative district of Arnsberg.

3.1. Westphalia around 1830
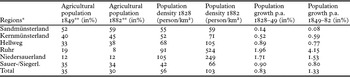
Even though agriculture dominated Westphalia's economy around 1830, both varying natural conditions and a richly differentiated economy had already formed clearly distinguishable economic and agrarian regions. Miscellaneous proto-industrial branches constituted a substantial part of the rural economy in most parts of Westphalia, albeit particularly concentrated in four regions: the northern region Sandmünsterland (linen industry), the southern Westphalian upland regions of Niedersauerland, the Siegerland, and areas of the Sauerland (metal processing). However, only in the Niedersauerland and the Ruhr was agriculture no longer an essential part of the local economy (Müller-Wille Reference Müller-Wille1981, pp. 262–325). In these two regions in 1849 the agricultural population actually only accounted for around 10 per cent of the entire population and as early as 1828 population density was nearly twice the Westphalian average (Table 2). Although, to a limited extent, regional specialisation began to emerge before 1830, in fact, it was only the rapid industrialisation and urbanisation concentrated in the Ruhr that fundamentally changed the situation.
Agricultural population and population growth, 1828–82

Source: Own calculations based on data from Staatsarchiv Münster Oberpräsidium Münster Nr. 672, p. 15, p. 30; STAM OP Münster, Nr. 673, p. 337, p. 340; Preussische Statistik 74, Berlin 1884, p. 258; Preussische Statistik 76, Erster Teil, Berlin 1884, pp. 371–6, 382–9; Tabellen und amtliche Nachrichten über den Preussischen Staat für das Jahr 1849 5, Berlin 1854, pp. 550–1, pp. 672–3, pp. 594–5, pp. 616–17; Kopsidis Reference Kopsidis1996, pp. 104, 107.
Notes: *see Map 1 (Kopsidis Reference Kopsidis1996, pp. 100, 131–5).
**Agricultural population refers to all persons with main occupation in agriculture and their family members (in% of total population).
3.2. Agricultural development 1830–80
The analysis of Westphalian agricultural growth and its components is based on data on agricultural value added, farmland, farm labour and livestock as indicator for the agricultural capital stock of 24 counties in 1830 and 1880.Footnote 1 Value added corresponds to net agricultural output comprising animal and plant production (except animal feed) in constant prices. Farmland consists of horticultural land, arable land, meadows and pasture. Farm labour is expressed in full-time labour units including family work. In the absence of available data on agricultural capital stock, livestock, measured in constant prices, serves as appropriate proxy. This approach seems reasonable and acceptable because livestock forms a substantial asset of agricultural capital stock which, in addition, is correlated with other important assets like farm buildings.
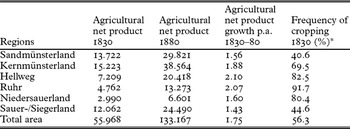
During the period from 1830 to 1880, agricultural output growth in Westphalia followed regionally divergent paths. The spatial distribution of regional differences in agricultural growth produced the typical von Thuenen pattern of different belts and a nucleus. The same is true of farming intensity measured by the ‘frequency of cropping’ (Table 3). Indeed, regions that around 1830 already performed outstandingly with respect to highest yields, most intensive farming systems and good connections to expanding markets also experienced the highest increases in agricultural net product between 1830 and 1880. Total agricultural net product increased by an annual rate of around 2.1 per cent in the ‘intensity nucleus’ (Ruhr and Hellweg), around 1.8 per cent in an ‘interior belt’ of moderately intensive farming (Kernmuensterland and, with reservations, Niedersauerland) and approximately 1.5 per cent in the ‘exterior belt’ of relatively extensive farming comprising the Sandmünsterland and Sauer/Siegerland (Kopsidis Reference Kopsidis1995, Reference Kopsidis1996, pp. 155–259).
Westphalian agricultural net product and its growth, 1830–80, in constant prices (average 1878–82), in million marks

Sources: See appendix, own calculations.
Notes: Crop production includes wheat and rye as bread grains, peas as a proxy for human consumption of pulses and the estimated part of non-garden potato production used for human consumption. Animal production comprises raw milk, meat (except poultry) and wool (Kopsidis Reference Kopsidis1996, pp. 192–201, 497–515).
*The ‘frequency of cropping’ (FOC, 10% < FOC < 100%) is defined as: ∑ annual cultivated area on average / ∑ annual cultivated area on average, plus all sorts of fallow (Boserup Reference Boserup1993, especially pp. 11–16, 1981, p. 18). A FOC of 10% corresponds to the most extensive farming systems of pre-industrial agriculture such as forest-fallow cultivation, whereas a FOC of 100% corresponds to highly developed crop rotation farming without fallow.
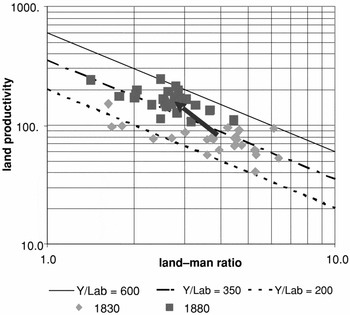
The discussion of input and output developments proves more informative using partial productivities and intensities of factor use. In addition, this approach allows the extraction of valuable insights into the technologies applied in the region and how they developed over time (Figure 1). Following Hayami and Ruttan (Reference Hayami and Ruttan1985, pp. 117–29), we make use of the decomposition of labour productivity into land productivity and land–man ratio. Thus,

with  labour productivity (agricultural value added in marks per labour unit),
 land productivity (agricultural value added in marks per hectare of farmland), and
 representing the land–man ratio (hectares of farmland per full-time labour unit).
Production and productivity differentials within Westphalian agriculture, 1830 and 1880 (24 counties)
Source: Own calculations, appendix. For description of parameters, see the text.

In 1830, the land–man ratio lay between 1.5 and 6.5 hectares per full-time labourer and land productivity ranged from about 40 to 100 marks per hectare. Compared to 1830, labour productivity increased significantly until 1880 from an average of about 300 to 500. This development was accompanied by an increase in land productivity and a reduction in land–man ratio.
Given the law of diminishing returns, together with the decrease of land–man ratio, the increase of land and labour productivities is surprising. According to Ricardo's extensive margin, it could be expected that the increase of land input could only have been achieved by taking less productive land into agricultural production. Certainly, this effect would have had a negative impact on land productivity but yet might have been compensated for by the increase in labour input per hectare (intensive margin) despite diminishing returns on labour. Thus, in this Ricardian view of agricultural growth, only relatively low increases of land productivity could have been expected. However, land productivity actually increased annually by 1.5 per cent, a considerable growth rate. The same applies to labour productivity, with a 0.96 per cent increase.
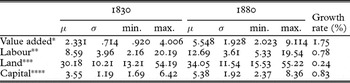
Two reasons might explain both the partial productivities and land–man ratio in Figure 1: (a) either technical change or (b) the intensification of agricultural production was connected with the exploitation of economies of scale. Table 4 suggests that positive scale effects could have played an important role. Output and all inputs except land were subject to substantial growth. Thus, output could have grown much stronger than inputs due to positive scale effects accrued from increasing capital and labour intensity. From this it follows that the dynamics of the growth process can only be understood if the isolated impact of single components, i.e. technical change and scale effects, can be figured out – an urgent need especially during a phase of strongly intensified factor use like the ‘first agricultural revolution’. In the following we will, therefore, develop a model that allows us to identify the contributions of these two different sources of growth. In addition, we test for the existence of biased technical change to determine which production factor was mostly affected by technical change.
Descriptive statistics on output and factor input by county, 1830 and 1880

Notes: * = Million marks; ** = Full labour units (thousand), *** = Farmland in thousands of hectares, **** = Livestock capital in million marks.
4. Methodological aspects
4.1. Estimation
The translog function is a suitable functional form for our growth analysis. Besides non-homogeneous technologies and non-neutral technical change, this functional form is able to capture complex interactions between output and inputs, as well as among inputs:
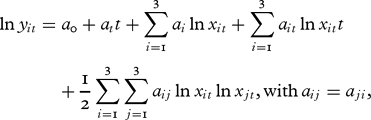
where y characterises output (e.g. value added), xi are inputs (land, labour, capital). Subscript i indicates the region while t denotes the year of the observation. Since we have only two periods in our sample, the variable t is a dummy variable. The parameter at captures the effects of neutral technical change, while biased technical change is considered in the parameter vector ait. Furthermore, ai and aij influence the production and substitution elasticities.
The translog function (1) could be estimated using OLS. However, we have 13 parameters but only 48 observations. Technically, this disproportionate relation of parameters to observations is not a problem. And even though the statistical properties could be regarded as satisfactory in terms of significance, the estimates might not be robust, i.e. the omission of individual observations is likely to change the parameter estimates considerably. We tackled this problem using the Bayesian approach developed by Geweke (Reference Geweke1986). This estimation method consists of a two-step procedure. In the first step, a conventional OLS regression is carried out. In the second step, sampling is conducted using the parameter estimates and their variances of the first step. However, in the second step we restrict the parameter space so that partial productivities are positive and that the law of diminishing returns is valid for individual factor variation.Footnote 2
In order to simplify the interpretation of the parameter estimates, we normalised all inputs and outputs by their geometric mean. Due to this procedure, the parameter estimates ai are the vector of production elasticities at the sample mean.
4.2. Technical change, intensification, and total factor productivity
The sources of output growth are given by the total differential of (1):
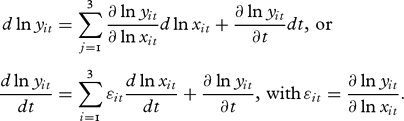
Equation (2) decomposes output growth into a scale effect and a technical change effect. The first measures the joint effects of input changes on output, whereas the input changes are weighted by the production elasticities (ɛi). The technical change effect is:
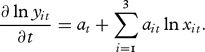
The estimates of the translog function can also be used to determine TFP differences among regions. Therefore, we follow Caves et al. (Reference Caves, Christensen and Diewert1982) and calculate a multilateral consistent Thörnquist–Theil index, which exactly mimics the changes of a translog production structure over both time and regions. Denoting the impact of technical change (3) as τit and considering the normalisation of the variables, the index is given by

According to (4), productivity differences between regions i and j are given by TFPit − TFPjt, while TFP development is captured by TFPit − TFP jt+1.
5. The sources of growth in Westphalian agriculture, 1830–80
5.1. Estimation results
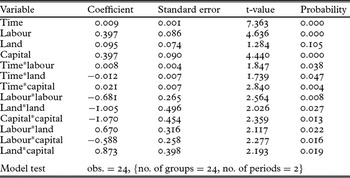
Most of the estimates are statistically highly significant (Table 5). Capital and labour were the most important factors. On average, their share in production amounted to about 40 per cent. The share of land was only about 10 per cent. This result is consistent with the observation that the increase in land results from cultivating marginal land, which received lower remuneration than land already used. The estimates associated with the variable ‘Time’ suggest that technical change increased output by about 1 per cent per year on average. Thus technical change was a substantial source of output growth in the period under investigation.
Parameter estimates of the production function for Westphalia's agriculture applying a random effect model, 1830–80

Source: Own estimates, appendix.
Moreover, there is evidence for biased technical change. The results clearly prove that the implemented innovations favoured the additional use of capital and labour (see the three variables: Time*Labour, Time*Land, Time*Capital). As both estimates show positive signs technical change favoured a more intensive use of these factors. The estimate for land is negative. Thus, technical change encouraged the augmented use of labour and capital in substituting land. This result is fully in line with the development of relative factor scarcities during the time under investigation already presented in Table 4 and Figure 1. Due to the higher increase in labour input and farm capital, land became increasingly scarce, and accordingly, the estimates reveal the adoption of land-saving technologies.
5.2. Sources of growth
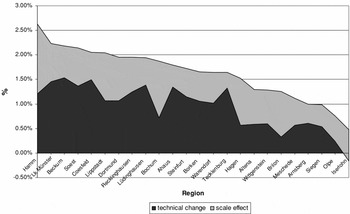
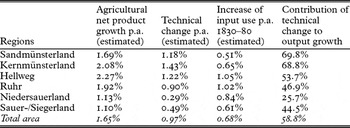
An output growth of about 1.75 per cent per annum along with an impact of technical change of about 1 per cent provides that both intensification and technical change contributed significantly to the exceptional development of Westphalian agriculture. Moreover, the impact of the two sources varies among regions (Figure 2).
Sources of agricultural output growth per county, 1830–80 (in% p.a.)
Source: Own estimations, Table 5, appendix.

The most remarkable technical change occurred in the northern half of the ‘exterior belts’ and not – as could have been expected – in the centre comprising Hellweg and the Ruhr (Table 6). Even though output growth in these two regions was revealed to be the most dynamic, technical change only contributed below average to net product growth. In contrast, in both remote regions of the Kern- and Sandmünsterland (with a much lower intensity of farming in 1830 than the Hellweg and Ruhr), technical change contributed much more to output growth, namely with a share of 69 and 70 per cent, respectively (Table 6).
Sources of agricultural growth for main regions, 1830–80

Source: Own estimates, Table 5, appendix.
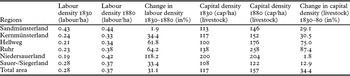
Correspondingly, favoured agricultural regions, like Hellweg and the Ruhr, with easy access and manifold connections to urban-industrial markets, reacted by significantly increasing input use in order to meet expanding agricultural demand. Table 7 may illustrate this feature comparing the corresponding key figures from the ‘exterior region’ Sandmünsterland and the ‘growth centre’ Hellweg and Ruhr. Labour input per hectare of farmland hardly changed in the Sandmünsterland from 1830 to 1880, whereas it increased by 63 per cent in the ‘growth centre’ of Westphalian agriculture. Moreover, in both centre regions high farming profitability even allowed farms to compete with industry for wage labour and to keep family labour on the farms (Fertig and Pfister Reference Fertig and Pfister2006; C. Fertig, Lünnemann and Fertig 2007; Lünnemann Reference Lünnemann2005).
Changes in factor intensity for main regions (in%), 1830–80

Source: Own estimates, appendix.
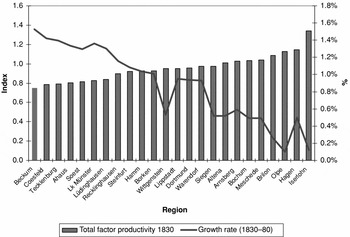
Analysing TFP growth in Westphalia between 1830 and 1880 clearly proves a ‘catching-up growth’ (Figure 3). Figure 3 reveals a negative correlation between the level of a county's TFP around 1830 and the growth of TFP during the following five decades. Bearing in mind that the TFP around 1830 measures interregional differences in factor productivity, a higher TFP growth in counties with a low initial productivity means convergence of regional productivities and factor remunerations over time. This convergent trend was induced by the diffusion of more productive intensive farming systems all over Westphalia. In the following we will analyse the determinants of the intensification and the technical change effect in more detail. Moreover, we will rationalise the observation of catching-up growth.
Total factor productivity in 1830 and its growth rate, 1830–80 (in% p.a.)
Source: Own estimations, Table 5, appendix.

5.2.1. Westphalia 1830–80: a case of demand-induced agricultural development? The ascent of the Ruhr as Europe's largest industrial belt began to boost demand for agricultural produce in Westphalia at a rate hitherto unknown. A heavy industrial take-off induced by the railway industry started along the Ruhr River during the 1840s. Along with industrialisation, the population structure in Westphalia changed fundamentally. Until around 1840, demographic expansion within Westphalia mainly meant rural population growth, whereas the share of town population had stagnated for decades at around 26 per cent (Müller-Wille Reference Müller-Wille1981, p. 234). However, this situation changed when a dramatic urbanisation process concentrated at the Ruhr began during the 1840s. Between 1846/49 and 1871, the Westphalian population of cities with more than 20,000 inhabitants increased by 9.1 per cent per annum (Tilly Reference Tilly1990, p. 217; Köllmann et al. Reference Köllmann, Hoffmann, Maul and Köllmann1990, pp. 116–18) – a tremendous rise, which was two to three times higher than in the rest of Germany. No other German region experienced a sharper increase in its non-agricultural population between 1840 and 1880.
What is more, the ‘urbanisation of the food pattern’ had a strong impact on the demand side of agricultural markets because the real incomes of the urban-industrial population were higher than those of rural labourers. Demand for high value-added and relatively expensive food items such as pork, beef, diary products and wheat rose sharply. According to contemporary Prussian sources, meat consumption per capita for the urban population was probably twice as high as rural consumption. Distinct rural–urban differences existed in the per capita consumption of wheat and rye as well (Kopsidis Reference Kopsidis1996, pp. 518, 525–6; Burgholz Reference Burgholz and Teuteberg1987, pp. 103, 107–8; Königlich Pr. Stat. Bureau, 1864, pp. 129–30). The quickly growing urban demand for highly income-elastic superior foodstuffs resulted in steadily rising Westphalian meat prices between 1840 and 1880, as well as consistently high grain prices after 1850 (which only weakly reacted to ongoing high crop variations) (Kopsidis Reference Kopsidis1998). This demand-induced upward price trend over more than three decades created favourable conditions for farming intensification in order to achieve sustainable surpluses.
Certainly, due to increasing demand, Westphalian agriculture faced new challenges, for, realising potential agricultural output meant exploitation not only of agricultural sources but also of transport capacities. Thus, it depended on a transport infrastructure with the ability to connect regions of potential agrarian surplus with regions of excess demand, or, to put it otherwise, to bridge the growing spatial separation of food demand and supply. In the case of Westphalia, this could only be met by revolutionary improvements in transport. It was industrialisation which enabled drastically falling transport costs.
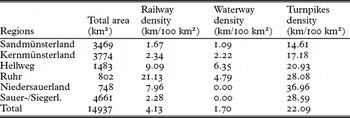
After 1840, the emergence of a railway network supported especially by a rapid extension of turnpikes led to the Westphalian transport revolution, with drastic cuts in transport costs in long-distance trade. Around 1830, only the former Prussian county of Mark (Ruhr, Niedersauerland, the western Hellweg) was endowed with a dense network of turnpikes and navigable waterways. However, the situation was different in the majority of Westphalia. In particular, the Münsterland and the Sauer-/Siegerland almost completely lacked turnpikes or waterways and, instead, depended mainly on unpaved cart paths for their agricultural trade – a condition that rendered these regions inaccessible during the extremely rainy seasons in spring and autumn. In the area under investigation, the length of the turnpike network tripled from 998 km to 3,300 km between 1828 and 1867 (Kopsidis Reference Kopsidis1996, p. 110). Transport infrastructure developed like a cobweb, with the Ruhr in the centre, surrounded by a grid whose density was positively correlated with the proximity to the centre (Table 8). By the mid 1850s, the expansion of the railway system had been completed in the regions Ruhr, Hellweg and some of Kernmünsterland's counties near the Ruhr within a single decade. After 1865, even the remote regions with a high agricultural potential were able to experience an improvement in traffic links to the Ruhr due to the ongoing expansion of the railway (Kopsidis Reference Kopsidis1996, pp. 317–19).
Transport infrastructure, 1868

Source: Own calculations based on data from Meitzen (Reference Meitzen1869, p. 649).
Around 1830, agricultural markets in Westphalia were highly fragmented and isolated from international markets (Kopsidis Reference Kopsidis1998, Reference Kopsidis2002). As late as 1855, the rather fast extension of the railway network could for the first time create a highly integrated agricultural market that covered the whole territory of Westphalia. As a result of this development, demand areas in the industrial belts started to dominate price processes in all supply regions. Tentative estimations of the impact of railways on agriculture, supported by official reports from the counties, suggest that the transport revolution paved the way for a tremendous increase in interregional trade in Westphalia. Growing agricultural production and the disproportionately increasing domestic trade volumes substantially facilitated the balancing of spatial and temporal market disequilibria after 1850 (Kopsidis Reference Kopsidis1996, pp. 291–344).
Until about 1870, the growing domestic food demand was mostly (if not almost completely) met by pushing the ‘grain belt’ of the Ruhr farther northwards into the vast north German lowlands. The extension of the ‘interior von Thuenen belt’ of advanced intensive grain farming followed the completion of the railway network and the densification of the turnpike system in the fertile plains north and east of the Ruhr. After 1830, the transport linkages to the Ruhr improved significantly. This was especially true of the Hellweg and Kernmünsterland. Accordingly, in these two regions with high agricultural activity but low population growth grain production soared, while local grain demand increased to a much lesser extent. With that, the interior belts’ regional grain export surplus increased substantially until 1880 (Kopsidis Reference Kopsidis1996, p. 250). Indeed, railways promoted the intensification of farming within Westphalia and no imports. According to contemporary transport statistics of 1886, three-quarters of the grain transported to the Ruhr by railway came from other parts of Westphalia (Kopsidis Reference Kopsidis1998, pp. 192–3; Koettgen Reference Köttgen1890).
Market integration processes not only speeded up the expansion of more intensive farming systems, they also changed the structure of output by fostering mainly the supply of urban-demanded ‘cash-products’ such as wheat, pork, dairy products and beef (Kopsidis Reference Kopsidis1996, pp. 201–11). Peasants’ achievements in feeding the growing industrial population were impressive. Between 1830 and 1880, the bread grain net production of wheat and rye per capita only slightly diminished from 134 kg to 129 kg, whereas the meat production per capita increased substantially from 14.9 to 19.5 kg (Kopsidis 1994, pp. 286, 294, 656–65). What is more, since fodder production for cattle and horses per animal rose steeply from 711 kg to 1,221 kg, an all-important precondition for highly productive livestock farming was met that could satisfy the high-quality standards of urban demand (Kopsidis 1994, p. 296).
To sum up, industrialisation greatly affected Westphalian agricultural development in two ways: (a) it induced a long-lasting ‘demand push’, unique even in comparison with other dynamic regions of nineteenth-century industrialising Europe; and (b) it paved the way for a railway-based transport revolution which multiplied long-distance agricultural trade within Westphalia, an area lacking navigable waterways.
5.2.2. Complementary productivity enhancing developments on the supply side. Between 1830 and 1880, Westphalian agriculture experienced several fundamental changes on the supply side, which, inter alia, could be responsible for the tremendous productivity gains. Most important changes were:
1. The Prussian agrarian reforms which aimed at abolishing the Grundherrschaft (manorial system), thereby granting the peasants full ownership of their farms,
2. A ‘hand tool and draft animal revolution’ as described by Collins (Reference Collins, Jones and Woolf1969) and Wrigley (Reference Wrigley1988, pp. 33–45, Reference Wrigley, Overton and Campbell1991).
3. Changes in farming systems induced by intensification.
Liberal agrarian reforms establishing private property were seen as the catalyst of a suddenly accelerated growth, especially in the older historiography. In this view, the lack of full private ownership rights and the allegedly restrictive institutional setting of communal open-field agriculture obstructed any effort to intensify production in pre-reform Westphalia (Teuteberg Reference Teuteberg and Blaich1981).
In Westphalia, the legal framework of the Prussian agrarian reforms was first implemented as late as 1829. Thus, Westphalia was the last Prussian province to enact the abolition laws associated with the reforms. However, peasant property rights had already been well established in the existing system of feudal land tenure long before the Prussian agrarian reforms were implemented (Kopsidis Reference Kopsidis2006, pp. 284–308; Juergens Reference Juergens1976/77; Wittich Reference Wittich1896). Furthermore, recent research has shown that the management of the Westphalian commons was much more flexible than supposed by the older historiography. Altogether, the reforms in Westphalia only meant the last step in the long process of converting the feudal peasants to full owner-occupiers of their farms without being forced to compensate their former landlords with land (Brakensiek Reference Brakensiek1990, p. 75). It should be mentioned here that the most industrialised parts of Westphalia around Bochum and Dortmund had developed from a low-yield area around 1700 to one of the most advanced agrarian regions of the Prussian monarchy (if not of Europe) long before the Prussian reforms (Slicher van Bath Reference Slicher van Bath1963, p. 332; Brakensiek Reference Brakensiek1991, pp. 94–184, 369–75, table 3).
In striking contrast to England's ‘landlords’ revolution’ (Allen Reference Allen1992), no fundamental changes in type and sizes of farms took place in Westphalia between 1830 and 1880. Indeed, no signs of ‘farm amalgamation’, which Allen deems responsible for the English productivity gains during the eighteenth century, were visible. In fact, during the nineteenth century, enclosures facilitated the expansion of smallholdings under 10 hectares as a result of peasant family strategies; this development also stabilised the position of the peasants, who gained by far the largest part of the sizable Westphalian commons – very probably approximately 80 per cent (Brakensiek Reference Brakensiek1990, p. 75; Fertig Reference Fertig, Ditt, Gudermann and Rüße2001a; Kuepker Reference Kuepker2008, pp. 202–87). Westphalia's farm structure actually facilitated the increasing use of labour and capital, whose productivity was most positively affected by technical change.Footnote 3 Consequently, family farms would have offered the best conditions for increasing livestock capital as livestock densities were strongly negatively correlated with farm size – a development that is mirrored in all Westphalian regions around 1880 (Kopsidis Reference Kopsidis1996, p. 240).
Even though some changes are observable, there is actually no evidence to prove a thorough ‘hand tool and draft animal revolution’. As late as around 1880, 47 per cent of all agricultural draft animals were cows and oxen but not horses. Certainly, improvements in traditional hand tools took place in nineteenth-century Wesphalia, but as compared to the years after 1880, they are only poorly documented. Hardly any transition towards a more mechanised labour-saving agriculture occurred. The use of steam threshers, as well as mechanised mowers and seeders, was restricted to a very small minority; even on farms larger than 50 hectares, they were the exception, and not the rule. Mechanical threshing machines were commonly used on most farms larger than 10 hectares (Preussische Statistik, 1885, pp. 177–8, 186–7; Kopsidis Reference Kopsidis1996, pp. 237–241). The use of chemical fertilisers was negligibly low, near to zero (Achilles Reference Achilles1993, pp. 235–9).
All in all, during the time under investigation, the pivotal change that occurred in Westphalian agricultural production was an accelerated transition from traditional extensive low-yielding farming systems to more intensive crop rotations and animal husbandry driven by market forces. Traditional long-fallow ‘shifting-cultivation’ systems with 4–25 fallow years, poor (if no) manuring and continual changes between arable, pasture and forest land were superseded by ‘permanent cultivation systems’ that brought about distinct changes in farm management: planting of intercrops, as well as improved manuring, could reduce fallow to zero, and extensive pasturing was replaced by stable feeding and fodder crop cultivation (Müller-Wille Reference Müller-Wille1938; Kopsidis Reference Kopsidis2004).
So far, it seems that the accelerated agricultural growth was primarily induced by changes in markets resulting from the rise of the Ruhr to become Europe's largest urban-industrial agglomeration. Agrarian reforms and improvements in hand tools played only a minor role. Finally, as expected in a process of TFP growth that was mainly based on the diffusion of already existent more intensive farming systems, ‘catch-up growth’ did occur within Westphalia.
5.2.3. Catch-up growth and farming systems. Starting in the counties on the northern border of the Ruhr, more recent variants of intensification based on root crops instead of legumes began to replace traditional extensive rye cultivation systems on a larger scale in both regions of the Münsterland after 1830 (Kopsidis Reference Kopsidis1995, p. 150). Leapfrogging older forms of intensive clover–legumes crop rotation, which had been well established before 1830 in the Hellweg, Ruhr and Niedersauerland, might have enhanced productivity to a larger extent than simply changing from clover-based to root crop-based crop rotation. In the sandy parts of the Münsterland, root crops enabled farmers for the first time to solve the severe shortage of fodder and manure, which was traditionally extracted in a very labour-intensive manner.Footnote 4
The aforementioned divergent productivity response to new crops stresses the importance of the initial level of farming intensity on further technical change in pre-industrial agriculture. Indeed, the initial level not only explains the extraordinary rising productivity in the northern plains, but also the poor, if not stagnating, productivity development in the southern upland regions of Niedersauerland and Sauer-/Siegerland. Although, since around 1830, in the densely populated, proto-industrial Niedersauerland the level of farming intensity was relatively high, in fact, its only at best medium-quality soils did not allow further productivity gains. Here, the contribution of technical change to growth was the lowest and almost negligible (Table 6). Furthermore, only an extraordinary upswing of labour input could secure above-average regional output growth (Table 7). This indicates that under conditions of pre-industrial agriculture the quality of soil was a crucial factor for the development of growth: the lower the quality of the soil was, the earlier a point was reached where further agricultural output growth could only be realised through higher labour inputs per hectare. In particular in mountainous regions, yields seemed to respond only weakly to the more intensive farming systems that had been introduced in the course of the ‘first agricultural revolution’. It was only due to the subsequent specialisation in grassland farming that productivity significantly improved here.
Market failure very probably hampered productivity development in the Westphalian highlands. While Niedersauerland had already started to specialise in dairy production at the beginning of the nineteenth century, it only became part of the ‘fresh-milk belt’ of the Ruhr during the early twentieth century. In fact, the decades after 1830 were characterised by a short-term extension of bread grain cultivation (Kopsidis Reference Kopsidis1996, pp. 215–16; Müller-Wille Reference Müller-Wille1981, pp. 160–1, 221–2). This was because until the 1870s the rapidly growing local demand for wheat and rye could not be fully met by market supplies from adjacent granaries, despite high prices and a flourishing grain trade. Thus, oats – the traditional grain of the Niedersauerland, which grows well on low-quality highland soils – was replaced by the more demanding crops wheat and rye. The share of bread grain production for human consumption in agricultural net product rose significantly between 1830 and 1880, whereas the share of animal production fell from 64 to 57 per cent (Kopsidis Reference Kopsidis1996, p. 199).Footnote 5 The temporary grain shortage could have been responsible for the allocation of agricultural labour contrary to the region's natural comparative advantages in grassland farming, and thus for stagnating productivity in Niedersauerland and retarded productivity in Sauer-/Siegerland.
6. A comparison of Westphalian and western European TFP growth
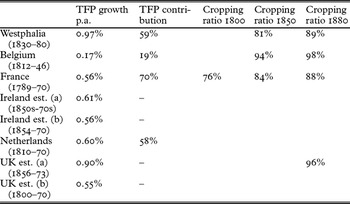
Compared to other contemporary European countries, technical change in Westphalia's agriculture was exceptionally high, even outstripping the highest estimation of English TFP growth (Table 9). However, referring to the scant European data available (Federico Reference Federico2005, p. 80), the contribution of TFP growth in Westphalia, at 59 per cent, comes close to the European mean. If the cropping ratio, defined as ratio of cultivated crops to total arable land (Federico, Reference Federico2005, pp. 95–7), is used as indicator of the adoption of TFP-enhancing new farming practices, the few European ratios for the period before 1880 suggest that Westphalia experienced a comparably high reduction of fallow land, twice as much as, for example, Belgium or France (Table 9). These results support the view of a dynamic TFP growth in Westphalian agriculture. Further support is provided by the fact that the cropping ratio indicator underestimates the diffusion of new farming practices, since, in contrast to the ‘frequency-of-cropping’, the ‘cropping ratio’ only considers changes of fallow on arable land. Thus, switches from highly extensive ‘long-fallow cultivation systems’ with mixed use of land (e.g. between forestry and agriculture) to more intensive ‘short-fallow cultivation systems’ are not captured. However, such switches did take place on a large scale in Westphalia after 1830 (Müller-Wille Reference Müller-Wille1938; Kopsidis Reference Kopsidis1996, pp. 164–76). Measured as ‘frequency-of-cropping’, Westphalia still showed a strikingly low farming intensity around 1830. On average, Westphalia's farming intensity was even lower than the often-quoted ‘medieval’ three-course rotation (Kopsidis Reference Kopsidis2004, p. 328). But, this comparatively low performance offered a high potential for productivity gains accruing from the diffusion of much more intensive new farming systems.
Comparison of Westphalian and western European TFP growth

Source: Except Westphalia, see Federico (Reference Federico2005, p. 240, table IV, p. 246, table V, p. 96, table 6.1).
7. Conclusions
The outstanding performance of Westphalia's peasant agriculture between 1830 and 1880 illustrates the characteristic features of a ‘catch-up’ period of growth long before the Kaiserreich. Furthermore, at least for Westphalia during the period of the Prussian agrarian reforms between 1820/30 and 1870/80, it is obvious that agricultural growth was based mainly on productivity gains and not simply on augmenting factor inputs – especially land – as supposed by German historiography (Pierenkemper Reference Pierenkemper and Pierenkemper1989, p. 19).
According to our results, there are two main reasons that can explain the extraordinary dynamics of Westphalia's ‘first agricultural revolution’ between 1830 and 1880 which, compared to its precursors during the seventeenth and eighteenth centuries in the Netherlands and England, occurred very late:
1. On the demand side, the rapid expansion rate of the urban-industrial agglomeration along the Ruhr River after 1840;
2. On the supply side, a very low farming intensity at the beginning of the expansion.
England and Westphalia experienced both a demand-induced acceleration of their agricultural growth, with urbanisation and industrialisation, and a singular expansion of their non-agricultural economic sectors which, in fact, had been the driving forces. However, Westphalia's urbanisation and industrialisation processes proceeded differently: much more dynamically and in a significantly shorter time period. After 1840, the beginning of the rise of the Ruhr towards becoming the largest European industrial belt created extraordinarily favourable conditions for demand-driven, market-oriented agricultural growth.
Besides a ‘demand push’, whose spatial impact was enforced by the ‘transport revolution’ of railways, further favourable conditions on the supply side supported the growth of Westphalia's peasant agriculture. According to our results, it was the initial stage of intensification that strongly determined the scope of potential productivity gains. With respect to rates of technical change, regions with initially relatively intensive agriculture achieved significantly lower rates than extensive farming regions. Thus, under conditions of pre-industrial agriculture, Westphalia's on average strikingly low farming intensity around 1830, which was similar to England's level as early as the first half of the seventeenth century (Thirsk Reference Thirsk1984), created a favourable environment for agricultural growth.
This astonishing result has far-reaching consequences for scope and sustainability of specialisation gains of market integration as driving forces of Smithian growth in a pre-modern agriculture. According to our results, Smithian agricultural growth driven by the spread of more intensive farming systems into a greater and greater area seemed to follow a simple rule: the more growth was connected with high TFP growth, the more it was possible for the first time to integrate highly extensively farming regions into the supply area of expanding urban(-industrial) agglomerations. A transport revolution, which had only connected high-intensity farming regions, for example in nineteenth-century Belgium, could strongly have affected agricultural output but not TFP growth. Furthermore, it could be supposed that if it is not possible to permanently link newly so far isolated extensively farming regions to emerging domestic markets, the TFP growth of a pre-industrial agriculture will slow down. Comparing modern growth, based on new technical inputs, to pre-modern Smithian growth, based mainly on specialisation, our empirical results support Mokyr's thesis that ‘Technology, by its very nature, is much less reversible and less likely to turn into diminishing returns than commercial expansion’ (Mokyr Reference Mokyr1999, p. 127). In this view, the constraints of pre-industrial agriculture on TFP growth and the danger of diminishing returns can only temporarily be offset by Smithian growth. Under these conditions, the ability of the most advanced high-yielding agricultural regions to further realise the highest output growth depended not so much on their capability to achieve high TFP increases, as on ensuring rising factor input even if factor costs increased significantly. However, much more research is necessary to test whether Westphalia represents only a very special case or if it reveals new insights into the general economics of pre-industrial agricultural growth.
Appendix
Consistent sources of micro-level data on agriculture are provided by the first Prussian cadastral register for Westphalia, as well as extensive Prussian land tax records for the periods 1822–35 and 1861–5, supplemented by Prussian agricultural statistics for the period 1878–82. It should be noted here that the data on yields, planted areas for single crops and land use extracted from the land tax records around 1830 refer explicitly to the average performance of a common peasant farm. Special tax commissions regularly responsible for six to twelve villages, and staying there for one or more years, gathered the data to assess the land tax. Thus, the data are much more reliable than contemporary agrarian statistics collected only for statistical reasons (Müller-Wille Reference Müller-Wille1940; Pfeffer von Salomon Reference Pfeffer von Salomon and Kerckerinck zur Borg1912; Kopsidis Reference Kopsidis1996, pp. 147–55). The crop data for 1880 refer to five-year averages of crop statistics for the period 1878–82 (Kopsidis Reference Kopsidis1996, pp. 153–80).
Extensive calculations and estimates for villages with lost records were necessary to aggregate the physical crop yields and crop areas for single products, which were documented in the land tax records of 1822–35, village by village to county values, so that they were comparable with annual Prussian crop statistics that were first collected in 1878. A detailed description of the calculations for livestock can be found as well in Kopsidis (Reference Kopsidis1995, Reference Kopsidis1996, pp. 497–537).
Following the Prussian occupational census of 1882, the agricultural labour force, as calculated in this study, comprises male and female full-time agricultural labour forces (self-employed and employed persons), their family members over the age of 14 living in the farm household without being employed full-time off-farm, and domestic servants. Part-time farmers were completely excluded from the calculations of the Westphalian labour force because all employed full-time agricultural labourers who owned a parcel of land were counted both as full-time and part-time agricultural labourers. Thus, most part-time farmers in Westphalia – especially in the rural areas – were counted as full-time agricultural workers as well. The first Prussian occupational statistic for 1849 allows us to calculate the complete full-time agricultural labour force similar to the occupational census of 1882 but for one difference: the 1849 occupational statistics did not identify family members under the age of 14 separately. Therefore, the share of family members under 14 in the full-time agricultural population has been calculated from the census of 1882 to reduce the full-time agricultural population from 1849. Since the demographic structure of the agricultural population did not change between 1850 and 1880, this seems reasonable. The total agricultural labour force in 1830 was approximated by weighting the total population in 1830 with the proportion of the agricultural labour force in the total population of 1849. The share's values may have been modified according to changes in the local economy's structure.
Archival and printed sources
All archival sources are from the Staatsarchiv Münster (Public record office, Münster). A list of all sources is presented in Kopsidis (Reference Kopsidis1996, pp. 546–9) and Kopsidis (Reference Kopsidis2004, pp. 334–40), which contains in a printed version all raw data used to calculate crop production around 1830 (Kopsidis Reference Kopsidis2004, pp. 341–77).