





Impact statement
In drylands, riparian habitats adjacent to watercourses support higher plant diversity compared to their drier surroundings. These linear elements enhance ecological connectivity by facilitating the movement of animals such as pollinators and birds through the landscape, and help buffer extreme rainfall events by reducing runoff and erosion, which are nature’s contributions to people. Understanding how human drivers shape the diversity of riparian plant communities is essential for sustaining those contributions in rapidly transforming drylands. By studying riparian habitats across natural, semi-natural, agricultural and urban landscapes in Argentina’s Monte Desert biome, this work reveals that human drivers do not uniformly affect its diversity. Highly diverse native riparian plant communities are developing well in heterogeneous urban and agricultural landscapes, with species replacement among sites. In contrast, a semi-natural wetland landscape, consisting of a network of small marshes and streams embedded within cultivated fields, showed signals of species loss. These findings provide useful insights into conservation and territorial planning. The restoration and preservation of ecological corridors within wetland habitats are crucial policies to sustain their essential nature contributions to people, particularly in the face of land-use change.
Introduction
Drylands cover about 40% of Earth’s land surface, support one-third of the global population, and produce nearly half of the world’s food, from livestock and cultivated systems (UNCCD, 2022). These regions host a high proportion of plant species adapted to water scarcity, intense herbivory, and high climatic variability (Maestre et al., Reference Maestre, Benito, Berdugo, Concostrina-Zubiri, Delgado-Baquerizo, Eldridge, Guirado, Gross, Kéfi, Le Bagousse-Pinguet, Ochoa-Hueso and Soliveres2021; Gross et al., Reference Gross, Maestre, Liancourt, Berdugo, Martin, Gozalo, Ochoa, Delgado-Baquerizo, Maire, Saiz, Soliveres, Valencia, Eldridge, Guirado, Jabot, Asensio, Gaitán, García-Gómez, Martínez, Martínez-Valderrama, Mendoza, Moreno-Jiménez, Pescador, Plaza, Santaolaria Pijuan, Abedi, Ahumada, Amghar, Arroyo, Bahalkeh, Bailey, Salem, Blaum, Boldgiv, Bowker, Branquinho, van den, Bu, Canessa, Castillo-Monroy, Castro, Castro, Chibani, Conceição, Darrouzet-Nardi, Davila, Deák, Donoso, Durán, Espinosa, Fajardo, Farzam, Ferrante, Franzese, Fraser, Gonzalez, Gusman-Montalvan, Hernández-Hernández, Hölzel, Huber-Sannwald, Jadan, Jeltsch, Jentsch, Ju, Kaseke, Kindermann, le Roux, Linstädter, Louw, Mabaso, Maggs-Kölling, Makhalanyane, Issa, Manzaneda, Marais, Margerie, Hughes, Messeder, Mora, Moreno, Munson, Nunes, Oliva, Oñatibia, Peter, Pueyo, Quiroga, Ramírez-Iglesias, Reed, Rey, Reyes Gómez, Rodríguez, Rolo, Rubalcaba, Ruppert, Sala, Salah, Sebei, Stavi, Stephens, Teixido, Thomas, Throop, Tielbörger, Travers, Undrakhbold, Val, Valkó, Velbert, Wamiti, Wang, Wang, Wardle, Wolff, Yahdjian, Yari, Zaady, Zeberio, Zhang, Zhou and Le Bagousse-Pinguet2024). The diverse and specialised dryland flora sustains essential nature’s contributions to people, such as climate regulation, soil fertility, and habitat provision for pollinators (Díaz et al., Reference Díaz, Pascual, Stenseke, Martín-López, Watson, Molnár, Hill, Chan, Baste, Brauman, Polasky, Church, Lonsdale, Larigauderie, Leadley, Van Oudenhoven, Van Der Plaat, Schröter, Lavorel, Aumeeruddy-Thomas, Bukvareva, Davies, Demissew, Erpul, Failler, Guerra, Hewitt, Keune, Lindley and Shirayama2018; Eldridge et al., Reference Eldridge, Wang, Liu, Ding, Li, Wu and Li2024). The expansion of urban and agricultural areas is the main human driver threatening dryland plant biodiversity (Corlett, Reference Corlett2016; Ren et al., Reference Ren, He, Huang, Shi, Zhang and Güneralp2022). These land-use changes lead to habitat fragmentation, which is the process of breaking apart natural habitats, altering functional connectivity that governs the flow of species and material (Fahrig, Reference Fahrig2003; Datry et al., Reference Datry, Boulton, Bonada, Fritz, Leigh, Sauquet, Tockner, Hugueny and Dahm2017).
The persistence of plant diversity depends on metacommunity structure, which is a set of local communities connected by species dispersal along spatial and environmental gradients (Leibold et al., Reference Leibold, Holyoak, Mouquet, Amarasekare, Chase, Hoopes, Holt, Shurin, Law, Tilman, Loreau and Gonzalez2004; Gonzalez, Reference Gonzalez2009; Grass et al., Reference Grass, Loos, Baensch, Batáry, Librán-Embid, Ficiciyan, Klaus, Riechers, Rosa, Tiede, Udy, Westphal, Wurz and Tscharntke2019). Along a land-use gradient, fragmentation acts as a selective filter that reconfigures metacommunity structure (Jiménez et al., Reference Jiménez, Zavala-Hurtado, Vega and Márquez-Haro2024). A powerful approach to analysing changes in metacommunity structure is to study β-diversity, which measures species dissimilarities among sites (Baselga, Reference Baselga2010). Human-driven landscapes often show greater taxonomic homogenisation between sites. This is because dominant and disturbance-tolerant exotic species successfully colonise at the expense of specialist native species (La Sorte et al., Reference La Sorte, Aronson, Williams, Celesti-Grapow, Cilliers, Clarkson, Dolan, Hipp, Klotz, Kühn, Pyšek, Siebert and Winter2014). However, a recent global review found mixed evidence between multiple studies on whether strong human pressures, such as urbanisation, increase or decrease plant β-diversity, showing that its effects can vary widely depending on multiple environmental and human drivers (Lokatis and Jeschke, Reference Lokatis and Jeschke2022). These processes are well studied in humid and mesic ecosystems, but they remain less understood in drylands, where anthropogenic activities abruptly alter habitat conditions for human well-being (Diamant et al., Reference Diamant, Oswald, Awoyemi, Gaston, MacGregor-Fors, Berger-Tal and Roll2025).
To better understand the ecological processes that are structuring a metacommunity across the landscape, it is useful to partition β-diversity into two processes: turnover and nestedness (Soininen et al., Reference Soininen, Heino and Wang2018). Turnover occurs when species are replaced among sites, with no change in overall richness or abundance; in contrast, nestedness occurs when species-poor communities are subsets of richer ones (Baselga, Reference Baselga2010; Marcacci et al., Reference Marcacci, Westphal, Wenzel, Raj, Nölke, Tscharntke and Grass2021). Thus, two sites may exhibit identical dissimilarities between their communities but with contrasting ecological processes explaining them. Although there can be a mixture of both processes, the framework proposed by Socolar et al. (Reference Socolar, Gilroy, Kunin and Edwards2016) provides critical insights into how these components should guide conservation and territorial planning. According to this framework, if turnover predominates across spatial and environmental gradients, conservation efforts must focus on a network of distinct sites to capture the full regional diversity; conversely, if nestedness predominates, management should prioritise protecting species-rich sites that encompass much of the total diversity.
Riparian habitats are particularly well-suited for evaluating these dynamics, as they form linear landscape elements that traverse contrasting land uses and environmental gradients (Van Rossum and Triest, Reference Van Rossum and Triest2012; Boudell, Reference Boudell, Finlayson, Everard, Irvine, McInnes, Middleton, Van Dam and Davidson2016). Adjacent to perennial and non-perennial rivers, small streams, channels, ditches and wetlands, riparian habitats are key ecosystem components that require conservation actions (Stromberg et al., Reference Stromberg, McCluney, Dixon and Meixner2013). This is particularly true in drylands, where riparian habitats support higher plant diversity and abundance compared with their drier surroundings (Soykan et al., Reference Soykan, Brand, Ries, Stromberg, Hass, Simmons, Patterson and Sabo2012; Stromberg et al., Reference Stromberg, Setaro, Gallo, Lohse and Meixner2017). Furthermore, they act as ecological refugia and reduce fragmentation by enhancing connectivity between natural habitats (Manning et al., Reference Manning, Julian and Doyle2020; Selwood and Zimmer, Reference Selwood and Zimmer2020; Foulquier et al., Reference Foulquier, Datry, Corti, Von Schiller, Tockner, Stubbington, Gessner, Boyer, Ohlmann, Thuiller, Rioux, Miquel, Albariño, Allen, Altermatt, Arce, Arnon, Banas, Banegas-Medina, Beller, Blanchette, Blessing, Boëchat, Boersma, Bogan, Bonada, Bond, Brintrup, Bruder, Burrows, Cancellario, Canhoto, Carlson, Cid, Cornut, Danger, de Freitas Terra, De Girolamo, del Campo, Díaz Villanueva, Dyer, Elosegi, Febria, Figueroa Jara, Four, Gafny, Gómez, Gómez-Gener, Guareschi, Gücker, Hwan, Jones, Kubheka, Laini, Langhans, Launay, Le Goff, Leigh, Little, Lorenz, Marshall, Martin Sanz, McIntosh, Mendoza-Lera, Meyer, Miliša, Mlambo, Morais, Moya, Negus, Niyogi, Pagán, Papatheodoulou, Pappagallo, Pardo, Pařil, Pauls, Polášek, Rodríguez-Lozano, Rolls, Sánchez-Montoya, Savić, Shumilova, Sridhar, Steward, Taleb, Uzan, Valladares, . Vander, Waltham, Zak and Zoppini2024). Study sites where riparian habitats range from natural to highly modified landscapes (e.g. natural reserve → agroecosystem → peri-urban → city centre) offer an ideal setting to examine how habitat fragmentation shapes plant metacommunity structure and thus make conservation decisions against the expansion of human-driven landscapes (Logue et al., Reference Logue, Mouquet, Peter and Hillebrand2011).
Here, we will assess how different landscapes shape the taxonomic structure of riparian plant metacommunities in a dryland with high rates of urban and agricultural expansion, in central-western Argentina. Our specific objective is to analyse how β-diversity and its processes of turnover and nestedness for both native and exotic species pools respond to different land-use contexts along a habitat fragmentation gradient. We propose the following three hypotheses: (1) β-diversity changes along the land-use gradient, generating a pattern of taxonomic homogenisation in the most fragmented habitats. (2) Urban and agricultural landscapes reduce β-diversity of native species and increase β-diversity of exotic species, because the former group is expected to be highly sensitive to anthropogenic impacts and the latter are expected to be efficient colonisers in impacted sites. (3) Habitat fragmentation is a key driver of metacommunity structure, with a predominance of the nestedness process as it generates species-poor communities that are subsets of richer ones from less fragmented habitats.
Methods
Study area, landscape characterisation and their riparian habitats
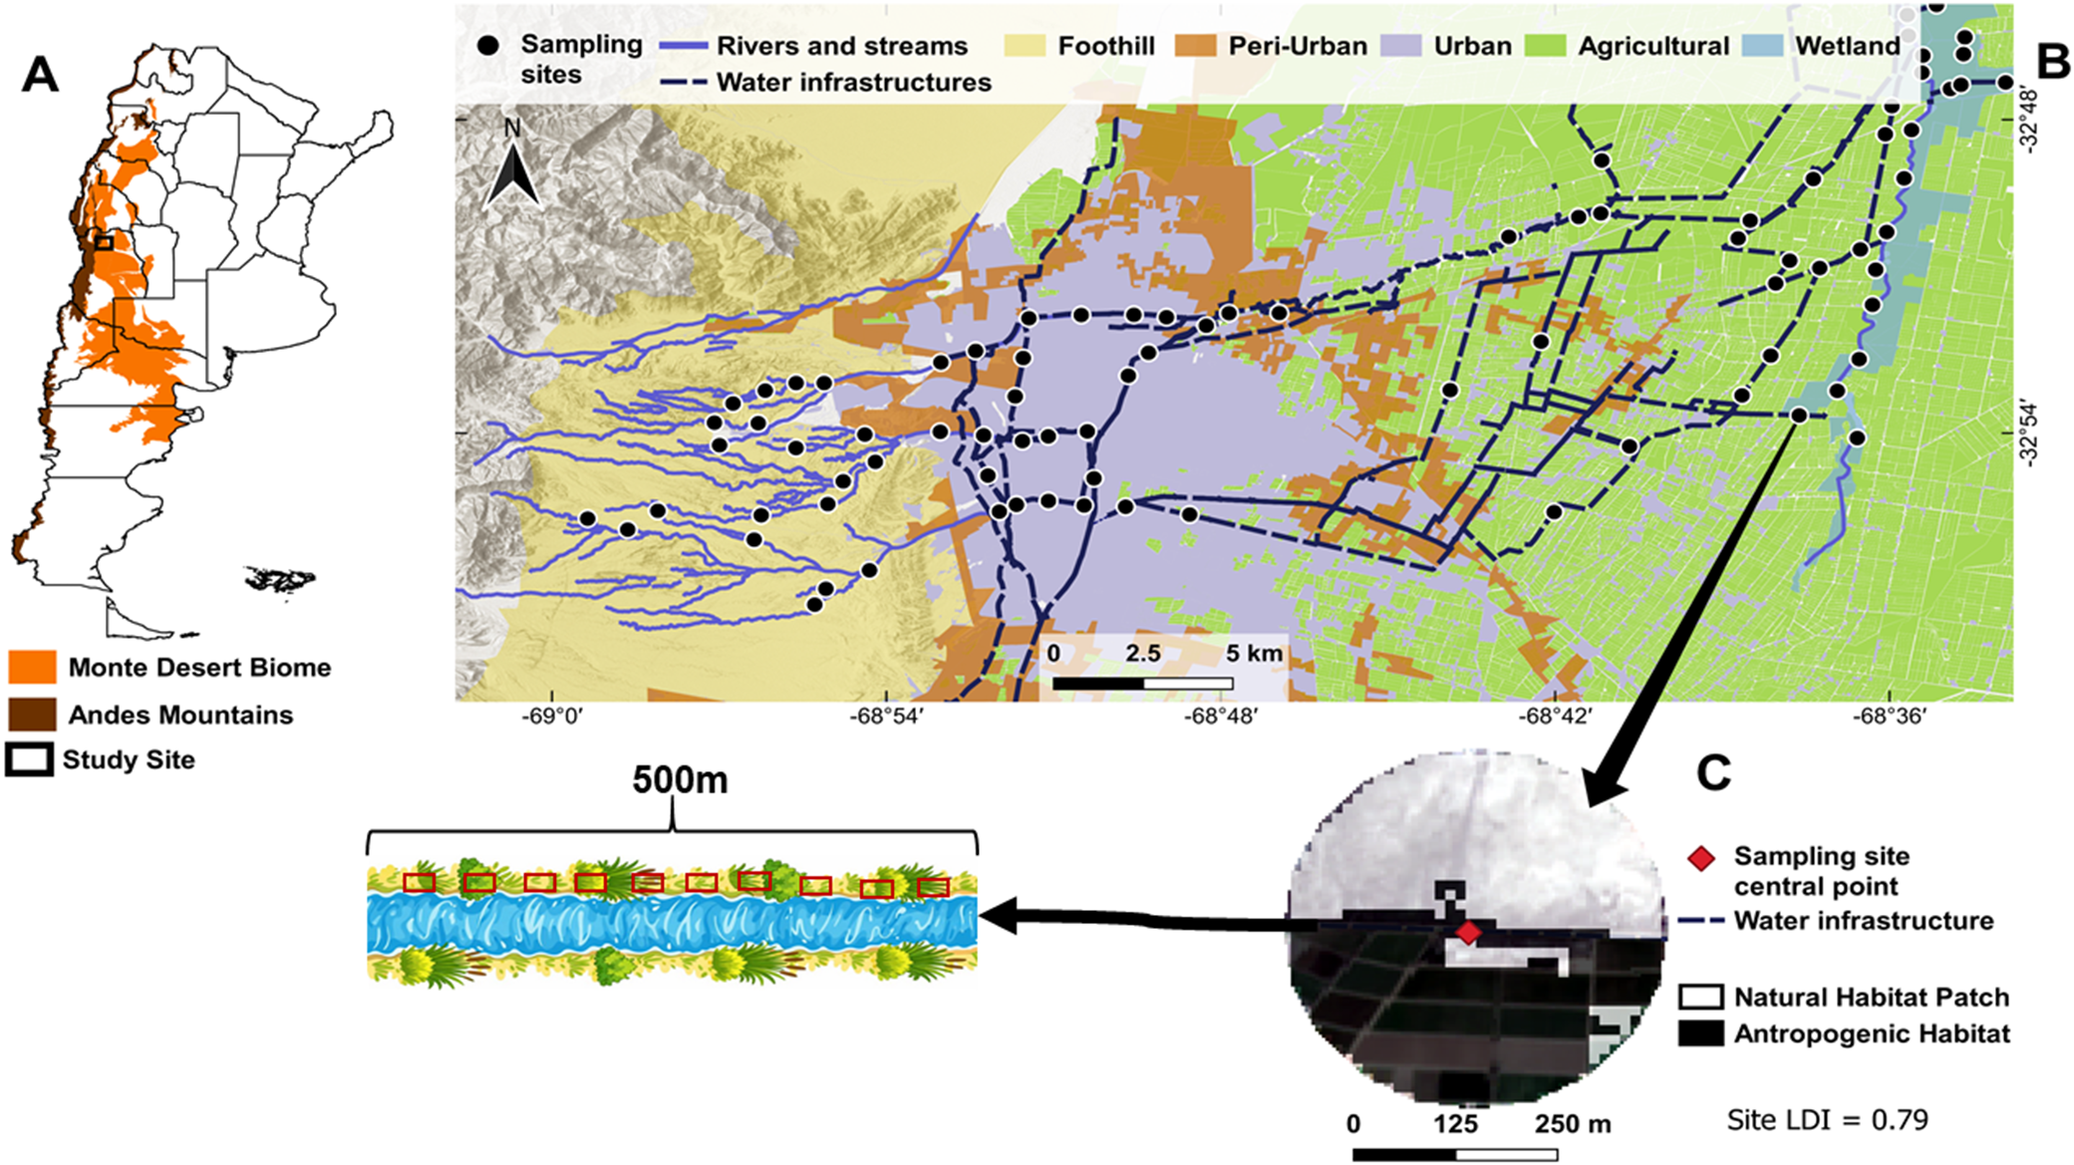
This study is set in the Monte Desert biome in central-western Argentina, east of the Andes Mountains (Roig et al., Reference Roig, Roig-Juñent and Corbalán2009; Figure 1A), more specifically, throughout the Mendoza Metropolitan Area (MMA) (Figure 1B). The study area has a temperate-dry climate, with an aridity index of 0.2 (Zomer et al., Reference Zomer, Xu and Trabucco2022). There is a mean annual precipitation of 270 mm, mostly concentrated between November and March, and mean temperatures range from 26 °C in January to 9 °C in July (SMN, 2025). Precipitation and snowmelt from the Andes Mountains provide water to the MMA population, first accumulating in reservoirs and then being distributed through rivers and water infrastructures such as canals and ditches.
(A) Geographic range of the Monte Desert biome in Argentina, and the location of the study area. (B) Sampling sites among the different landscapes and their riparian habitats of the Mendoza Metropolitan Area (MMA). (C) Representation of a 500 m transect within the riparian habitat with the 10 sampling plots (red rectangles) and an example of the 500 m radius from the centre of the sampling site in one of the riparian habitats.

The MMA consists of an urban area (Mendoza City) and its surrounding natural, semi-natural, agricultural and peri-urban landscapes. For this work, we categorised the study area into five landscapes according to Mendoza’s provincial land-use plan (Department of Environment and Territorial Planning, 2021): foothill, peri-urban, urban, agricultural and wetland (Figure 1B). These landscapes feature distinct riparian habitats and are situated in diverse land-use contexts, providing an ideal setting for bridging the impacts of human drivers on their biodiversity.
Foothill: This natural landscape represents the ecotone between the Andes Mountains and the Monte Desert biome, spanning elevations from 800 to 1500 m above sea level. It contains non-perennial rivers with riparian habitats along their edges, consisting mostly of native shrub and herbaceous vegetation. These non-perennial rivers and their dense xeric vegetation help protect the populated area from landslides and flooding during extreme rainfall events (Gómez and Faggi, Reference Gómez and Faggi2023; Rubio et al., Reference Rubio, Sales, Verdugo and Abraham2023). It also supports recreational activities as well as subsistence sheep and goat farming. Urban areas are expanding through these natural landscapes, threatening their biodiversity and thus their nature’s contributions to people (Díaz et al., Reference Díaz, Pascual, Stenseke, Martín-López, Watson, Molnár, Hill, Chan, Baste, Brauman, Polasky, Church, Lonsdale, Larigauderie, Leadley, Van Oudenhoven, Van Der Plaat, Schröter, Lavorel, Aumeeruddy-Thomas, Bukvareva, Davies, Demissew, Erpul, Failler, Guerra, Hewitt, Keune, Lindley and Shirayama2018) (Supplementary Figure S1A and B).
Peri-urban and urban: The city of Mendoza and its peri-urban surroundings rank as Argentina’s fourth-fastest-growing urban agglomeration, with an 18% expansion of the built-up area over the past four decades (MapBiomas, 2025). It is also the largest and most populated urban area in the Argentine drylands (INDEC, 2022). It has a well-established water infrastructure system, encompassing canals and ditches with varying degrees of permeability, which distribute water for domestic, landscaping, industrial, and agricultural purposes, while also serving as risk controllers against extreme rainfall events (Ruiz and Correa, Reference Ruiz and Correa2015). These water infrastructures sustain riparian habitats, with spontaneous vegetation growing along their edges; however, some of these habitats are often subject to maintenance practices that include mechanical vegetation removal (Supplementary Figure S1C–F).
Agricultural: East of the urban agglomeration lies a vast cultivated landscape that forms a big, irrigated oasis within the Monte Desert biome. The mentioned water infrastructures that cross the urban agglomerations allow the irrigation of vineyards, olive groves and a wide variety of fruit and vegetable crops, cultivated both in greenhouses and open fields (Montaña and Boninsegna, Reference Montaña, Boninsegna, Diaz, Hurlbert and Warren2015). The agricultural water infrastructures also sustain riparian habitats with spontaneous flora, forming green linear landscape elements that surround the cultivations (Supplementary Figure S1G and H).
Wetland: This semi-natural landscape is a relic of an ancient, larger wetland that was drained in colonial times (Prieto and Rojas, Reference Prieto and Rojas2012). It consists of small saline marshes that are connected by a narrow stream and dense riparian habitats of shrubs and herbaceous vegetation. These habitats and their water bodies have been gradually decreasing in the last decade, mainly due to agricultural expansion (Rios et al., Reference Rios, Moreiras, De Porras, Gomez and D’Ambrosio2025). This wetland forms a multifunctional landscape within the irrigated agricultural oasis, which gives it conservation relevance, as it provides habitat for pollinators and other nature’s contributions to people essential for the surrounding cultivations (Díaz et al., Reference Díaz, Pascual, Stenseke, Martín-López, Watson, Molnár, Hill, Chan, Baste, Brauman, Polasky, Church, Lonsdale, Larigauderie, Leadley, Van Oudenhoven, Van Der Plaat, Schröter, Lavorel, Aumeeruddy-Thomas, Bukvareva, Davies, Demissew, Erpul, Failler, Guerra, Hewitt, Keune, Lindley and Shirayama2018; Garibaldi et al., Reference Garibaldi, Zermoglio, Jobbágy, Andreoni, de Urbina, Grass and Oddi2023; Eldridge et al., Reference Eldridge, Wang, Liu, Ding, Li, Wu and Li2024) (Supplementary Figure S1I and J).
Data collection
We sampled plant communities from a total of 86 sampling sites in riparian habitats among the five landscapes (Figure 1B). Each landscape was represented by 20 sampling sites, except for the peri-urban landscape, which had fewer accessible sites, allowing us to sample six plant communities. Fieldwork was conducted during the spring and summer seasons of 2023–2024. Before field trips, we defined and georeferenced 500 m transects using Google Earth Pro at each sampling site. In the field, guided by a handheld GPS, we established the transect along the most accessible edge of the river, stream or water infrastructure. When a pre-defined transect fell within private property, we relocated it to the nearest accessible public site, or we asked for sampling permission from the landowners. Finally, we systematically placed 10 plots of 2 m × 0.5 m at 50 m intervals (Figure 1C). Within each plot, we registered all plant species occurring spontaneously (i.e., not deliberately planted by humans) and estimated their ground cover. Due to the inclusion of different vegetation strata (herbaceous, shrubs, trees and hemiparasites), total ground cover values per plot could exceed 100%. Ground cover was used as a proxy for species abundance (Supplementary Table S1). We then classified all the species according to their status of origin into natives or exotics from the Monte Desert biome, using the System for Biodiversity Information of Argentina (APN, 2025), and the Flora Argentina database (Anton and Zuloaga, Reference Anton and Zuloaga2025) as guidance (Supplementary Table S2).
Habitat fragmentation
We quantified habitat fragmentation using the Landscape Division Index (LDI), defined here as the degree of separation between natural habitat patches within a 500 m radius from the sampling site’s centroid (López et al., Reference Lopez, Urban and White2018; Guo et al., Reference Guo, Shu, Ma and Wang2021; Arce-Peña et al., Reference Arce-Peña, Arroyo-Rodríguez, Avila-Cabadilla, Moreno and Andresen2022; Figure 1C). LDI values range from 0 (unfragmented habitat) to 1 (fully fragmented habitat). First, we generated a land cover layer in QGIS 3.26 (Graser et al., Reference Graser, Sutton and Bernasocchi2025), integrating spatial data from three sources: MapBiomas Argentina Collection 2 (MapBiomas, 2025), the Mendoza Territorial Environmental Information System (SIAT, 2025), and the Open Buildings dataset (Sirko et al., Reference Sirko, Kashubin, Ritter, Annkah, Bouchareb, Dauphin, Keysers, Neumann, Cisse and Quinn2021). The final layer distinguished between natural and anthropogenic habitats. We then calculated LDI values at each of the 86 sampling sites using the R Packages terra (Hijmans, Reference Hijmans2025) and landscapemetrics (Hesselbarth et al., Reference Hesselbarth, Sciaini, With, Wiegand and Nowosad2019), in RStudio (R Core Team, 2025) (Supplementary Table S3). The 500 m radii from the sampling sites did not overlap, helping to minimise spatial dependence among sites.
β-diversity metrics
To assess how different landscapes and habitat fragmentation shape the taxonomic structure of riparian plant metacommunities, we computed both within-site β-diversity, as the taxonomic dissimilarity between all 10 plots of the sampling sites (Baselga and Gómez-Rodríguez, Reference Baselga and Gómez-Rodríguez2019) and pairwise β-diversity, as the dissimilarity among all sampling site pairs within the entire region (Socolar et al., Reference Socolar, Gilroy, Kunin and Edwards2016; Villatarco Vazquez et al., Reference Villatarco Vázquez, Fernández and Albariño2019). We employed the Bray–Curtis dissimilarity index (dBC), which accounts for species abundance. This index is the most suitable and widely used measure of β-diversity for evaluating variation in taxonomic composition and abundance among communities (Lokatis and Jeschke, Reference Lokatis and Jeschke2022). We decomposed this index into its two additive processes of β-diversity: turnover and nestedness. In the dBC, species turnover occurs when the abundance of some species declines from point “a” to point “b,” at the same magnitude that the abundance of other species increases from point “a” to point “b.” On the other hand, nestedness occurs when the abundance of all species equally declines from point “a” to point “b,” with point “b” being a subset of point “a,” without any species substitution. When accounting for species abundance, the turnover process is referred to as balanced variation in species abundance (dBC-bal), and the nestedness process is referred to as abundance gradient (dBC-gra) (Baselga, Reference Baselga2013).
To examine the influence of landscapes with different land-use along the habitat fragmentation gradient on metacommunity structure, we calculated within-site dBC with the betapart R Package, using the function betapart.core.abund (Baselga et al., Reference Baselga, Orme, Villeger, De Bortoli, Leprieur, Logez, Martinez-Santalla, Martin-Devasa, Gomez-Rodriguez and Crujeiras2025). This was made after building a plot-level abundance matrix derived from species ground cover in each of the 10 plots per sampling site (Supplementary Tables S1 and S3). These metrics were computed separately for the total species pool, native species and exotic species, and were used as response variables in subsequent analyses. We then evaluated the proportion of the turnover (dBC-bal) and nestedness (dBC-gra) processes in the dBC of each landscape.
To evaluate the effect of habitat fragmentation in shaping the riparian plant metacommunity structure across the entire region, we estimated pairwise Bray–Curtis dissimilarity indices (pairwise dBC) and partitioned them into turnover (pairwise dBC-bal) and nestedness processes (pairwise dBC-gra). These pairwise metrics were calculated with the vegan and betapart R packages, using the function beta.pair.abund (Baselga et al., Reference Baselga, Orme, Villeger, De Bortoli, Leprieur, Logez, Martinez-Santalla, Martin-Devasa, Gomez-Rodriguez and Crujeiras2025; Oksanen et al., Reference Oksanen, Simpson, Blanchet, Kindt, Legendre, Minchin, O’Hara, Solymos, Stevens, Szoecs, Wagner, Barbour, Bedward, Bolker, Borcard, Carvalho, Chirico, De Caceres, Durand, Evangelista, FitzJohn, Friendly, Furneaux, Hannigan, Hill, Lahti, McGlinn, Ouellette, Ribeiro Cunha, Smith, Stier, Ter Braak, Weedon and Borman2025). We then analysed these matrices across the entire region by elaborating a distance-decay relationship between the pairwise dBC and both spatial distance (Δkm) and habitat fragmentation distance (Δ LDI), with the latter serving as an equivalent of environmental distance (Fitzpatrick et al., Reference Fitzpatrick, Sanders, Normand, Svenning, Ferrier, Gove and Dunn2013). The distance-decay relationship (i.e., the increase in compositional dissimilarity between sampling sites with increasing spatial or environmental distance) is a robust method for evaluating metacommunity structure and its two processes in relation to spatial or environmental gradients (Baselga, Reference Baselga2013; Marcacci et al., Reference Marcacci, Westphal, Wenzel, Raj, Nölke, Tscharntke and Grass2021). Spatial distances between sampling sites were estimated using the Haversine formula on geographic coordinates, with the geosphere R Package (Hijmans, Reference Hijmans2024), while habitat fragmentation distances were estimated as Euclidean distances between the LDI values of sampling sites.
Statistical analyses
To test differences in within-site community dissimilarities (dBC) among landscapes, we fitted Generalised Linear Models (GLMs), using landscape as a categorical predictor with a gamma distribution and a log link to meet model assumptions. Foothill sites were excluded from the exotic species analysis because of the low occurrence of exotic species in this landscape. Post hoc analysis of estimated means was conducted using Tukey’s HSD adjustment to evaluate significant differences in within-site dBC among landscapes (p < 0.05). After exploratory data analysis revealed smooth non-linear effects of habitat fragmentation on within-site dBC, we decided to fit General Additive Models (GAMs) implemented with the mgcv R Package, as in these cases, GAMs are more flexible than GLMs (Wood, Reference Wood2017; Abutaha et al., Reference Abutaha, El-Khouly, Jürgens and Oldeland2021). A Gamma distribution with log link was again used to establish a relationship between the mean of the response variables and a “smoothed” function of the LDI (Guisan et al., Reference Guisan, Edwards and Hastie2002; Wood, Reference Wood2017). We reported the percentage of deviance of our GAMs, which explains how much of the variation in within-site dBC and their partitioned processes is accounted for by habitat fragmentation (LDI), serving as an analogue to r2 in linear models. We also evaluated whether the smooth term (LDI) had a statistically significant effect on the variation in within-site dBC (p < 0.05).
To identify the degree of both spatial (Δkm) and environmental (ΔLDI) distances that structure metacommunities, we performed Mantel tests with 999 permutations, using the vegan R Package (Oksanen et al., Reference Oksanen, Simpson, Blanchet, Kindt, Legendre, Minchin, O’Hara, Solymos, Stevens, Szoecs, Wagner, Barbour, Bedward, Bolker, Borcard, Carvalho, Chirico, De Caceres, Durand, Evangelista, FitzJohn, Friendly, Furneaux, Hannigan, Hill, Lahti, McGlinn, Ouellette, Ribeiro Cunha, Smith, Stier, Ter Braak, Weedon and Borman2025) for Pairwise dBC, its turnover (Pairwise dBC-bal) and nestedness (Pairwise dBC-gra) processes. For visualisation, we added log-linear regression lines only when Mantel tests indicated statistically significant correlations (p < 0.05). We also reported the Mantel coefficient of determination (r2) values, which represent the standardised correlation between distance matrices and pairwise dBC, and their portioned processes.
Results
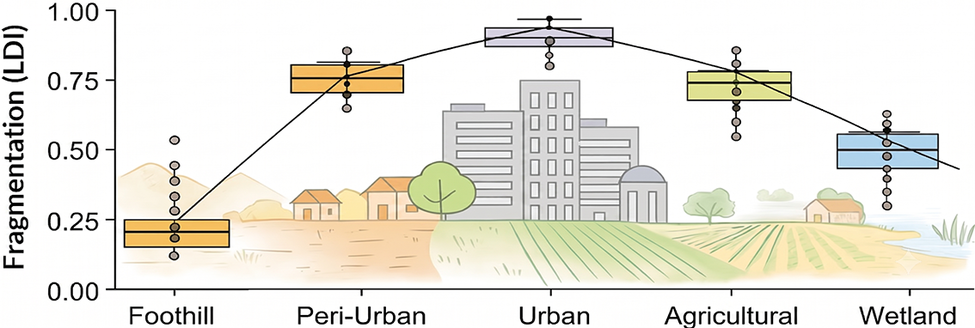
We recorded a total of 154 riparian plant species, from which 42 were found strictly in the foothill, 30 in the peri-urban and urban, 8 in the agricultural, and 8 in the wetland landscapes. From the entire species pool, 64 were exotics, with a relative abundance of 1.2% in the foothill, 46.1% in the peri-urban and urban, 43.5% in the agricultural and 22.5% in the wetland landscapes. Species richness per sampling site ranged from 28 to 3, with a mean of 14 species. LDI values peaked in the urban landscape and were lower in the natural (foothill) and seminatural (wetland) landscapes (Figure 2).
Habitat fragmentation gradient among the five studied landscapes. Habitat fragmentation was quantified with the Landscape Division Index (LDI), defined as the degree of separation between natural habitat patches within a 500 m radius from the sampling site’s centroid. Background conceptual drawings were AI-generated.

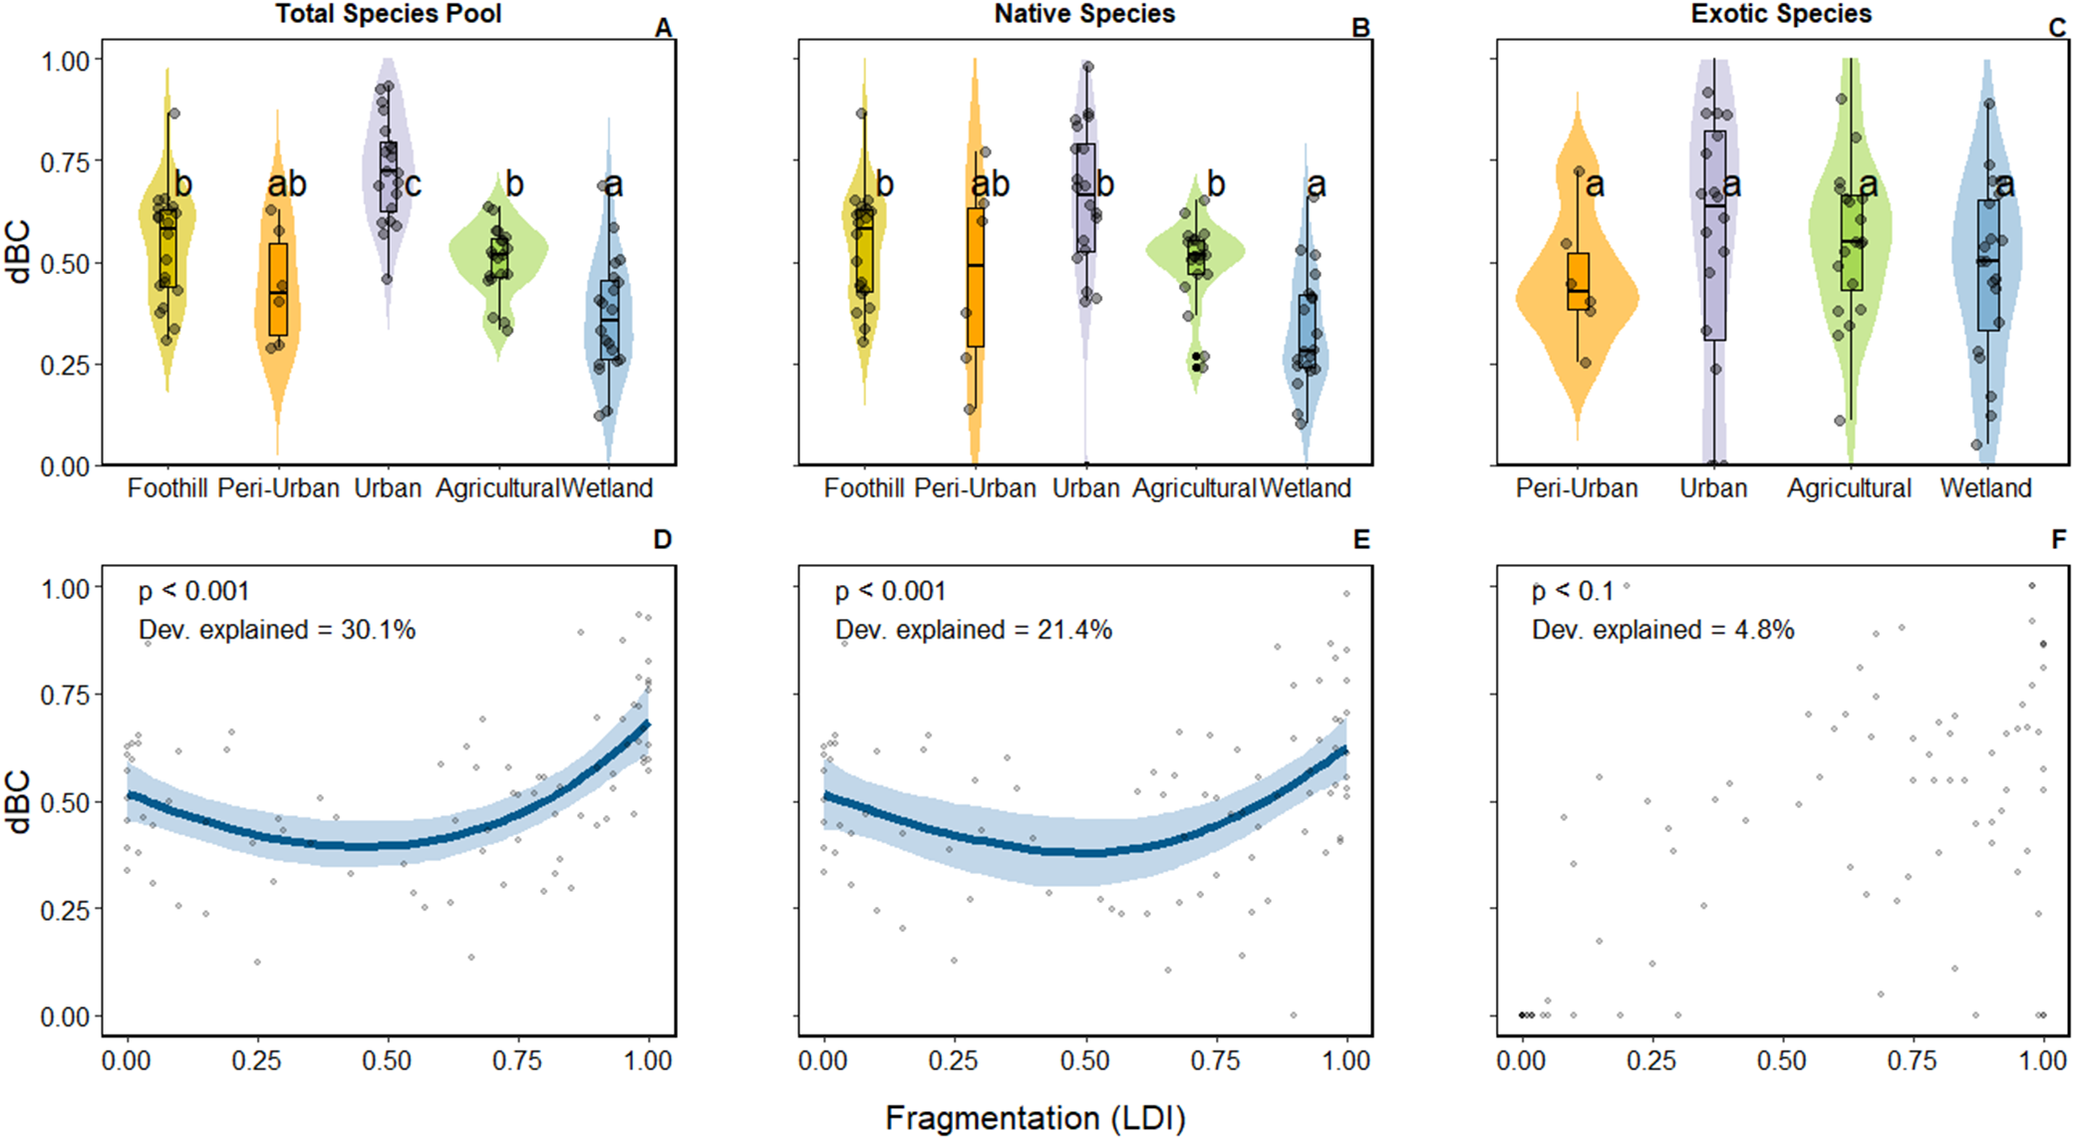
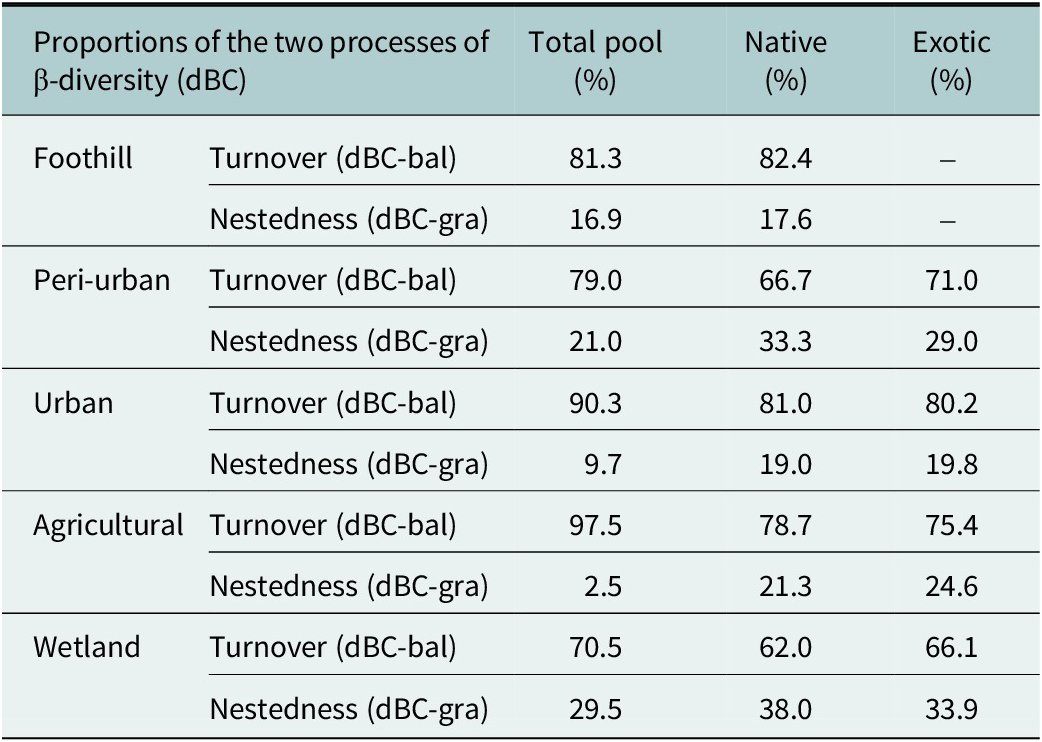
Within-site riparian plant β-diversity (dBC) varied significantly among landscapes, although patterns differed when taking into account native and exotic species pools (Figure 3A–C). For the entire species pool, communities from the urban landscape were more significantly dissimilar than those from other landscapes (p < 0.05). Foothill and agricultural riparian plant communities exhibited comparable levels of dBC, while wetland communities showed low dBC, indicating homogeneous taxonomic compositions across this landscape. When focusing solely on native communities, the urban landscape also showed higher dissimilarities with species such as Leptochloa crinita , Nicotiana glauca , Baccharis salicifolia , and Jarava ichu , standing out as urban-present natives (Supplementary Table S1 and S2). The wetland landscape again stood out as significantly different from the others, supporting taxonomically homogenous native communities. The exotic species pool, however, did not show significant variation in dBC among landscapes, except for the foothill, which lacked exotic species. Among all landscapes and species pools, community dissimilarities were primarily driven by the turnover process (dBC-bal), accounting for more than 75% of the total dBC in most cases, except for the wetlands, which presented a proportion of approximately 1/3 of the nestedness process (dBC-gra) in the total, native and exotic species pools (Table 1).
Within-site β-diversity (dBC: Bray–Curtis dissimilarity index, abundance-based) for the total species pool (A and D), native species (B and E), and exotic species (C and F), among the five studied landscapes (A–C) and along the fragmentation gradient quantified by the Landscape Division Index (LDI) (D–F). Panels A–C display generalised linear model (GLM) predictions of within-site β-diversity among landscapes; each point represents the within-site β-diversity value of a single sampling site. Different letters indicate statistically significant differences among landscapes (p < 0.05). Panels D–F display generalised additive models (GAMs) showing the non-linear relationship between fragmentation (LDI) and within-site β-diversity. The smooth curve is plotted only when the GAM is statistically significant (p < 0.05), and shaded bands indicate 95% confidence intervals. Dev. explained indicates the percentage of deviance in within-site β-diversity explained by the GAM, representing model fit and the strength of the relationship between fragmentation and within-site β-diversity.

Proportion of the turnover (balanced variation in species abundances) and nestedness (abundance gradient) processes within-site β-diversity (Bray-Curtis, abundance-based) among the five studied landscapes for the entire species pool, native species and exotic species

Table 1. Long description
The table details the percentage of turnover (dBC-bal) and nestedness (dBC-gra) processes of within-site beta-diversity for five landscapes across three species pools: Total, Native, and Exotic. Foothill: Total (Turnover 81.3%, Nestedness 18.7%); Native (Turnover 82.4%, Nestedness 17.6%); Exotic (No data). Peri-urban: Total (Turnover 79.0%, Nestedness 21.0%); Native (Turnover 66.7%, Nestedness 33.3%); Exotic (Turnover 71.0%, Nestedness 29.0%). Urban: Total (Turnover 90.3%, Nestedness 9.7%); Native (Turnover 81.0%, Nestedness 19.0%); Exotic (Turnover 80.2%, Nestedness 19.8%). Agricultural: Total (Turnover 97.5%, Nestedness 2.5%); Native (Turnover 78.7%, Nestedness 21.3%); Exotic (Turnover 75.4%, Nestedness 24.6%). Wetland: Total (Turnover 70.5%, Nestedness 29.5%); Native (Turnover 62.0%, Nestedness 38.0%); Exotic (Turnover 66.1%, Nestedness 33.9%).
Habitat fragmentation showed significant, non-linear relationships with dBC in both the entire species pool (p < 0.001) and the native species pool (p < 0.001), but not in the exotic species pool (Figure 3D–F). Communities tended to be taxonomically homogeneous at intermediate levels of habitat fragmentation, and more dissimilar in sites with extreme levels of habitat fragmentation (either low LDI or high LDI).
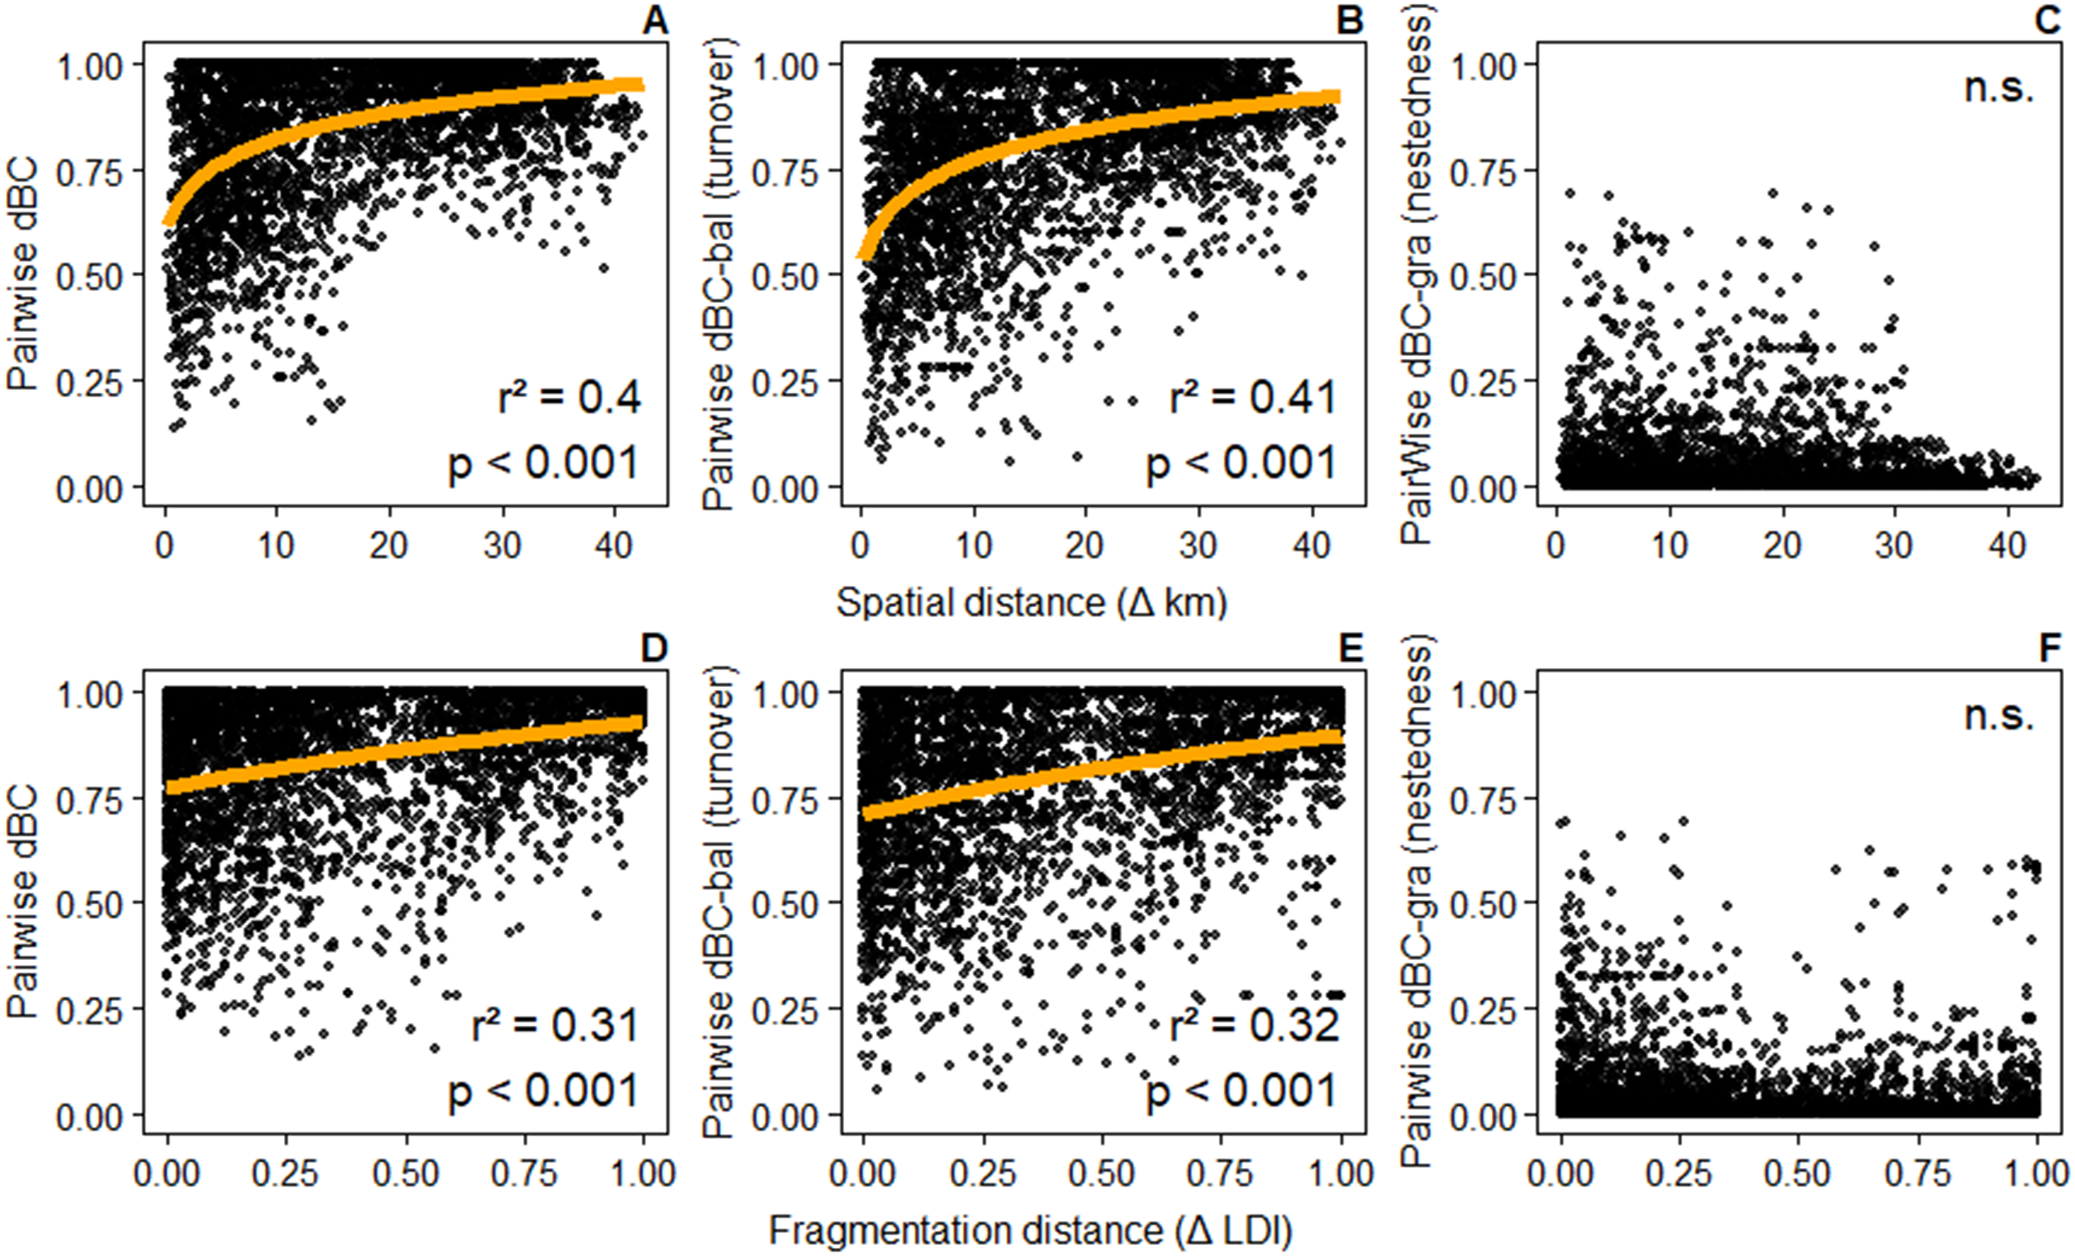
Pairwise riparian plant β-diversity (pairwise dBC) increased significantly with both spatial and fragmentation distances (Figure 4A and D). In other words, communities became more dissimilar as the spatial and fragmentation distances between them increased. Importantly, spatial and fragmentation distances were positively, albeit weakly, correlated (r 2 = 0.21; Supplementary Figure S2). Spatial distance accounted for 40% of the variation in pairwise dBC, while fragmentation distance accounted for 31%. In both cases, variations in pairwise dBC were mainly driven by the turnover process (pairwise dBC-bal) (Figure 4B and E), whereas the nestedness process (pairwise dBC-gra) showed no clear relationship with spatial or fragmentation distances (Figure 4C and F).
Pairwise β-diversity (dBC: Bray–Curtis dissimilarity index, abundance-based) as a function of spatial (Δ km) (A–C) and fragmentation (Δ LDI) (D–F) distances. Panels represent pairwise β-diversity (A and D), its turnover process (balanced variation in species abundances, dBC-bal) (B and E), and the nestedness process (abundance gradient, dBC-gra) (C and F). Orange regression lines represent log-transformed linear relationships fitted only when Mantel tests were statistically significant (p < 0.05). Values of the Mantel coefficient of determination (r 2) and significance (p values) are shown in each panel. n.s. indicates a non-significant relationship.

Discussion
By integrating biodiversity field surveys with geospatial datasets, we analysed how β-diversity and its processes of turnover and nestedness respond to different land-use contexts along a habitat fragmentation gradient in riparian habitats from a South American dryland. We found that β-diversity of plant communities was lowest at intermediate levels of habitat fragmentation. We also reported, for the first time, the influence of habitat fragmentation as an environmental gradient metric on β-diversity. This metric is useful for biodiversity studies of human-driven landscapes, as it integrates the processes of natural habitat loss, the increase in the number of natural habitat patches, and their isolation (Fahrig, Reference Fahrig2003). Using a distance-decay relationship, we demonstrated that habitat fragmentation significantly drives riparian plant metacommunity structure. Along the habitat fragmentation gradient, turnover dominated over nestedness, indicating that species replacement, rather than species loss, is the primary process driving community taxonomic dissimilarities.
We evaluated habitat fragmentation as the main continuous explanatory variable for plant metacommunity structure, although multiple environmental and human drivers interact in these complex landscapes (Grilo et al., Reference Grilo, McPhearson, Santos-Reis and Branquinho2022). As an example, Williams et al. (Reference Williams, Schwartz, Vesk, McCarthy, Hahs, Clemants, Corlett, Duncan, Norton, Thompson and McDonnell2009) proposed four urban environmental filters expected to shape plant biodiversity: habitat transformation, habitat fragmentation, urban environmental conditions, and human preferences. Recent research in the MMA has evaluated the combined effects of these four urban environmental filters and found that habitat fragmentation acts as the strongest predictor in shaping riparian plant functional traits (Asad and Tabeni, Reference Asad and Tabeni2026). Similarly, studies in other regions, such as eastern North American temperate forests, showed that the combination of habitat transformation and fragmentation was the best explanatory variable for changes in riparian plant taxonomic diversity (López et al., Reference Lopez, Urban and White2018). Comparable patterns were reported for birds (Marcacci et al., Reference Marcacci, Westphal, Wenzel, Raj, Nölke, Tscharntke and Grass2021) and mammals (Püttker et al., Reference Püttker, De Arruda Bueno, Prado and Pardini2015; Arce-Peña et al., Reference Arce-Peña, Arroyo-Rodríguez, Avila-Cabadilla, Moreno and Andresen2022) in fragmented tropical regions. It should also be noted that our study considers only taxonomic β-diversity, while functional β-diversity, which incorporates plants’ functional traits, may show different patterns.
Our results do not support either the first or second hypotheses. We initially hypothesised that the most fragmented habitats would exhibit high taxonomic homogenisation, driven by the dominance of a few widespread exotic species at the expense of local extinctions of natives. Instead, both low and highly fragmented habitats exhibited higher β-diversity. These unexpected patterns suggest that highly fragmented urban riparian habitats can host taxonomically distinct plant communities composed of native and exotic species, primarily through the process of turnover, as species and their abundances are replaced rather than lost among sites (Baselga, Reference Baselga2013). Two non-exclusive mechanisms may explain this pattern. First, urban riparian habitats encompass heterogeneous environmental conditions over short spatial distances (Aronson et al., Reference Aronson, Patel, O’Neill and Ehrenfeld2017), which can enhance community dissimilarities. In a recent review, this pattern was observed in half of the global studies on urban plant biotic homogenisation (Lokatis and Jeschke, Reference Lokatis and Jeschke2022). Second, recurrent disturbances in these particular urban riparian habitats, such as strong water flow during extreme rain events and mechanical vegetation removal, may suppress the dominance of exotic species, allowing for greater coexistence with natives (Lázaro-Lobo and Ervin, Reference Lázaro-Lobo and Ervin2021).
Conversely, we observed that taxonomic homogenisation peaked at intermediate levels of habitat fragmentation. This is particularly evident in the wetland landscape. This low β-diversity may be intrinsic to the landscape itself, as its high soil salinity and flooding pulses naturally select for a narrow pool of stress-tolerant species with highly specific functional traits adapted to these conditions. However, this landscape also appears to be suffering a recent process of human-driven taxonomic homogenisation, as anthropogenic pressures intensified in the last decade (Tallei et al., Reference Tallei, Benavidez, Schaaf, Isola and Zanotti2021; Tabeni et al., Reference Tabeni, Asad, Tallei, Bender and Rossi2026). Unlike urban and peri-urban riparian communities, which are composed of species already adapted to historically established disturbance regimes, the wetland flora is facing novel environmental filters. This is likely caused by increasing habitat fragmentation, in addition to the gradual water loss, and the soil and water pollution from agrochemicals of the surrounding agricultural landscape (Rios et al., Reference Rios, Moreiras, De Porras, Gomez and D’Ambrosio2025). It would be ideal to repeat these samplings over time to assess temporal changes and trends in β-diversity. Furthermore, future studies should evaluate whether these fragmentation-driven homogenisation patterns also hold at intra-landscape scales.
Our third hypothesis is partially supported, as habitat fragmentation is a key driver of riparian plant metacommunity structure, but nestedness is not the dominant process. As expected, pairwise β-diversity increased with spatial distances, likely reflecting broader environmental gradients and limited propagule dispersal over long distances (Socolar et al., Reference Socolar, Gilroy, Kunin and Edwards2016; Aronson et al., Reference Aronson, Patel, O’Neill and Ehrenfeld2017). Habitat fragmentation distance explained nearly as much variation in pairwise β-diversity as spatial distance, capturing independent environmental gradients (Fitzpatrick et al., Reference Fitzpatrick, Sanders, Normand, Svenning, Ferrier, Gove and Dunn2013). As highlighted by Socolar et al. (Reference Socolar, Gilroy, Kunin and Edwards2016), approaches using pairwise β-diversity are critical tools for conservation and territorial planning because they allow the identification of explicit environmental or geographic drivers that structure regional biodiversity. Our distance-decay analysis revealed that turnover is the dominant process in structuring riparian metacommunities along the habitat fragmentation gradient. Thus, fragmentation does not generate species-poor communities that are subsets of richer ones from less fragmented areas, suggesting that habitat patch arrangement along the habitat fragmentation gradient generates communities with a distinct subset of species and low dispersal between sites (Soininen et al., Reference Soininen, Heino and Wang2018; Jiménez et al., Reference Jiménez, Zavala-Hurtado, Vega and Márquez-Haro2024).
Riparian habitats in drylands are a great example of ecological components that provide refugia for native species within human-driven landscapes (Selwood and Zimmer, Reference Selwood and Zimmer2020). Our findings support this perspective, demonstrating that urban and agricultural riparian habitats sustain a high abundance of native species. The foothill landscape, in particular, harbours highly specialised and dissimilar native dryland plant communities, indicating its ecological value and importance for conservation in the face of ongoing urban expansion in the MMA. It is crucial to impede the advancing biotic homogenisation that threatens the essential nature’s contributions to people, such as climate regulation, soil fertility, and habitat provision for pollinators. Given that species turnover is the dominant component of β-diversity across the region, conservation strategies must shift away from merely protecting isolated, species-rich hotspots. Under the framework of Socolar et al. (Reference Socolar, Gilroy, Kunin and Edwards2016), the dominance of turnover processes along environmental gradients dictates that protected area networks must target multiple sites to successfully prevent species loss.
In practice, territorial planning in the MMA should focus on maintaining a highly heterogeneous landscape matrix that incorporates diverse management options and incentives rather than enforcing uniform spatial designs. This can be achieved through the active creation, restoration and preservation of ecological corridors along rivers, streams, canals and ditches. An interconnected riparian network is essential to sustain the process of species replacement observed here and prevent biotic homogenisation and its negative effects on nature’s contributions to people.
Conclusions
Riparian habitats across the human-driven landscapes of the Monte Desert biome act as vital reservoirs for taxonomically unique native communities. Habitat fragmentation was linked to biotic homogenisation at intermediate levels, with increasing β-diversity at low and highly fragmented habitats, being a key human driver of riparian plant metacommunity structure. These findings contribute to the still-limited understanding of biodiversity patterns in human-driven drylands, which are projected to face accelerating transformation. As effective biodiversity conservation decisions in landscapes with rapid urban and agricultural expansion depend on accurate biodiversity assessments and detailed spatial data, we expect this work to contribute to such decisions.
Open peer review
For open peer review materials, please visit https://doi.org/10.1017/dry.2026.10047.
Supplementary material
The supplementary material for this article can be found at http://doi.org/10.1017/dry.2026.10047.
Data availability statement
R scripts used for this work are available on https://github.com/joaquinasad/Asad-Tabeni_RiparianPlantMetacommunityStructure/tree/main
Acknowledgements
We want to thank Catalina Vergne-Jatuff, Mariano Tagua, Diego Zeverini, Lucía Elgueta, and Benjamín Bender for field and technical support, and Lorena Bonjour for helping identify plant species in the Ruiz Leal Herbarium (MERL), IADIZA, CONICET, Mendoza. We also want to thank the editor and an anonymous reviewer, whose comments considerably improved this manuscript.
Author contribution
All authors contributed to the study’s Conceptualization: J.A., S.T.; Data curation: J.A.; Final approval: J.A., S.T.; Formal Analysis: J.A.; Funding acquisition: J.A., S.T.; Supervision: S.T.; Validation: S.T.; Writing-original draft preparation: J.A.; Writing-review and editing: S.T.
Funding statement
This work was financed with funds from CONICET Argentina (PIP 2022-2024, 00318CO), Wikimedia Argentina (Community Projects 2023-2024), and the Neotropical Grassland Conservancy (Student Grants 2023).
Competing interests
The authors declare no conflicts of interest.
Declaration of use of Artificial Intelligence tools
We used Google Gemini Pro (gemini.google.com) between November 2025 and February 2026 to assist with grammar checking, some Spanish-to-English translations, and text refinement. Additionally, as noted in the Figure 2 caption, this tool was used to generate the background conceptual images. The authors thoroughly reviewed and verified all outputs and maintain full accountability for the final content of the manuscript.


 Open access

