I. Introduction
Location or origin of production has long been a prominent feature both of wines (Burgundy, Champagne, etc.) and of beers (Pilsen [Plzeň], Kölsch [Cologne], and Pale Ale [Burton-on-Trent], etc.). The recent boom in U.S. craft breweries has dramatically increased interest in local hop production, which has resulted in an unprecedented expansion of hop-growing areas nationally. According to the Hop Growers of America (2019), the area of hops grown has increased from 40,126 acres in 2009 to 57,468 acres in 2018, making the United States the largest grower of hops in the world, both by acreage (38% of world hop acreage) and production (42% of total hop produced in 2018). Germany is the second largest hop grower in the world (35% of total hop production in 2018).
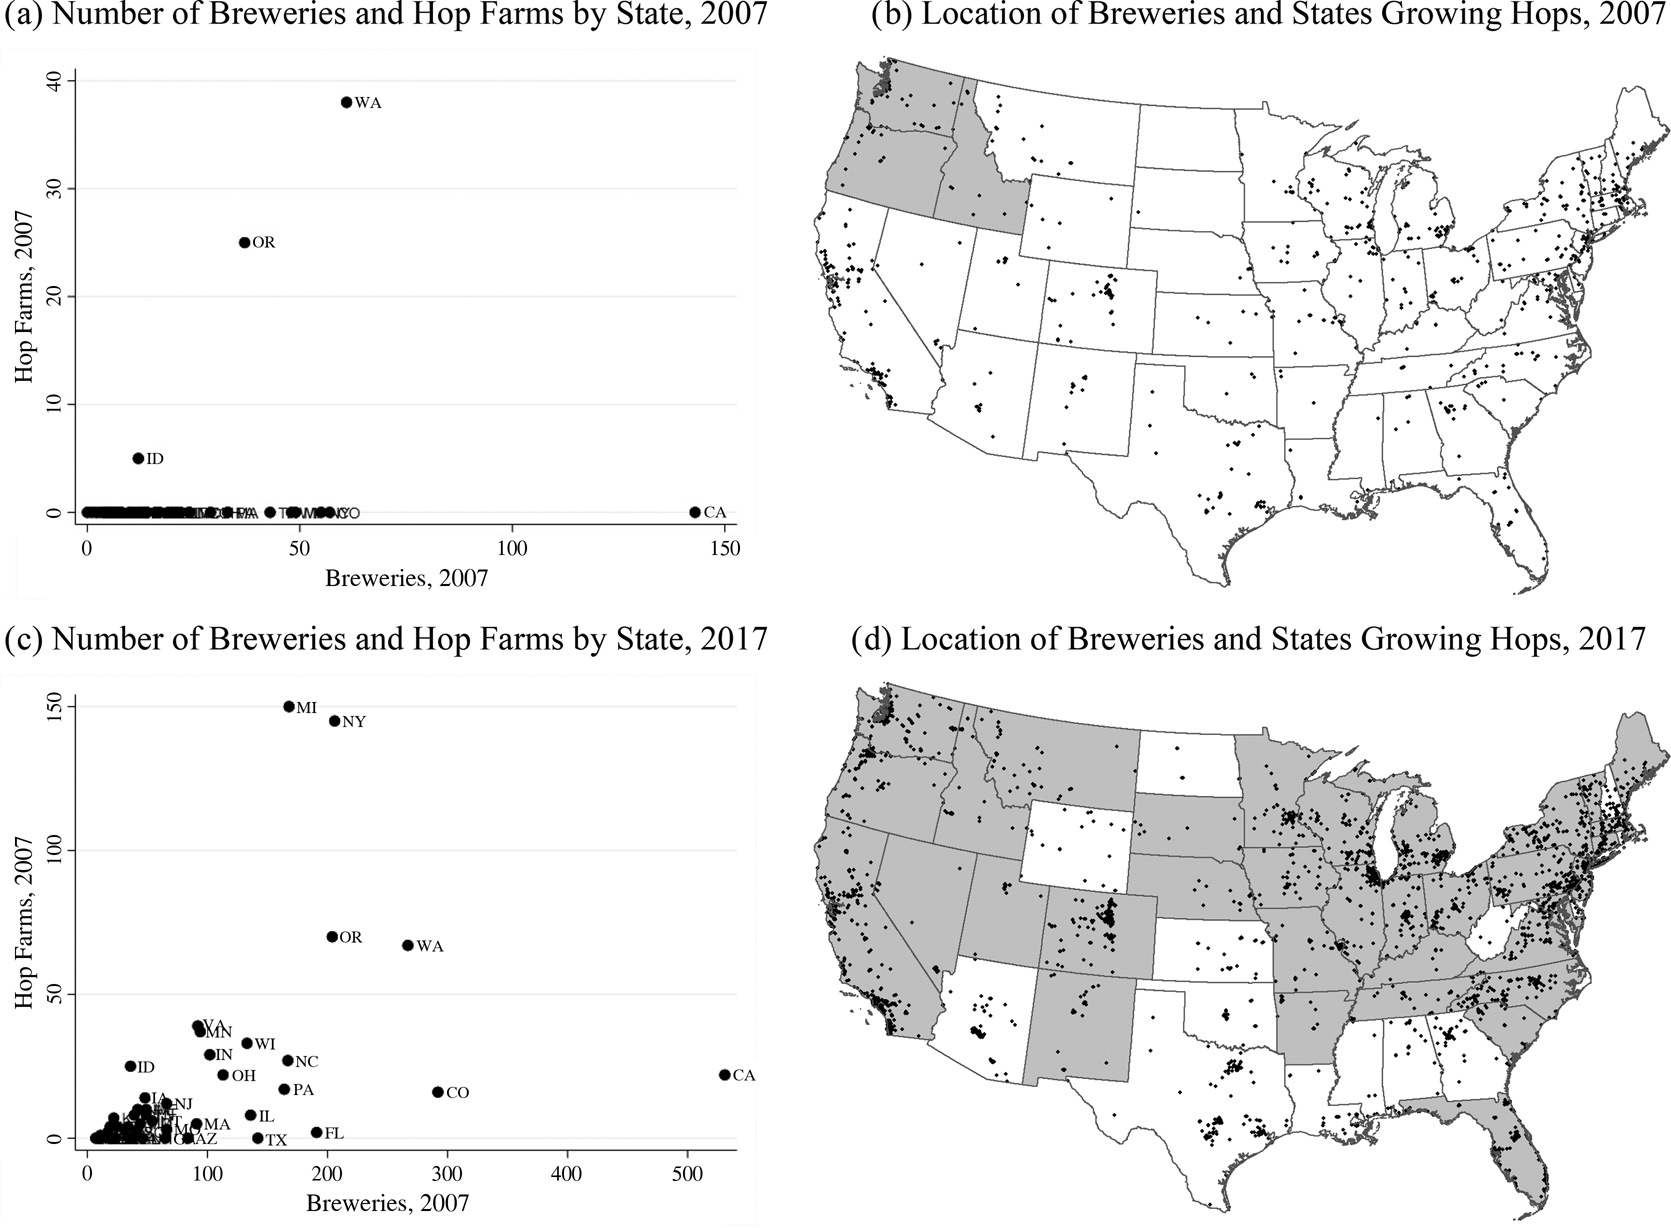
Hops are the female flower of the hop plant (Humulus lupulus), a perennial herbaceous vine, that grows best between latitudes 35 and 55 degrees. Within that latitude range, hops prefer the long summer daylight hours found at 45 degrees (Hartis, Reference Hartis2015). Hops function as a “bittering agent, as an aroma contributor, and as a preservative” (Schönberger and Kostelecky, Reference Schönberger and Kostelecky2011, p. 259) and are categorized according to their dominant characteristic. The center of the American hop industry is the Pacific Northwest states of Washington, Oregon, and Idaho. Until recently, all American hops were grown in these three states; however, the number of states growing hops currently stands at 29 states (Hop Growers of America, 2019). According to U.S. National Agricultural Statistics Service (NASS) data from the early 20th century, this trend represents a shift of hop production back to places of historical production in the Northeast, as well as an unprecedented shift to new regions (Krakowski, Reference Krakowski2014). We hypothesize that this increased spatial dispersion of hop growers in the last ten years corresponds with an increase in the number of craft breweries. Since 1980, craft beer production and breweries have expanded from the Pacific Northwest, into the Northeast and upper Midwest, before moving into the lower Midwest and South (Elzinga, Tremblay, and Tremblay, Reference Elzinga, Tremblay and Tremblay2015).
While most craft breweries are locally owned, many of the ingredients that comprise the beer are imported from other states or countries. Water is often the only local ingredient, with hops, barley, and yeast coming from elsewhere. Germany is, by far, the largest exporter of hops to the United States, with 7.56 million pounds in 2018; Australia is second with 1.37 million pounds in 2018 (Hop Growers of America, 2019). Recently, interest has grown in increasing the local content of craft beer by incorporating more locally grown ingredients, and this has been particularly true of hops. Craft brewers produce more hop-intensive beer styles, such as India Pale Ales, than macro-brewers, so despite only comprising 13.2% of the U.S. beer market, craft breweries use between 40 and 50% of hops harvested (Watson, Reference Watson2014).
The growth in demand for local hops and beers is driven by mostly younger beer drinkers who are attracted by the greater diversity of beer styles offered by craft brewers (McLaughlin, Reid, and Moore, Reference McLaughlin, Reid and Moore2016), as well as a renewed interest in supporting local economies through the purchase of locally made products. Craft breweries represent a “rejection of national, or even regional culture, in favor of something more local” (Flack, Reference Flack1997, p. 49) and the desire of many individuals to “reestablish connections with local communities, settings, and economies” (Schnell and Reese, Reference Schnell, Reese, Patterson and Hoalst-Pullen2014, p. 168). Consumers prefer local beer, particularly when drinking outside their favored style (e.g., IPA, Sour, Stout) (Hart, Reference Hart2018). Beyond consumer preference, policy also influences the demand for local inputs. For example, farm breweries in New York must currently obtain 60% of their inputs from the state, and by 2024 the requirement will be 90% (New York State Brewers Association, nd). Additionally, farmers increasingly seek alternative sources of income, and the production of hops is one option.
The increasing use of local hops has resulted in discussions on the applicability of the concept of terroir to beer brewing (Schimke, Reference Schimke2018). Several studies have examined the impact of growing location on hop characteristics. Their findings suggest that location does affect the characteristics of hops, including flavor, aroma, and bitterness (Van Holle et al., Reference Van Holle, Van Landschoot, Roldán-Ruiz, Naudts and De Keukeleire2017; Hieronymus, Reference Hieronymus2015; Green, Reference Green1997). According to Bart Watson, Chief Economist for the Brewers Association, “for craft brewers looking for ways to differentiate, having local input [hops] is a good way to go” (Trotter, Reference Trotter2016). In this article, we explore the role of craft breweries in stimulating local hop production across the United States between 2007 and 2017. If craft breweries stimulate local hop production, this could have important implications for state agricultural development policies, including potential strategies for keeping more farms in business.
II. Data and Model
We explore whether increasing demand for local hops results in a larger number of local hop producers as well as hop acres, planted both by existing and new growers. We assume that the majority of hops grown in these new locations are being purchased locally by brewers within the same state. We analyze whether the number of hop farms in a state is related to the number of craft breweries over the ten-year period from 2007 to 2017, holding constant other factors hypothesized to contribute to increased numbers of growers. Higher numbers of growers in a region could also enhance local competition for supplying brewers (and raise quality, although we do not test for this here). Our work contributes to the expanding literature on local breweries and their local supply chains, including earlier work that examines the determinants of craft breweries expansion (Malone and Lusk, Reference Malone and Lusk2016).
Figure 1 shows that growth in the number of hop farms and the number of breweries across the United States has been exponential, especially since 2012, while Figure 2 shows that growth coincides with a dramatic change in the geographic distribution of hop farms and breweries. In 2007, Washington had the most hop farms (38) and acres (22,907), while California had the largest number of breweries (143), which was well above the state-level average of 20 breweries. By 2017, Washington remained the leader in hop acres (38,679), while California still led in breweries (531) by a wide margin, followed by Colorado (292) and Washington (267). However, even though the number of hop farms in Washington (67) grew, it was eclipsed by Michigan (150) and New York (145), which had more than twice as many farms growing hops. To mitigate spurious correlation between breweries and hops production, we include a time effect in the regression model.
Number of Hop Farms and Breweries in the United States, 2002 to 2017

Number and Location of Breweries and Hop Farms by State, 2007 and 2017

We estimate a pooled count modelFootnote 1 with the following specification:

where Hops st is the number of hop farms or acres in state s at time t, Breweries s(t–1) is the number of breweries in state s at time t – 1, X s(t–1) is a matrix of time-lagged state-level factors that influence hop production (temperature, rainfall, net farm income, agricultural land values, and farm size), δ t are time effects, Breweries s(t–1)*δ t are interactions that capture the effect of breweries over time, and ε st are state cluster-robust errors. The model utilizes production and farm data from the U.S. Census of Agriculture, breweries data from ReferenceUSA, and climatic data from the U.S. National Oceanic and Atmospheric Association (NOAA), resulting in a three-period panel analyzed over five-year time periods. We lag the explanatory variables to mitigate endogeneity concerns and allow for responses over time, while the time fixed effects capture changes over time, including higher hop prices.
Hop farms are our primary dependent variable, largely due to data limitations. In states with fewer than four farms or one dominant producer, measures of quantity, such as acreage and pounds of production, are suppressed to prevent disclosure of confidential information. Thus, we use the number of farms growing hops as a proxy for the local supply of hops, as this value is never suppressed. This also allows us to focus on local clustering; in the firm location and cluster literatures, the number of establishments rather than total production matters for competition (e.g., Goetz, Reference Goetz1997; Goetz, Deller, and Harris, Reference Goetz, Deller and Harris2009). However, because quantity is an important component of the production of hops, we also estimate the model using unsuppressed acreages, recognizing that our results may be slightly biased due to missing data.
While states may seem too large to analyze “local” production of beer and hops, smaller geographic areal units such as counties are too disaggregated to capture trends in agricultural commodities with a small number of farms. Additionally, craft breweries are primarily located in urban areas, which may span several counties, and source their “local” hops from surrounding counties where land is available to grow the hops. Therefore, using county-level data would not capture the “local” relationship between brewers and growers.
III. Regression Results
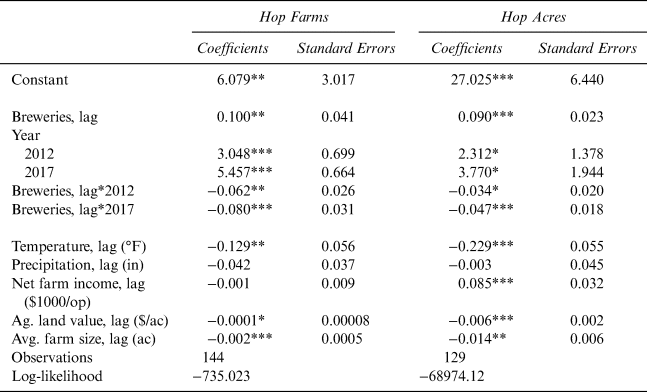
We present the regression results for both hop farms and hop acres in Table 1.Footnote 2 As hypothesized, additional craft breweries (which make up 98.6% of all breweries) are associated with an increase both in the number of hop farms and hop acres five years later. Interactions between breweries and years indicate that this relationship is weakening over time, but that the overall relationship between craft breweries and hop farms and acres is still positive.
Pooled Count Regression Results

Notes: The asterisks *, **, and *** denote statistical significance at the 10%, 5%, and 1% levels, respectively. Hop farm results used a negative binomial distribution, while hop acre results used a Poisson distribution.
Climatic variables have an important impact on producers’ ability to grow hops, which is particularly noteworthy in the context of climate change. A higher average annual temperature is associated with fewer hop farms and acres, and average annual precipitation has no statistical effect on either hop farms or acres, perhaps because irrigation is an option. However, precipitation may become an issue in the future as increases in rainfall, especially in the Northeast, will likely raise production costs due to the need for mold control measures. For land grant universities and plant breeders, an interesting question will be how this changes as new varieties are developed.
Economic variables also influence a farmer's decision to grow hops. In states where net income per farm is higher, more hop acres are grown, possibly because they are better able to absorb risks associated with hop production, but this has no effect on the number of hop farms within a state. Where the opportunity cost of land is higher, there are fewer hop farms and acres of hops grown. Finally, states with a larger average farm size have fewer hop farms, and farms that do grow hops plant fewer acres, all else equal. These scale trade-offs with particular reference to growing hops are worthy of further analysis in the future.
IV. Conclusions and Future Research
The number of hop farms and breweries have increased exponentially over the last ten years, both in overall number and geographic dispersion. Several U.S. states, especially in the Northeast and Midwest, are now once again producing hops after having largely abandoned the crop over 100 years ago (Rumney, Reference Rumney1998; Krakowski, Reference Krakowski2014). We also find that a larger number of breweries in a state is associated both with a greater number of hops farms and with more acres of hops being grown, even when considering growth over time as well as other climatic and economic factors.
A better understanding of the challenges associated with developing a vibrant local hops industry outside of the Pacific Northwest is needed. This could be best achieved by surveying and educating craft brewers and hop farmers, determining for which varieties brewers see the greatest potential, and ascertaining how this demand could be addressed by hop varieties that grow well under local conditions. Finally, increased sourcing of local hops by craft breweries can generate significant benefits for local economies. In Ohio, for example, craft breweries spend an estimated $10 million on out-of-state hops, while Colorado brewers import 95% of their hops from out-of-state (Ison, Reference Ison2015; Markus, Reference Markus2014). Engaging in import substitution will potentially result in more money being retained in local economies.