I. INTRODUCTION
The functional properties of oxides in ferroelectric, ferromagnetic, optic, and other electronic devices promise enhanced performance and novel applications. However, large challenges exist when integrating certain oxide materials with thin film systems as a consequence of restricting thermal budgets to minimize chemical reactions and maximize substrate and electrode compatibility. Due to the sensitivity of BaTiO3 to processing temperature, Reference Aygün, Ihlefeld, Borland and Maria1 carbon removal, Reference Aygün, Ihlefeld, Borland and Maria1,Reference Frey, Xu, Han and Payne2 strain, Reference Shaw, Suo, Huang, Liniger, Laibowitz and Baniecki3,Reference Streiffer, Basceri, Parker, Lash and Kingon4 and physical scale, Reference Aygün, Ihlefeld, Borland and Maria1,Reference Frey, Xu, Han and Payne2,Reference Arlt, Hennings and de With5,Reference Zhao, Buscaglia, Viviani, Buscaglia, Mitoseriu, Testino, Nygren, Johnsson and Nanni6 this class of materials serves as a model system for understanding how refractory thin film oxide processing can be improved.
Adding sintering aides to multilayer ceramic capacitors reduces firing temperatures to levels compatible with alloyed or base-metal electrodes. Reference Kishi, Mizuno and Chazono7 Liquid forming fluxes encourage densification and grain growth at lower temperatures for BaTiO3-based materials and other refractory complex oxides. Reference Prakash, Sharma, Rama Mohan and Gopalan8 Recently, liquid-phase work was extended to epitaxial films Reference Takahashi, Yonezawa, Ohtani, Kawasaki, Nakajima, Chikyow, Koinuma and Matsumoto9 and polycrystalline Ba1−x (Sr x )TiO3 films Reference Ihlefeld, Borland and Maria10–Reference Harris, Lam, Burch, Li, Rogers, Dickey and Maria12 grown using chemical solution deposition, radio frequency (RF)-magnetron sputtering, and pulsed laser deposition. Densification and grain growth occurs at significantly lower temperatures, improving the dielectric and ferroelectric properties of these complex oxide systems without increasing the thermal budget. However, for BaTiO3-thin films, the final average grain size is limited to around 300 nm, with further flux additions leading to deteriorated properties or abnormal grain growth and heterogeneous microstructures.
Burn Reference Burn13 and Hennings Reference Hennings and Schreinemacher14,Reference Hennings and Schreinemacher15 first recognized combinations of copper oxide and other modifiers as effective sintering aides for BaTiO3. Both authors reported densification by 1100 °C, but explorations of the dielectric properties were initially limited. Later studies isolated CuO (Ref. Reference Li, Yang, Xue, Xue and Chen16) and CuO–BaO, Reference Yang17 again demonstrating substantial grain growth at lower temperatures, with appreciable improvements to the dielectric constant. In this report, CuO additions to the BaTiO3 with and without BaO–B2O3 (BBO) are studied using pulsed laser deposition. CuO is added to the system in the form of a thin buffer layer sputtered on the substrates prior to BaTiO3 deposition. Addition of CuO or CuO + BBO to BaTiO3 films encourages densification and grain growth and realizes large improvements to the linear and nonlinear dielectric properties.
II. EXPERIMENTAL PROCEDURE
CuO buffer layers were deposited using RF-magnetron sputtering at room temperature from a commercial 2-in. CuO target (Kurt J. Lesker, Pittsburgh, Pennsylvania). A pre-sputter of 10 min in 12 mTorr Ar was followed by CuO film deposition using a power of 100 W, a target–substrate distance of 7 cm, and an atmosphere of 5 mTorr Ar. The deposition rate was calibrated to 17 nm/min and the deposition time was varied to control the CuO buffer layer thickness.
Thin films were prepared from pure BaTiO3 or BaTiO3 targets containing 2.2% by mass of BBO 869 °C eutectic composition flux on various CuO buffered and unbuffered substrates using pulsed laser deposition (Coherent Compex Pro 102 F; KrF laser λ = 248 nm). The BBO flux was synthesized using chemical solution precipitation Reference Harris, Burch, Ihlefeld, Lam, Li, Dickey and Maria11 and ball milled with commercial BaTiO3 (Sakai Trading Company, Osaka, Japan; high purity perovskite BT-01) before pressing and sintering in air at 1100 °C for 1 h. The laser fluence was 1.5 J/cm2, the laser repetition rate 7 Hz, the target–substrate distance was 7.5 cm, the substrate temperature was held at 400 °C to promote dense deposition, and the ambient atmosphere was held at 30 mTorr O2. Post deposition crystallization was performed in air in a tube furnace. All films, regardless of the substrate, were processed and characterized identically. (0001) c-Sapphire substrates were purchased from Jiaozuo City Crystal Photoelectric Material Co., Ltd. (Jiaozuo, China). (100) MgO substrates were purchased from CrysTec (Berlin, Germany).
Microstructure characterization was performed using an FEI Verios field-emission scanning electron microscope (FE-SEM; FEI Company, Hillsboro, Oregon). Grain size measurements and distributions were performed using linear intercept stereology. 18 Dielectric properties were measured with a HP 4192A impedance analyzer (1 MHz; HP, Palo Alto, California) using 150 nm thick direct current (DC)-sputtered platinum interdigitated contacts defined via photolithography with a gap size of 2 μm, a gap length of 200 µm, and a total of 40 fingers. Temperature-dependent measurements were performed on a MMR Technologies (San Jose, California) miniature refrigerator stage starting at elevated temperatures with a ramp rate of −6 °C/min. Phase analysis of samples on sapphire was performed using x-ray diffraction (XRD) on a PANalytical Empyrean (Almelo, The Netherlands) with Bragg–Brentano geometry and a Cu–Kα source. For samples on MgO, the substrate reflections from the W emission in the x-ray source are substantially stronger. Therefore, XRD of samples on MgO was performed using a parallel beam hybrid double-bounce monochromator source with a parallel plate collimator on the detector that removes spectral reflections and Kα2 reflections.
Transmission Kikuchi diffraction was performed at 30 kV on a DualBeam FEI Quanta 3D FE-SEM using an Oxford Instruments NordlysNano electron backscatter diffraction (EBSD) detector (Abingdon, United Kingdom). Samples were prepared using focused ion beam (FIB) milling in the DualBeam FEI Quanta 3D FEG-SEM/FIB. Postprocessing and map creation of the transmission Kikuchi diffraction data was performed on Oxford Instruments Aztec software and the HKL CHANNEL5 program Tango.
III. RESULTS AND DISCUSSIONS
A. Growth on c-sapphire
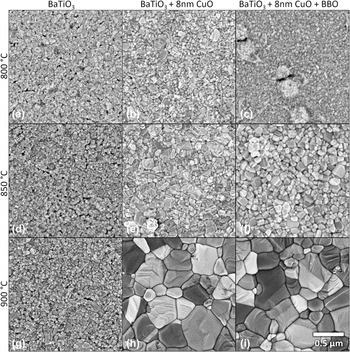
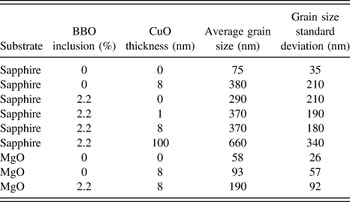
Figure 1 shows a compilation of SEM plan-view images of barium titanate films without additions, with a sputtered 8 nm CuO buffer layer, and with an 8 nm CuO buffer and BBO. The three different sets were annealed at 800, 850, and 900 °C in air for 1 h for crystallization, densification, and grain growth. As expected, pure BaTiO3 exhibits limited grain growth and only minor densification at the temperatures studied. Adding an 8 nm CuO buffer layer prior to BaTiO3 deposition results in densification and grain growth at 800 °C, with higher temperatures leading to a substantially coarser microstructure. At 800 °C, BaTiO3 + BBO deposited on 8 nm of CuO appears dense, but with a finer microstructure than with the CuO layer alone. Annealing at 900 °C, above the expected liquid formation temperatures in these systems, Reference Zhang, Osamura and Ochiai19,Reference Levin and McMurdie20 leads to substantial grain growth. The final microstructures of BaTiO3 + CuO with and without BBO appear similar in density and grain size. After annealing at 900 °C, the average grain size increases from 75 nm in pure BaTiO3 to 380 or 370 nm with 8 nm CuO or CuO + BBO. Table I summarizes the average grain size and standard deviations for samples processed above the liquid forming temperature in these systems.
SEM plan-view micrographs of [(a), (d), and (g)] pure BaTiO3, [(b), (e), and (h)] BaTiO3 + 8 nm CuO, and [(c), (f), and (i)] BaTiO3 + 8 nm CuO + 2.2% BBO on c-sapphire annealed at 800, 850, and 900 °C in air.

Average grain sizes of films annealed at 900 °C (above the liquid-forming temperature).

Figure 1(c) shows round ∼100 nm hillocks, as well as nearby areas of an additional second phase, that are present after annealing samples containing both CuO and BBO at 800 °C or lower. These second phases are not present in the BaTiO3 or BaTiO3 + CuO systems, indicating that this feature likely arises from CuO–BBO interactions. When annealed at 800 °C, XRD reveals only the c-sapphire substrate, BaTiO3, and a strong CuO peak, indicating that the round features are possibly due to de-wetting of liquid phases prior to reaction with BaTiO3. Upon heating to higher temperatures, these hillocks disappear [Figs. 1(f) and 1(i)] and the intensity of the
 $\left( {\bar 111} \right)$
CuO XRD peak lessens (not shown), indicating loss of texture or incorporation into other phases.
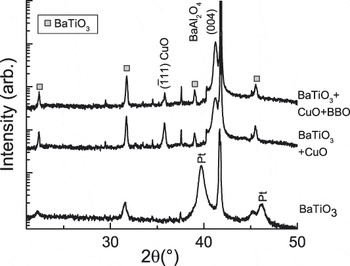
XRD patterns of the samples annealed at 900 °C are shown in Fig. 2. Both of the systems that include CuO exhibit stronger and sharper BaTiO3 peaks that are consistent with the large increase in grain size. A strong reflection matching
 $\left( {\bar 111} \right)$
CuO indicates its presence in both systems. In the as-deposited BaTiO3 diffraction patterns, this peak is also present, but is significantly weaker and broader after annealing. The strength of the diffraction peak and fact that only members of the
 $\left( {\bar 111} \right)$
family are present indicate that during heating or BaTiO3 deposition, the CuO becomes highly oriented. The presence of the (004) peak of BaAl2O4 is also of interest. Previous work showed that BaAl2O4 forms via an interface reaction when BaTiO3 is prepared on c-sapphire, and this phase formation is accelerated in the presence of the flux.
Reference Burch, Li, Harris, Maria and Dickey21
Note that this interface phase will lead to a Ti-rich BaTiO3 composition in the films without BBO.
XRD patterns of BaTiO3 on c-sapphire annealed at 900 °C with 8 nm CuO and 8 nm CuO + 2.2% BBO additions. The pure BaTiO3 sample includes Pt top electrodes. Unlabeled peaks are due to substrate reflections.

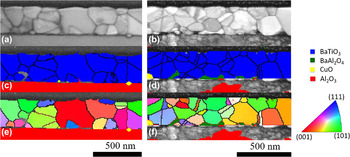
Transmission Kikuchi diffraction from CuO-containing films with and without BBO flux is shown in Fig. 3. Linear stereology of available cross-sections yields average grain sizes in agreement with the plan-view SEM, however caution should be exercised in this analysis due to the significantly smaller population size of the cross-sections. The images reveal that the second phases observed in x-ray scans are located at the film–substrate interface. Both films contain residual areas of CuO in the form of small interface grains, suggesting de-wetting. The phase map [Fig. 3(d)] of the sample containing both CuO and BBO shows BaAl2O4 single crystal grains consistent with previously reported transmission electron microscopy (TEM) analysis, Reference Harris, Burch, Ihlefeld, Lam, Li, Dickey and Maria11,Reference Harris, Burch, Li, Dickey and Maria22 however the Kikuchi phase map of the film with only CuO [Fig. 3(c)] contains areas at the interface that cannot be indexed due to low pattern quality. The patterns from these regions are consistent with, and likely to be BaAl2O4, with very fine grain size, or with substantial crystallographic disorder, as BaAl2O4 is observed in the x-ray patterns for the same samples. The large un-indexed area beneath the BaTiO3 thin film with BBO is believed to arise from a region containing highly disordered alpha and gamma alumina resulting from the interface reaction. Reference Burch, Li, Harris, Maria and Dickey21 The Kikuchi patterns from these regions are diffuse and indicate substantial crystallographic disorder, which leads to the low indexing rate. Crystallographic orientation maps [Figs. 3(e) and 3(f)] show the relative orientations of each grain and confirm the presence of twin boundaries that are also evident in the SEM images (Fig. 1).
Transmission Kikuchi diffraction maps of BaTiO3 thin films with [(a), (c), and (e)] 8 nm of CuO present during growth and a thin film with [(b), (d), and (f)] 8 nm of CuO and 3% BBO flux present during growth. Parts (a) and (b) are the band contrast images of the respective thin films; (c) and (d) are the phase maps, which shows the presence of the BaTiO3, Al2O3, CuO, and BaAl2O4; (e) and (f) are the crystallographic orientation maps showing the orientation of each grain (relative to the page normal) with the orientation of BaTiO3 grains given by the inverses pole figure legend to the right.

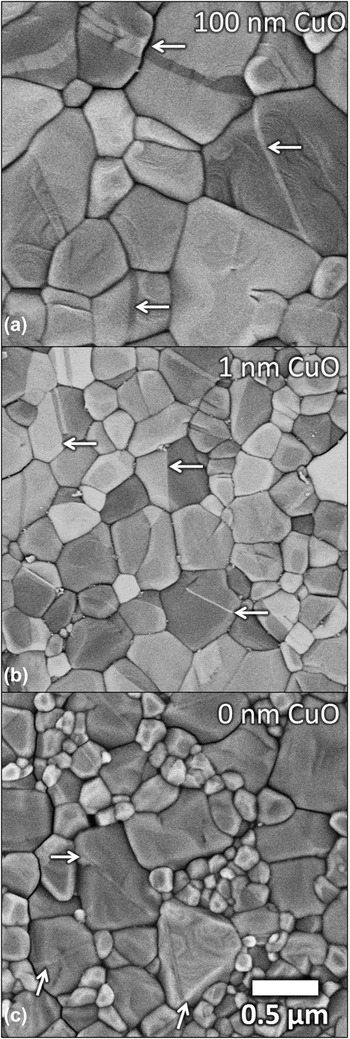
The presence of BaAl2O4 has been shown to lead to {111} twin nucleation that drives abnormal grain growth in BaTiO3. Reference Harris, Burch, Li, Dickey and Maria22 These twin lamellae are also present in CuO-containing systems, and are shown in Figs. 1(h) and 1(i) as straight lines of contrast in several of the larger grains. The twin lamellae are apparent in the samples with and without BBO. To understand the impact of CuO on the microstructure, a series of films varying the amount of CuO was prepared and analyzed. Figure 4 shows SEM plan-view micrographs of BaTiO3 + BBO deposited on CuO as a function of CuO layer thickness. In this experiment, all films containing CuO exhibit twin lamellae with an increasing prevalence for twinning with thicker CuO layers. While there is clear dependence on CuO thickness, adding even ∼1 nm of CuO, as seen in Fig. 4(b), leads to additional grain growth and an overall microstructural homogenization when compared to BaTiO3 + BBO. The average grain size of BaTiO3 + BBO without CuO is 290 nm. This increases to 370 nm with 1 nm of CuO and to 660 nm with 100 nm of CuO.
SEM plan-view micrographs of pure BaTiO3 + BBO on (a) 100 nm, (b) 1 nm, and (c) 0 nm of CuO annealed at 900 °C on c-sapphire. Example {111} twins are indicated by arrows.

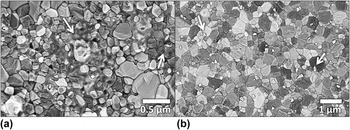
To understand better how and when second phases evolve, we compare XRD and SEM data after the 900 °C anneals for samples with 8 nm CuO and 2.2% BBO. BaAl2O4 and CuO second phases are clearly discernible via XRD (Fig. 2). Figure 5(a) is a plan-view SEM micrograph that highlights the second phases that are apparent in these samples. For the sample with BBO and CuO [panel (a)], there are visible patchy regions whose smooth unfaceted morphology suggest a previously molten state. The segregation of these regions and the boundary curvature are consistent with poor wetting, and the previous studies of BaO–CuO on BaTiO3 that found a contact angle of 42°. Reference Derling, Müller and Abicht23 Figure 5(b) shows a similar SEM image of BaTiO3 + 8 nm CuO without BBO. These films did not contain the patchy, and likely glassy second phase regions, however there are small ∼100 nm particles on top of BaTiO3 grains and grain boundaries. While we do not know their composition, we speculate that they are Cu-containing.
SEM plan-view micrographs of second phases in (a) BaTiO3 + 8 nm CuO + 2.2% BBO and (b) BaTiO3 + 8 nm CuO, after annealing at 900 °C. Arrows indicate the location of second phases.

In the related BaTi4O9 (Ref. Reference Lim, Nahm, Kim, Kim, Paik and Lee24) and Ba(Zn1/3Nb1/3)O3 (Ref. Reference Kim, Jeong, Nahm, Kim and Lee25) systems, adding CuO–B2O3 sintering aides leads to a BaCuB2O5 intermediate at 850 °C and lower sintering temperatures. The BBO composition in our system forms a eutectic melt at 869 °C,
Reference Levin and McMurdie20
however CuO addition introduces additional possible melts involving BaCuO2 or Ba2CuO3 near 900 °C.
Reference Zhang, Osamura and Ochiai19
XRD reveals no evidence for these crystalline second phases, and none match well with the
 $\left( {\bar 111} \right)$
CuO peak that is visible on samples both with and without BBO. Further obscuring our understanding is Al diffusion from the substrate.
Reference Burch, Li, Harris, Maria and Dickey21
Although no liquids are predicted to form below 1000 °C in the CuO–Al2O3 system,
Reference Gadalla and White26
no complete study of the aggregate Al–Cu–Ba–Ti–B–O system exists, complicating understanding of the exact mechanisms and possible liquids formed. However, interactions of BBO with CuO clearly lead to enhancement of grain growth, and, as will be discussed in detail later, removal of Al2O3 from the system reduces grain growth, suggesting that the combination of Cu and Al additions alter BaTiO3 interactions with the BBO liquid.
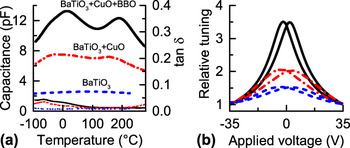
While the BBO + CuO system shows promise for densification and grain growth, it is important to consider the impact on the dielectric response. To study the dielectric properties, capacitance as a function of temperature, shown in Fig. 6, was measured from films grown on c-sapphire and annealed at 900 °C. The use of surface interdigitated contacts makes reliable extraction of permittivity nontrivial, however as the film thicknesses and capacitor geometry were constant for all samples, the changes in capacitance are approximately proportional to changes in the thin film permittivity. In summary, adding an 8 nm CuO buffer layer to BaTiO3 leads to a 3-fold increase in capacitance over the measured temperature range. Adding BBO further increases the permittivity, yielding a 5× increase at room temperature.
(a) Capacitance and dielectric loss tangent versus temperature and (b) relative tuning with applied DC field after thermal de-aging for samples on c-sapphire annealed at 900 °C. Measurements were performed at 1 MHz.

In both samples containing CuO, there are two permittivity maxima as a function of temperature, each corresponding to phase transitions in BaTiO3. The maxima are most pronounced when both CuO and BBO are present—this is interesting considering the similarity of microstructures seen in Figs. 1(h) and 1(i). Compared to the bulk Curie temperature, the ferroelectric–paraelectric phase transition shifts lower for pure BaTiO3 thin films (T C = ∼100 °C), and higher for films with CuO (T C = 165 °C) and CuO + BBO (T C = 190 °C) additions. We attribute the lower temperature shift in pure BaTiO3 to very fine grain sizes, Reference Zhao, Buscaglia, Viviani, Buscaglia, Mitoseriu, Testino, Nygren, Johnsson and Nanni6,Reference McCauley, Newnham and Randall27 while the higher shifts for modified films are attributed to residual thermal expansion mismatch strain from the sapphire substrate. Reference Harris, Burch, Ihlefeld, Lam, Li, Dickey and Maria11 Bulk ceramic studies of CuO additions to BaTiO3 show that CuO can shift the ferroelectric transition, however, disagreement exists in the literature regarding the direction of this shift in bulk ceramics. Irrespective of their direction, all temperature shifts in bulk ceramics are limited to less than about 10 °C, substantially smaller than the ∼50 °C increase observed in our flux-grown thin films. Consequently, the increases in T C that we observe cannot be explained solely by chemical modification from fluxing agents, thus thermal strains likely play a predominant role. Reference Hennings and Schreinemacher15–Reference Yang17
The absolute maximum in capacitance does not occur at the cubic–tetragonal (paraelectric–ferroelectric) transition as expected, but rather occurs near the lower temperature tetragonal–orthorhombic (ferroelectric–ferroelectric) transition. All samples with CuO show this peak, although the effect is most pronounced in those containing CuO + BBO. Ihlefeld et al. found a similar maximum in permittivity for BaTiO3 with excess BaO on metal Cu foils heated at 1200 °C for 20 h. Reference Ihlefeld, Daniels, Aygün, Borland and Maria28 We note that we do not observe this peak for BaTiO3 + BBO films prepared without CuO regardless of grain size, Reference Harris, Burch, Ihlefeld, Lam, Li, Dickey and Maria11 suggesting that CuO leads to this lower temperature maximum in a manner that we currently do not try to explain.
Capacitance–voltage (C–V) measurements, shown in Fig. 6(b) as relative tuning plots, serve as a probe for nonlinear dielectric properties and the relative contributions of ferroelectric domain wall motion to the material permittivity. Adding CuO to pure BaTiO3 leads to a modest increase of tuning from 1.5:1 to 2:1, while addition of both CuO and BBO boosts the ratio to 3.5:1. We attribute the capacitance increase that accompanies CuO addition to an increase in grain size and density. Since the grain size of CuO and CuO + BBO samples are similar, some other mechanism must describe the large increase in capacitance that occurs when both BBO and CuO are present. We explain this observation by first considering that both films contain BaAl2O4. However, for the CuO modified film, the only source of Ba is the original and stoichiometric BaTiO3. Consequently, BaAl2O4 formation will make the BaTiO3 barium poor, which is associated with lower permittivity. Reference Lee, Hong and Jang29 BBO additions can compensate for Ba loss to BaAl2O4 and preserve the desired 1:1 stoichiometry.
The second mechanism that impacts the dielectric response, and may be composition dependent, is aging, which can cause domain wall pinning and a reduction in extrinsic contributions. Reference Lupascu, Genenko and Balke30 To explore this possibility, the voltage-dependence of capacitance and loss were compared as a function of time and postanalysis heat treatments.
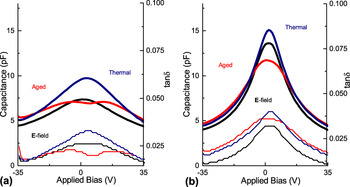
C–V measurements of the samples containing CuO, taken 2 mo after film deposition and annealing, showed signs of aging with distorted voltage dependencies. Figure 7 shows C–V for the same samples in the aged and recovered states. Recovery was accomplished by electric field cycling at room temperature or thermal annealing at 250 °C. All samples that contained CuO flux, regardless of BBO inclusion, exhibited aging phenomena, but the effect is most pronounced for samples containing only CuO. This is consistent with reports for BaTiO3 ceramics showing that CuO incorporation leads to aging and reduced dielectric and nonlinear properties. Reference Tan, Zhang and Wang31 Current understanding suggests that Cu occupies the Ti site acting as an acceptor, and stabilizes oxygen vacancies in the material. Reference Langhammer, Müller, Böttcher and Abicht32 Over time, defect dipoles form and pin domain wall motion, which leads to property reductions. Reference Robels and Arlt33 De-aging by cycling ±35 V DC pulses for 1000 cycles or heating in air at 250 °C for 30 min then quenching in air increased room temperature capacitance and restored a symmetric C–V curve. All of the data in Fig. 6 represent measurements taken immediately after de-aging via heating above T C. While there is no model presently available to explain this trend, it is possible that simultaneous composition modifications with Cu and B alter the extent to which Cu occupies the B-site, or interfere with the ability of defect dipoles to align with ferroelectric domains. In either case, the BaTiO3 with BBO and CuO is more resistant to aging than BaTiO3 with only CuO.
Capacitance–voltage and dielectric loss measurements of (a) BaTiO3 + 8 nm CuO and (b) BaTiO3 + 8 nm CuO + BBO films after aging for 2 mo at ambient conditions (aged), and after de-aging at 250 °C for 30 min (thermal) or 1000 cycles of ±35 V (E-field). Measurements were performed at 1 MHz.

B. Microstructures on MgO
c-Sapphire substrates are convenient substrates by virtue of their wide current availability and low cost, however, they complicate understanding of the BaTiO3–CuO–BBO system through substrate reactions that occur during annealing.
Reference Burch, Li, Harris, Maria and Dickey21
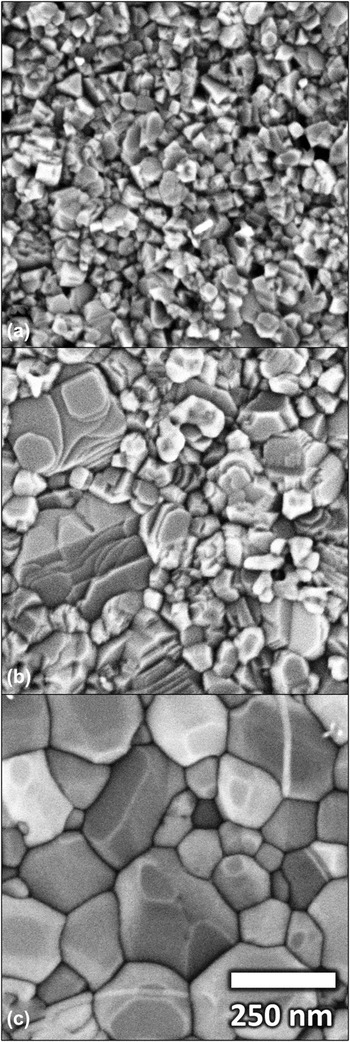
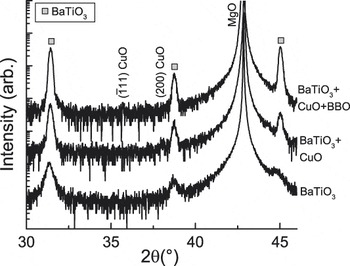
Changing the underlying substrate to MgO eliminates the role of Al diffusion and BaAl2O4 formation in the system. CuO and BaTiO3 films were prepared on (100) MgO with identical processes to those on sapphire discussed previously. Figure 8 shows plan-view SEM images of the series of pure, CuO, and CuO + BBO BaTiO3 on MgO after a 5 s etch in 5% HCl. Pure BaTiO3 films on MgO are extremely fine grained. As seen in a similar sample series prepared on c-sapphire, adding CuO or CuO + BBO leads to substantial densification and grain growth, although the scale of the microstructure for all samples is greatly reduced (note the difference in scale bar for the images on MgO or values in Table I). The average grain size for pure BaTiO3 on MgO is 58 nm. This increases to 90 nm with 8 nm CuO and then to 190 nm with BBO addition. This reduction in the efficacy could be due to negative interactions of the flux with the MgO substrate, however the only second phase peaks visible via XRD, shown in Fig. 9, are weak CuO. These results suggest that the inability to observe larger grain growth—in comparison to sapphire substrates—is the lack of Al in the system. Additionally, while the CuO grows
 $\left( {\bar 111} \right)$
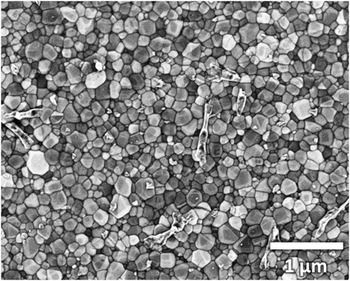
on c-sapphire, CuO seems to have limited or no preferred growth direction on MgO. Just as with sapphire, second phases on the surface of the film are visible in SEM images shown in Fig. 10. It is interesting to note that the microstructure trends on MgO are identical to those on c-sapphire, but they occur on a different scale. Adding BBO to BaTiO3 on MgO increases grain size, but the distribution is bimodal with large BT grains in a very fine matrix, and adding CuO greatly homogenizes the distribution. This observation leads again to the unexpected trend where incorporating Al2O3, a refractory oxide typically used to modify sintering behavior above 1150 °C,
Reference Young, Hilmas, Zhang and Schwartz34,Reference Wu, Liu, Cao, Shen, Yao, Hao and Luo35
enhances lower temperature transport in the BaTiO3–B2O3–CuO system.
SEM plan-view micrographs of (a) BaTiO3, (b) BaTiO3 + 8 nm CuO, and (c) BaTiO3 + 8 nm CuO + BBO on MgO and annealed at 900 °C.

XRD patterns of BaTiO3 on MgO annealed at 900 °C with 8 nm CuO and 8 nm CuO + BBO additions.

SEM plan-view micrograph of BaTiO3 + 8 nm CuO + 2.2% BBO on MgO and annealed at 900 °C showing second phase.

Figure 8(c) is a plan-view SEM image of BaTiO3 modified with CuO and BBO where an equiaxed microstructure is achieved. Notable in this SEM image is linear contrast within the grains that are likely {111} twin lamellae. This contrast does not appear to be associated with abnormally large grains as is the case for BaTiO3 + BBO on c-sapphire, nor is BaAl2O4 or Ba6Ti17O40 present in XRD patterns (Fig. 9), both phases known to seed twinning. Reference Harris, Burch, Li, Dickey and Maria22,Reference Krasevec, Drofenik and Kolar36 CuO shares the monoclinic C2/c space group of Ba6Ti17O40, however the structure of CuO is noticeably different, with no Ti–O octahedra that provide a topotactic interface between Ba6Ti17O40 and BaTiO3. Reference Krasevec, Drofenik and Kolar37
Derling et al. noted that BaTiO3 with CuO and excess BaO led to elongated grains, stabilization of hexagonal BaTiO3 at 150 °C lower than expected, and abnormal grain growth. Reference Derling, Müller and Abicht23 While Derling et al. did not discuss SEM sample preparation or characterize twinning behavior, the final microstructure is reminiscent of microstructures seen in TiO2-excess BaTiO3 ceramics, with elongated abnormally grown grains surrounded by a finer rounded grain matrix. Reference Lee, Chung and Kang38–Reference Lee, Chung and Kang40 A later study of BaO–CuO in BaTiO3 found similar abnormal grain growth and hexagonal phase behavior, and SEM micrographs of etched samples clearly demonstrate twin lamellae. Reference Langhammer, Müller, Böttcher and Abicht32 This understanding of CuO-modified BaTiO3 ceramics leads to the hypothesis that the linear contrast visible in Fig. 8(c) originates from a similar composition-driven phenomenon. Reference DeVRIES41,Reference Eibl, Pongratz and Skalicky42 We can add, however, that the composition effect is not solely associated with CuO since twinning in BaTiO3 has been associated with a variety of composition changes. Reference Harris, Burch, Li, Dickey and Maria22,Reference Lee and Kang39,Reference DeVRIES41,Reference Eibl, Pongratz, Skalicky and Schmelz43
IV. CONCLUSIONS
CuO, with or without a BBO modifier, offers the ability to encourage significant grain growth and densification in BaTiO3 films with restricted thermal budgets on a variety of substrates. Larger grain size and improved density enable large improvements in the dielectric properties and tuning. Films containing CuO (but no B2O3) exhibit strong aging that can be recovered by thermal anneals or field cycling. {111} twins are apparent in all samples containing CuO and/or BBO. On sapphire, BBO-modified films exhibited exaggerated grains that usually include a twin, however BBO-modified films with CuO show a more homogeneous grain size distribution. Microstructures on MgO exhibit universally smaller average grain size, likely due to the removal of Al2O3 from the system and the suppression of BaAl2O4 formation, but the addition of flux improves the density and leads to grain growth when compared to pure films.
ACKNOWLEDGMENTS
This material is based upon work supported by the NSF Center for Dielectrics and Piezoelectrics (NSF 1361503), the National Science Foundation Graduate Research Fellowship (NSF DGE-0946818), and the Army Research Office contract (W911NF1410285). Any opinion, findings, and conclusions or recommendations expressed in this material are those of the authors(s) and do not necessarily reflect the views of the National Science Foundation. The authors acknowledge the use of the Analytical Instrumentation Facility (AIF) at North Carolina State University, which is supported by the State of North Carolina and the National Science Foundation.