


Introduction
Tuberculosis (TB) remains a persistent public health concern in Canada, with over 2,000 people diagnosed with active disease annually, corresponding to an incidence of approximately 5 cases per 100,000 population. 1 Although Canada is classified as a low-incidence country, TB continues to impose a disproportionate burden among people born in high-incidence countries, Indigenous communities, and patients with immunocompromising conditions. 1
In hospital settings, patients admitted with suspected respiratory TB are placed under airborne precautions while diagnostic evaluation is underway (ie, patient placed in an airborne infection isolation room (AIIR), with all staff entering the room to wear a fit-tested N95 respirator). Reference Lewinsohn, Leonard and LoBue2 Microbiologic confirmation traditionally relies on serial sputum collection for acid-fast bacilli smear microscopy and mycobacterial culture. 3 Although smear microscopy may be reported within 24–48 hours after specimen receipt at reference laboratories, the need for multiple sputum specimens, specimen transport, batching, and centralized processing can prolong the interval from clinical suspicion to actionable microbiologic results. Current practice recommends collecting at least three sputum specimens to improve diagnostic sensitivity. 3 Culture remains the reference standard, but final confirmation often requires several weeks.
Institutional decisions about continuation of airborne isolation are often guided by smear microscopy results in conjunction with clinical and epidemiologic risk factors. 3 Although nucleic acid amplification tests are recommended as adjunctive diagnostic tools for TB, their integration into isolation or de-isolation algorithms is variable. Reference Pai and Schito4 Operational workflows that depend on sequential smear testing may contribute to prolonged isolation, increased resource utilization, and downstream effects on patient flow and bed availability. Reference Dorman, Schumacher and Alland5
Rapid molecular assays such as Xpert MTB/RIF Ultra provide sensitive detection of Mycobacterium tuberculosis complex with results available within hours and are part of a class of automated nucleic acid amplification tests that have been recommended to improve timeliness of diagnosis. Reference Chakravorty, Simmons and Rowneki6 While the diagnostic performance of Ultra has been described in diverse populations, less is known about its operational impact when implemented in-house within low-incidence, high-resource hospital settings. Reference Chakravorty, Simmons and Rowneki6,Reference Forbes, Hall and Miller7
We therefore conducted a prospective evaluation of in-house Ultra testing within a large urban hospital network, focusing on diagnostic turnaround time compared with conventional smear-based workflows. In addition, we explored potential operational implications of earlier result availability using a modeled isolation-cost framework.
Methods
Study design and setting
We conducted a prospective implementation study evaluating in-house Xpert MTB/RIF Ultra testing across Unity Health Toronto, a Toronto hospital network comprising two affiliated acute care hospitals, including one with a dedicated outpatient TB clinic, between April and December 2024. The study included adult inpatients and outpatients undergoing evaluation for suspected pulmonary TB. Testing was performed as part of routine clinical care during the study period. This study was reviewed by the Unity Health Toronto Research Ethics Board.
Specimen collection and testing
Sequential expectorated or induced sputum specimens were collected at least one hour apart in accordance with guidelines and institutional practice. Patients could contribute one or more sputum specimens, depending on clinical indication and specimen availability. In this cohort, 164 sputum specimens were obtained from 108 patients. Each included sputum specimen underwent in-house Xpert MTB/RIF Ultra testing and was also submitted for acid-fast bacilli (AFB) smear microscopy and mycobacterial culture. Ultra testing was performed on unprocessed sputum according to the manufacturer’s instructions during daytime laboratory operational hours, with results available approximately 90 minutes after assay initiation.
Reference testing
Acid-fast bacilli smear microscopy and mycobacterial culture were performed at a centralized reference laboratory using standard concentration, staining, and culture techniques consistent with routine laboratory practice. Reference Forbes, Hall and Miller7
Outcomes
The primary outcome was diagnostic turnaround time, defined as the interval from specimen receipt in the laboratory to result reporting. Secondary outcomes included paired Ultra versus smear turnaround-time differences and a modeled per-patient isolation-related cost difference based on observed turnaround time differences. Diagnostic performance was assessed by comparing Ultra and AFB smear microscopy against mycobacterial culture as the reference standard. Diagnostic performance was assessed using both single-sputum and two-sputum testing strategies. The single-sputum strategy was defined using the first available sputum specimen from each patient. The two-sputum strategy was restricted to patients with at least two submitted sputum specimens and used the combined results from the first two specimens; a positive result on either specimen was considered positive for that strategy.
Costs and cost modeling
A per-patient cost difference was estimated using the observed paired turnaround time difference between the Ultra and AFB smear workflows. The model was constructed from an institutional perspective and included isolation-related costs together with pathway-specific diagnostic costs. Isolation-related costs comprised the AIIR room cost, N95 respirator use associated with healthcare worker room entry, and healthcare worker contact time associated with isolation. The base-case AIIR room cost was set at CAD $395 per day, based on an institutional estimate derived from private-room costing data used for local planning; this value reflected room-related costs only and did not include contact-related isolation costs. Because this estimate may not reflect current room costs, it was varied in sensitivity analyses and should be interpreted as an institutional planning parameter rather than a comprehensive hospitalization cost. Additional isolation-associated costs, including healthcare worker room-entry frequency, N95 use per entry, and staff time, were modeled separately as time-dependent parameters. Diagnostic costs reflected the testing pathways under comparison, including Ultra and conventional smear-based microbiologic testing. The analysis did not incorporate capital equipment, assay validation, maintenance, implementation staffing, or broader laboratory start-up costs, and was not intended to represent a full budget-impact analysis or provincewide cost structure.
Probabilistic sensitivity analysis
To account for uncertainty in model inputs, probabilistic sensitivity analysis was performed using Monte Carlo simulation. Reference Briggs, Claxton and Sculpher8 Key model parameters were assigned probability distributions reflecting plausible ranges of uncertainty, including diagnostic test cost, estimated labor time, personal protective equipment utilization, number of healthcare worker room entries per day, and isolation duration. N95 respirator use was modeled as one respirator per healthcare worker room entry. Parameters were sampled simultaneously across 10,000 iterations, and the model was recalculated for each iteration to generate a distribution of incremental cost differences between diagnostic pathways.
Economic model
Modeled per-patient cost savings associated with Ultra were calculated as:
 ${\rm Cost \; savings} = \Delta \rm T \times (C_{AIIR} + C_{contact}) + (C_{smear} - C_{Ultra})$
where ΔT is the paired turnaround time difference in days, calculated as AFB smear turnaround time minus Ultra turnaround time; C_AIIR is the daily AIIR room cost; C_contact is the daily isolation-associated contact cost, including N95 respirator use, healthcare worker time, and environmental services; C_smear is the diagnostic cost of the smear-based pathway; and C_Ultra is the diagnostic cost of the Ultra pathway. Because both AIIR room costs and contact-related isolation costs accrue over time, they were combined as total daily isolation cost in the model but retained as separate input components for transparency and sensitivity analysis.
Statistical and economic analysis
Diagnostic turnaround time was defined as the interval from specimen receipt in the laboratory to result reporting. Turnaround time comparisons were performed at the specimen level. Each paired observation represented a single sputum specimen for which both Xpert MTB/RIF Ultra and AFB smear microscopy results were available. Because some patients contributed more than one sputum specimen, the number of paired observations exceeded the number of patients.
Because turnaround time data were not normally distributed, comparisons were performed using a nonparametric paired test (Wilcoxon matched-pairs signed-rank test). Statistical analyses were conducted using GraphPad Prism version 10 (GraphPad Software, San Diego, CA). Results are presented as mean paired differences with standard deviation. Airborne isolation duration and hospital length of stay among inpatients were collected descriptively only and were not analyzed as comparative outcomes because de-isolation decisions during the study period continued to follow smear-based protocols rather than Ultra results.
For each patient-level sputum testing strategy, sensitivity, specificity, positive predictive value (PPV), and negative predictive value (NPV) were calculated using mycobacterial culture as the reference standard. Two-sided 95% confidence intervals (CIs) were calculated using the Clopper–Pearson exact binomial method, including for estimates of 100.0. Diagnostic performance estimates and their 95% CIs are reported in Table 1, together with the underlying TP, FP, FN, and TN counts. Each patient contributed no more than one observation per test within each strategy. Additional confidence-interval calculations were performed in Python using SciPy version 1.17.0.
Diagnostic performance of AFB smear microscopy and Xpert MTB/RIF Ultra by sputum testing strategy

Table 1. Long description
The table compares the diagnostic performance of AFB smear microscopy and Xpert MTB/RIF Ultra by sputum testing strategy. It has 4 rows and 10 columns. The columns are labeled Strategy, Test, TP, FP, FN, TN, Sensitivity %, Specificity %, PPV %, NPV %, and N. The rows are labeled with different strategies: Single sputum specimen AFB smear, Two sputum specimens AFB smear, Single sputum specimen Ultra, and Two sputum specimens Ultra. Each row provides values for TP, FP, FN, TN, Sensitivity %, Specificity %, PPV %, NPV %, and N. For example, the first row shows values for Single sputum specimen AFB smear: TP 5, FP 8, FN 3, TN 92, Sensitivity 62.5 percent, Specificity 92.0 percent, PPV 38.5 percent, NPV 96.8 percent, and N 108.
AFB, acid-fast bacilli smear microscopy; Ultra, Xpert MTB/RIF Ultra; TP, true positive; FP, false positive; FN, false negative; TN, true negative; PPV, positive predictive value; NPV, negative predictive value; CI, confidence interval.
Each performance cell reports the percentage and two-sided 95% Clopper–Pearson exact binomial CI.
Percentages and CI limits are rounded to one decimal place. For the two-sputum strategy, performance was calculated among the 33 patients with at least two submitted sputum specimens; a positive result on either of the first two specimens was considered positive.
N denotes the number of patients in each row.
Results
Study population
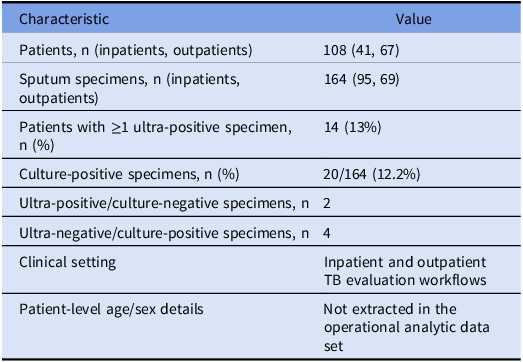
Between April and December 2024, a total of 164 sputum specimens from 108 adult patients undergoing evaluation for suspected pulmonary tuberculosis were included in the analysis (Table 2). Seventy-five patients contributed one sputum specimen, 13 contributed exactly two specimens, and 20 contributed more than two specimens. Accordingly, 33 patients contributed at least two specimens and were included in the two-sputum diagnostic performance analysis (Table 1). Because turnaround time comparisons were performed at the specimen level, each specimen contributed one paired Ultra-AFB smear observation. Fourteen patients (13%) had at least one specimen that tested positive by Xpert MTB/RIF Ultra. The cohort included both inpatients and outpatients, reflecting clinical implementation across hospital-based and outpatient TB evaluation workflows. Detailed patient-level demographic variables were not extracted for this operational analysis.
Study cohort and diagnostic-result summary

Table 2. Long description
The table has two columns: Characteristic and Value. It presents data on patients and sputum specimens, including inpatients and outpatients. Row 1: Patients, n (inpatients, outpatients), 108 (41, 67). Row 2: Sputum specimens, n (inpatients, outpatients), 164 (95, 69). Row 3: Patients with 1 ultra-positive specimen, n (%), 14 (13 percent). Row 4: Culture-positive specimens, n (%), 20/164 (12.2 percent). Row 5: Ultra-positive/culture-negative specimens, n, 2. Row 6: Ultra-negative/culture-positive specimens, n, 4. Row 7: Clinical setting, Inpatient and outpatient TB evaluation workflows. Row 8: Patient-level age/sex details, Not extracted in the operational analytic data set.
Diagnostic performance
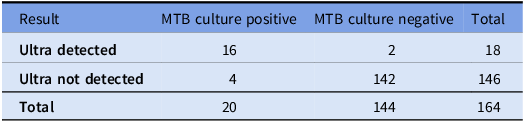
Using mycobacterial culture as the reference standard, 2 Ultra-positive/culture-negative and 4 Ultra-negative/culture-positive discordant specimens were identified in the overall specimen-level analysis (Table 3). Among all 164 analyzed specimens, Ultra detected M. tuberculosis complex in 16 culture-positive specimens and 2 culture-negative specimens, while 4 culture-positive specimens were not detected by Ultra. This overall specimen-level summary differs from the single-sputum and two-sputum diagnostic performance analyses, which were calculated using predefined patient-level testing strategies based on the first sputum specimen or the first two sputum specimens when available. Diagnostic performance estimates and their 95% CIs for AFB smear microscopy and Ultra using these strategies are presented in Table 1. Under the single-sputum strategy, sensitivity was 73.3% (11/15; 95% CI, 44.9%–92.2%) for Ultra and 62.5% (5/8; 95% CI, 24.5%–91.5%) for AFB smear microscopy; specificity was 97.8% (91/93; 95% CI, 92.4%–99.7%) and 92.0% (92/100; 95% CI, 84.8%–96.5%), respectively. Under the two-sputum strategy, sensitivity was 100.0% for both Ultra (3/3; 95% CI, 29.2%–100.0%) and AFB smear microscopy (2/2; 95% CI, 15.8%–100.0%). Specificity was 100.0% (30/30; 95% CI, 88.4%–100.0%) for Ultra and 96.8% (30/31; 95% CI, 83.3%–99.9%) for smear microscopy. PPV was 100.0% (3/3; 95% CI, 29.2%–100.0%) and 66.7% (2/3; 95% CI, 9.4%–99.2%), respectively. The wide two-sputum sensitivity CIs reflect the small number of culture-positive patients.
Summary of Xpert MTB/RIF Ultra and mycobacterial culture results

Table 3. Long description
A table comparing Xpert MTB/RIF Ultra and mycobacterial culture results. The table has four rows and four columns. Column headers are Result, MTB culture positive, MTB culture negative, and Total. Row labels are Ultra detected and Ultra not detected. Row 1: Ultra detected, MTB culture positive 16, MTB culture negative 2, Total 18. Row 2: Ultra not detected, MTB culture positive 4, MTB culture negative 142, Total 146. Row 3: Total, MTB culture positive 20, MTB culture negative 144, Total 164.
Note. Results are presented descriptively at the specimen level for 164 sputum specimens from 108 patients; some patients contributed more than one specimen.
Two specimens were Ultra-positive/culture-negative and 4 specimens were Ultra-negative/culture-positive.
Patient-level diagnostic performance estimates and their 95% confidence intervals for the predefined single-sputum and two-sputum strategies are reported in Table 1.
Diagnostic turnaround time
Median turnaround time from laboratory receipt to result reporting was 81 hours for the conventional acid-fast bacilli smear workflow compared with 7 hours for in-house Xpert MTB/RIF Ultra testing (P < .0001). The distributions of turnaround times for both diagnostic pathways are shown in Figure 1A. Ultra results were reported within 24 hours for the majority of specimens, whereas smear microscopy results demonstrated a broader distribution with a pronounced right tail, reflecting delays associated with centralized laboratory processing and microscopy reporting.
Comparison of diagnostic turnaround times between Xpert MTB/RIF Ultra and AFB smear microscopy. A Distribution of turnaround times from specimen receipt to result reporting for Xpert MTB/RIF Ultra and AFB smear microscopy. Violin plots illustrate the distribution of observed turnaround times, with significantly shorter reporting times observed for Ultra (p < 0.0001). B Distribution of paired turnaround time differences (ΔT = AFB - Ultra). Positive values represent time saved using the Ultra diagnostic pathway. Dashed lines represent mean and median values. C Cumulative proportion of reported results over time for each diagnostic workflow. The x-axis is shown in 24-hour intervals, with each interval corresponding to one day. Ultra results accumulate rapidly within the first operational day, whereas smear microscopy reporting occurs more gradually over several days.

Paired turnaround time analysis
A total of 164 paired observations were included in the final analysis. Mean time to result was 15.8 hours for Ultra compared with 74.2 hours for smear microscopy. The mean paired difference (ΔT = AFB - Ultra) was 58.3 hours (SD, 32.2), equivalent to 2.43 days for the economic model. The distribution of paired turnaround time differences is shown in Figure 1B. Positive ΔT values indicate that AFB smear results were reported later than the corresponding Ultra results, such that larger positive values reflect greater time saved with the Ultra pathway. The predominance of observations above zero indicates that most paired specimens favored earlier result availability with Ultra testing. Cumulative reporting curves further illustrate the operational difference between workflows (Figure 1C), with most Ultra results reported within the first operational day, whereas smear microscopy results accumulated more gradually over several days.
Modeled isolation-related cost impact
Using the observed mean paired turnaround difference of 2.43 days and the base-case isolation room cost of CAD $395 per day, the modeled mean per-patient room-related cost difference was approximately CAD $960. When additional isolation-associated contact costs were incorporated, modeled cost differences increased proportionally with total daily isolation-associated cost. Across plausible parameter values, the modeled cost difference consistently favored the Ultra diagnostic pathway, assuming that earlier result availability would translate into a reduction in airborne isolation duration. The relationship between daily isolation cost and modeled per-patient cost difference is shown in Figure 2A.
Modeled economic impact of reduced diagnostic turnaround time with in-house Ultra testing. A Modeled per-patient cost difference as a function of daily airborne isolation cost. The central line represents the mean modeled cost difference, while the shaded region represents uncertainty across simulated turnaround time estimates. B Distribution of simulated incremental per-patient cost differences generated through Monte Carlo simulation. The dashed vertical line indicates the threshold between cost increase and cost savings. The mean modeled benefit was CAD $1,277 per patient, with 98.7% of simulations demonstrating a net cost advantage associated with the Ultra diagnostic pathway. The left-sided tail in panel B reflects simulations in which smaller turnaround-time differences and/or higher Ultra pathway costs reduced the magnitude of savings.

Figure 2. Long description
Panel A: A line graph shows the modeled per-patient cost difference in Canadian dollars (CAD) against the daily isolation cost in CAD per day. The x-axis represents the daily isolation cost ranging from 0 to 1000 CAD, and the y-axis represents the modeled per-patient cost difference ranging from 0 to 3500 CAD. The line graph indicates a positive correlation between daily isolation cost and modeled per-patient cost difference, with a shaded area representing the confidence interval. Panel B: A histogram displays the Monte Carlo simulation of incremental cost difference in CAD. The x-axis represents the simulated incremental cost difference ranging from 0 to 4000 CAD, and the y-axis represents the frequency. The histogram shows a distribution of incremental cost differences with a mean value of 1277 CAD, indicated by a vertical line. A dashed vertical line represents the break-even point.
Probabilistic sensitivity analysis
Several operational and isolation-related cost components, including healthcare worker room-entry frequency, staff time, and isolation-associated contact costs, are not consistently reported in the peer-reviewed literature and are not publicly available as standardized provincial estimates. N95 respirator use was modeled as one respirator per healthcare worker room entry. We attempted to obtain unit-level isolation operational costs from publicly accessible sources; however, detailed estimates were not available for use in this analysis. Accordingly, plausible parameter ranges were defined based on available literature and local operational assumptions and incorporated into the model using probabilistic sensitivity analysis.
PSA was performed using Monte Carlo simulation, in which key parameters were sampled simultaneously from prespecified probability distributions and the model was re-evaluated over 10,000 iterations to generate a distribution of incremental cost differences (Ultra-based strategy vs AFB-smear workflow). This approach quantifies the probability that the Ultra-based strategy remains cost-saving under joint parameter uncertainty. Results are presented as the simulated distribution of incremental cost differences (Figure 2B) and the proportion of simulations in which the Ultra-based strategy yielded net cost savings. Across the 10,000 simulations, mean modeled savings were CAD $1,277 per patient, and 98.7% of simulations favored Ultra.
Discussion
In this prospective implementation study, in-house Xpert MTB/RIF Ultra testing significantly reduced diagnostic turnaround time compared with conventional smear-based workflows. The observed mean paired reduction of 58.3 hours highlights the operational differences between centralized smear testing and on-site molecular diagnostics.
Ultra had higher sensitivity and specificity point estimates than smear microscopy under the single-sputum strategy. Although both tests had observed sensitivity of 100.0% in the two-sputum subset, these estimates were based on very few culture-positive patients and had wide 95% CIs. They should not be interpreted as evidence of perfect or equivalent sensitivity. Interpretation of discordant Ultra and culture results requires caution because mycobacterial culture, although the reference standard, is not a perfect gold standard. In this cohort, the 2 Ultra-positive/culture-negative specimens were considered clinically plausible and may have reflected paucibacillary disease or detection of non-viable bacillary DNA in the setting of prior treatment. Conversely, the 4 Ultra-negative/culture-positive specimens may reflect low organism burden, sampling variability, or bacillary load near the assay limit of detection. These findings highlight the importance of interpreting Ultra results alongside culture, clinical context, and epidemiologic risk.
Earlier availability of molecular results has potential implications for airborne isolation practices. Although de-isolation decisions during the study period continued to follow smear-based protocols, modeled analyses suggest that earlier diagnostic information could translate into reduced isolation duration in settings where molecular testing is incorporated into institutional workflows. In high-resource, low-incidence hospital environments, even modest reductions in isolation time may have meaningful effects on bed utilization and patient throughput. These findings are broadly consistent with prior hospital-based studies from low-burden settings that evaluated Xpert-based isolation strategies. In those studies, Xpert-based approaches reduced airborne isolation duration compared with smear-based pathways and, in a separate cost-effectiveness analysis, were shown to be comparably sensitive, more specific, and more cost-effective than smear microscopy. Reference Lippincott, Miller and Popowitch10,Reference Cowan, Chandler and Kracen12
Cost modeling based on observed turnaround time differences yielded mean per-patient isolation-related savings of CAD $1,277 with the Ultra pathway, with net savings in 98.7% of simulations. The model incorporated joint uncertainty in operational parameters, including test cost, labor inputs, personal protective equipment use, and healthcare worker room entry frequency. However, this analysis should be interpreted as an institutional isolation-impact model rather than a full implementation or budget-impact analysis. Although pathway-specific diagnostic costs were included, the model did not comprehensively capture capital equipment, assay validation, maintenance contracts, training, staffing, or laboratory workflow integration costs. Published costing studies indicate that the instrument platform, cartridges, maintenance, and staff time are major contributors to Xpert program cost and should be incorporated into future implementation-focused analyses. Reference Nadjib, Dewi and Setiawan9
Beyond modeled inpatient cost considerations, earlier result availability may also have downstream implications in the outpatient setting. Current Canadian guidance notes that, when medically appropriate, ambulatory treatment and home isolation are preferred over prolonged hospital isolation. Earlier confirmation or exclusion of pulmonary TB could therefore have a positive impact by reducing time spent in home isolation, time away from work, caregiver burden, productivity loss, and other societal costs that were not captured in the present analysis. These outcomes were not directly measured in this study and warrant prospective evaluation in future implementation studies.
Current Canadian standards still emphasize smear-based criteria and institution-level policies for discontinuing airborne precautions in hospitalized patients being evaluated for respiratory TB. 11 In contrast, guidance and institutional algorithms in some low-incidence settings have incorporated molecular testing into airborne-isolation decision-making for patients with suspected pulmonary TB. Reference Lippincott, Miller and Popowitch10,Reference Cowan, Chandler and Kracen12 Development of locally adapted Canadian protocols, supported by additional implementation studies, may help define how rapid molecular diagnostics can be integrated into infection prevention workflows without prompting premature discontinuation of precautions or compromising patient or staff safety. As more hospital-based studies are published, this evidence base may also help inform future institutional guidance and broader IPAC approaches for TB. Reference Cowan, Chandler and Kracen12
In this prospective implementation study within a low-incidence hospital network, in-house Xpert MTB/RIF Ultra substantially shortened time to diagnostic result compared with centralized smear-based workflows and was associated with modeled per-patient isolation-related cost savings. Ultra also showed favorable diagnostic point estimates against culture, although the two-sputum estimates were imprecise. Although downstream isolation effects were modeled rather than directly observed, these findings support the use of rapid in-house molecular testing to improve hospital TB diagnostic workflows and justify further evaluation of molecular-result-informed airborne isolation protocols.
Limitations
This study has several limitations. First, it was conducted within a single hospital network in a low-incidence TB setting, which may limit generalizability to other healthcare systems or higher-burden regions. The number of culture-confirmed tuberculosis cases was relatively small, reflecting the epidemiology of TB in this setting and potentially limiting the precision of diagnostic performance estimates. This imprecision was particularly pronounced in the two-sputum subset, in which observed sensitivity of 100.0% was based on only two or three culture-positive patients. The corresponding wide 95% CIs preclude firm conclusions about perfect or equivalent sensitivity. Sequential sputum sampling was limited, and only sputum specimens were included in the analysis. This limitation partly reflects the inclusion of both inpatients and outpatients, because outpatient or single-visit evaluations did not always allow sequential sputum collection. Some patients contributed multiple specimens, introducing potential within patient correlation in specimen-level turnaround-time analyses. In addition, the economic model reflects an institutional perspective and does not capture all potential downstream healthcare system effects or broader system-level costs. Finally, de-isolation decisions during the study period continued to follow smear-based protocols and were not driven by Ultra results; therefore, potential reductions in airborne isolation duration were modeled rather than directly observed.
Supplementary material
The supplementary material for this article can be found at https://doi.org/10.1017/ash.2026.10922.
Acknowledgments
The authors gratefully acknowledge the contributions of the study team members who supported specimen processing, laboratory workflow implementation, data collection, and operational coordination: Christina Akbar, Amen Awan, Diego Brunetto, Thomas Dashwood, Sydney Dyck, Amiel Dale Fuertes, Anjum Khan, Saman Khan, Kerim Dimitri Kits, Mariel Mardoquio, Asma Moin, Andrew Mendlowitz, Sara S. Pathan, Natasha Sabur, Julie Seemangal, and Stephanie Vicencio.
Financial support
This study was funded by the AFP Innovation Research Fund.
Competing interests
The authors declare no competing interests related to this work, except that L.M.M. previously served on Cepheid’s speaker’s bureau.



 Open access

