Introduction
Branching is ubiquitous in nature (Fleury et al., Reference Fleury, Gouyet and Léonetti2001), especially in the biosphere (Sánchez et al., Reference Sánchez, Lasker, Nepomuceno, Sánchez and Woldenberg2004). Scalable self-similar branching patterns (i.e., fractals) commonly occur in colonial organisms. Compared to solitary organisms, colonial organisms contain an additional hierarchical level of characters (i.e., at the colony level) that are useful in taxonomy, systematics, and ecology (Harper et al., Reference Harper, Rosen and White1986). This applies to bryozoans, but in fossils, colony-level characters such as branching pattern are difficult to infer due to postmortem fragmentation (McKinney and Jackson, Reference McKinney and Jackson1991). Working on relatively complete fossil colonies allows exploitation of not just zooecial-level characters but also colony-level characters (Hageman et al., Reference Hageman, Wyse Jackson, Abernethy and Steinthorsdottir2011). These colonies are unique in their completeness. This study uses reassembled fossil bryozoan colonies to quantify colony-level characters that are impossible to acquire from colony fragments.
Reassembling bryozoan colonies has a variety of scientific applications. Reassembled bryozoan colonies permit analysis of the spatial distribution of epibionts and endoskeletozoans across colonies (unpublished data, Wyse Jackson and Key). They allow the study of colony–environment interaction that is not entirely possible with fragments (Waugh and Erickson, Reference Waugh and Erickson2002). Many organisms exhibit intraspecific ecophenotypic plasticity. For example, stromatolite morphology changes in response to depth and current velocity (Andres and Reid, Reference Andres and Reid2006; Jahnert and Collins, Reference Jahnert and Collins2012). Coral morphology varies with nutrients and current velocity (Filatov et al., Reference Filatov, Kaandorp, Postma, van Liere, Kruszyński, Vermeij, Streekstra and Bak2010; Chindapol et al., Reference Chindapol, Kaandorp, Cronemberger, Mass and Genin2013). Tree morphology varies with light and wind speed (Mitton, Reference Mitton1985; Niklas, Reference Niklas1986), including branching pattern (Minoletti O. et al., Reference Minoletti O., Boerner and Cochrane1995). In bryozoans, colony morphology varies with a variety of environmental parameters, including water depth (Stach, Reference Stach1935; Wyse Jackson et al., Reference Wyse Jackson, Bancroft and Somerville1991; Hageman et al., Reference Hageman, Bone, McGowran and James1997; Reid, Reference Reid2010). This has been documented specifically in Cincinnatian bryozoans (Ross, Reference Ross1984; Waugh et al., Reference Waugh, Erickson and Crawford2005) as well as in other groups. In the trilobite Flexicalymene, a shift in the position of eyes is partially interpreted as a response to water depth (Webber and Hunda, Reference Webber and Hunda2007). In the bivalve Ambonychia, shell size decreased in lower-energy, deeper environments (Daley, Reference Daley2004).
Since the taxonomic pioneers in the late nineteenth and early twentieth centuries (Cuffey et al., Reference Cuffey, Davis and Utgaard2002), the type-Cincinnatian bryozoans have received extensive work on their biostratigraphy (Utgaard and Perry, Reference Utgaard and Perry1964; Boardman and Utgaard, Reference Boardman and Utgaard1966; Anstey and Perry, Reference Anstey and Perry1973; Singh, Reference Singh1979; Brown and Daly, Reference Brown and Daly1985; Anstey and Rabbio, Reference Anstey and Rabbio1989; Pachut and Fisherkeller, Reference Pachut and Fisherkeller2002), their paleoecology (Key et al., Reference Key, Schumacher, Babcock, Frey, Heimbrock, Felton, Cooper, Gibson, Scheid and Schumacher2010; Wyse Jackson et al., Reference Wyse Jackson, Key and Coakley2014), and their use as paleoenvironmental indicators (Pachut and Anstey, Reference Pachut and Anstey1979; Anstey et al., Reference Anstey, Rabbio and Tuckey1987; Key, Reference Key1987; Ross and Ross, Reference Ross and Ross2002) and for constraining paleobiogeographic hypotheses (Anstey, Reference Anstey1986; Tuckey, Reference Tuckey1990; Anstey et al., Reference Anstey, Pachut and Tuckey2003). Data regarding colony form were not gathered, but in many cases crude information about branch size and cross-sectional shape was provided in taxonomic accounts or tabulated as in at least one study (Karklins, Reference Karklins1984, table 8). Despite this considerable volume of research, largely due to colony fragmentation and postmortem transport, we still have a poor understanding of the type-Cincinnatian bryozoan colony-level morphology (Waugh et al., Reference Waugh, Erickson and Crawford2005).
Although some colony-level information can be gleaned from fragmentary material (e.g., Cheetham et al., Reference Cheetham, Hayek and Thomsen1981; Cuffey and Cheetham, Reference Cuffey and Cheetham1982), reassembled colonies are the best, and often only, way to quantify intracolony variation of colony-level characters such as colony size, branch diameter, internode distance, and branching angle. The need to quantify intra- and intercolony variation before defining valid species has long been known (Cumings, Reference Cumings1904; Stach, Reference Stach1935). Boardman (Reference Boardman1960) and Cheetham et al. (Reference Cheetham, Hayek and Thomsen1980) showed that some colony-level characters are species specific in some clades and thus useful for taxonomy and systematics.
There are a few drawbacks of using reassembled bryozoan colonies. First, it is a time-consuming and sometimes frustrating process to reassemble the fragments. Second, due to the labor involved in the reassembly, the owner or repository of a specimen generally does not permit thin sectioning for proper species identification. Since the work of Ulrich (Reference Ulrich1882), thin sections have been routinely used for the identification of Cincinnatian trepostome faunas (Utgaard and Perry, Reference Utgaard and Perry1964; Karklins, Reference Karklins1984; Brown and Daly, Reference Brown and Daly1985). Third, due to the rarity of proper preservational conditions and the labor involved in reassembly, studies involving reassembled colonies are always based on few specimens. Ulrich (Reference Ulrich1883, pl. 14, fig. 4) illustrated a reassembled portion of a Constellaria florida Ulrich, Reference Ulrich1882 var. plana colony that had been in three parts, but no discussion on the colony form of this taxon was provided. There has been one published attempt at quantifying colony morphology from fossil ramose bryozoan colonies by Boardman (Reference Boardman1960), who reassembled colonies of three Devonian trepostome Leptotrypella species. Conversely, there have been more studies and reports involving the more robust, and thus less fragmented, frondose colonies of the Ordovician trepostomes Peronopora (Hickey, Reference Hickey1988), Heterotrypa patera Coryell, Reference Coryell1921 (McKinney, Reference McKinney1971), and H. frondosa (d’Orbigny, Reference d’Orbigny1850) (Erickson and Waugh, Reference Erickson and Waugh2002; Waugh and Erickson, Reference Waugh and Erickson2002; Waugh et al. Reference Waugh, Erickson and Crawford2005; Cuffey and Fine, Reference Cuffey and Fine2005, Reference Cuffey and Fine2006).
This study focuses on reassembled ramose fossil bryozoan colonies. By ramose, we mean rigid, unjointed, erect, branching arborescent colonies sensu Stach’s (Reference Stach1936) and Schopf’s (Reference Schopf1969) vinculariform as well as Smith’s (Reference Smith1995) erect, rigid, robust branching habit. The ramose colony growth habit in bryozoans is selectively advantageous for exponentially increasing surface feeding area higher in the water column (Cheetham and Hayek, Reference Cheetham and Hayek1983; Cheetham, Reference Cheetham1986).
Ramose colonies are more challenging to reassemble due to their relative ease of breakage and rare anastomosing branches compared to more robust frondose colonies. The one previous study that did use reassembled ramose colonies (Boardman, Reference Boardman1960) used a combination of reassembled colonies and clusters of associated fragments assumed to be from the same colony. This current study is based only on reassembled colonies. We use the terminology of Waugh and Erickson (Reference Waugh and Erickson2002) to distinguish between reassembled and reconstructed colonies. This study involves reassembled colonies, which encompasses gluing together broken fragments. This is in contrast to reconstructed colonies, which includes the additional step of adding inferred missing fragments using some filler compound.
One question that has challenged trepostome paleobryozoologists is how much of a ramose colony was alive at any one time. Are only the branch tips growing and the rest of the colony dead due to burial in sediment or zooid senescence? Boardman (Reference Boardman1960) was the first to attempt to constrain this by measuring the ratio of endozone diameter to branch width (i.e., the axial ratio). He showed that axial ratio decreases away from the growing tip. Knowing the relative frequency of growing branch tips versus dead branches can help answer this question. Reassembled colonies can provide data on these relative frequencies, but the situation is complicated by branches whose endozones have been mined out by endoskeletozoans (Erickson and Bouchard, Reference Erickson and Bouchard2003; Wyse Jackson and Key, Reference Wyse Jackson and Key2007).
Materials and methods
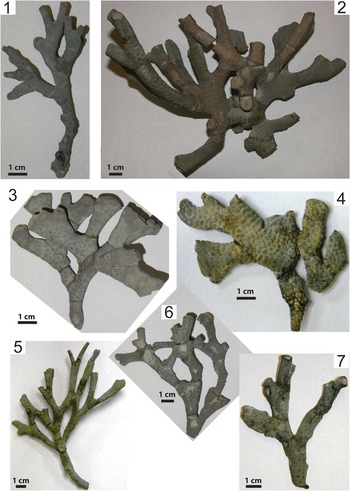
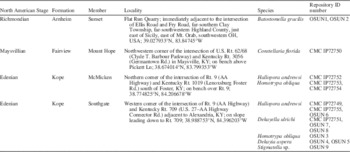
This study was based on 16 colonies, which constitute the world’s largest single collection of reassembled fossil ramose stenolaemate bryozoan colonies examined in a scientific study. The 16 colonies included one cystoporate and six trepostome genera (Table 1, Fig. 1). Colonies embedded in friable calcareous shale were good candidates for reassembly because at some locations the fragments were not widely distributed and were easily removed from the surrounding matrix. Relatively undisturbed colony fragments made this possible; it would have been impossible if the fragments had been transported and mixed with multiple colonies. The proximity of the delicate branch fragments to their original position indicates minimal transport due to displacement from burial and compaction. The colonies must have been deposited in quiet water and/or rapidly buried so there was no opportunity for the branch fragments to scatter. Horizons with almost perfectly intact fossils due to very rapid burial are called obrution beds (Seilacher et al., Reference Seilacher, Reif and Westphal1985; Brett and Seilacher, Reference Brett and Seilacher1991). In the Cincinnatian, they are attributed to rapid deposition of mud following storm events (Kohrs et al., Reference Kohrs, Brett and O’Brien2008).
Examples of reassembled colonies from the seven species used in this study. (1) Batostomella gracilis, OSUN 2. (2) Stigmatella sp., OSUN 9. (3) Dekayia aspera Milne-Edwards & Haime, Reference Milne-Edwards and Haime1851, OSUN 4. (4) Constellaria florida, CMC IP72750. (5) Hallopora andrewsi (Nicholson, Reference Nicholson1874), CMC IP72749. (6) Homotrypa oblique Ulrich, Reference Ulrich1882, OSUN 3. (7) Dekayella ulrichi (Nicholson, Reference Nicholson1881), CMC IP72751.

Stratigraphy, locality, and sample identification information for the Upper Ordovician (Cincinnatian) ramose stenolaemates bryozoan colonies in this study. CMC = Cincinnati Museum Center’s Museum of Natural History and Science’s Geier Collections and Research Center; OSUN = Ohio State University at Newark.

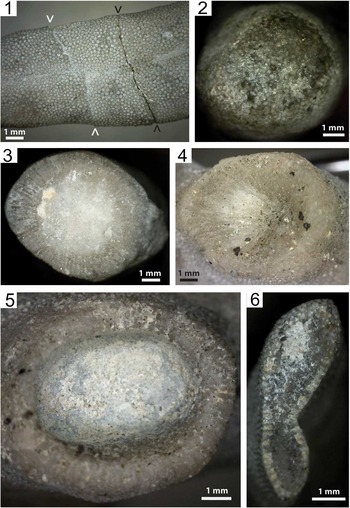
The preservation of these colonies was excellent, as evidenced by the lack of both recrystallization and infilling of internal zooecial cavities by sparry calcite cement. The dominant diagenetic process affecting these colonies was postdepositional compaction of the entombing shale by the lithostatic overburden pressure. This compaction led to brittle deformation of a few branches, and these stress relief breaks were later imperfectly cemented during diagenesis (Fig. 2.1). Due to the rarity and minimal displacement (≤1 mm) of the cemented branches, we did not attempt to break and reglue such breaks as done by Waugh et al. (Reference Waugh, Erickson and Crawford2005).
Details of reassembled colonies used in this study. (1) Compaction-induced stress relief break that was imperfectly cemented during diagenesis (white arrows) and a fresh break that was glued during reassembly (black arrows) in Hallopora andrewsi, CMC IP72749. (2) Pristine growing tip in Batostomella gracilis, OSUN 1. (3) Fresh break with more jagged edges in Homotrypa obliqua, CMC IP72753. (4) Old break with more abraded edges in Homotrypa obliqua, CMC IP72754. (5) Old break revealing mined out endozone filled with matrix in Hallopora andrewsi, CMC IP72752. (6) Collapsed branch whose endozone has been mined out in Hallopora andrewsi, CMC IP72749.

Reassembly
Colonies were reassembled from fragments using the following six-step process: (1) photography of in situ clusters of associated colony fragments discovered weathering out of their enclosing matrix on bedding planes; (2) recovery of the fragments in and around the cluster for removal; (3) cleaning of the fragments in an ultrasonic water bath to remove adhering residual sediment; (4) drying of the fragments; (5) fitting together of fragments based on the previously mentioned photographs and matching up fragments based on branch cross-sectional area, two- and three-dimensional branch cross-sectional shape, and finally any branch surface characteristics such as color and macular size, shape, and position (when there was any doubt with the match, it was left unglued); (6) gluing together matching fragments into their pre–surface exposure position (Fig. 2.1) with cyanoacrylate glue.
Branching numeric
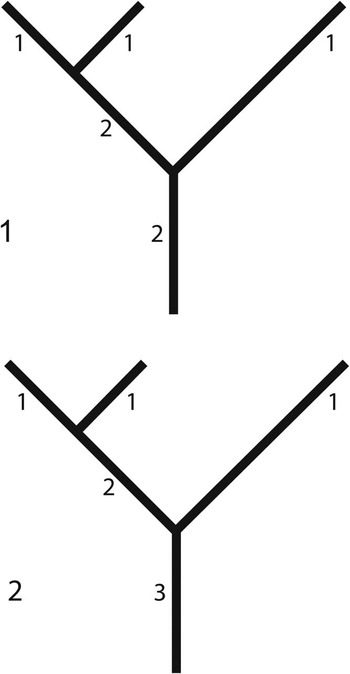
We use the bryozoan colony branching terminology of Cheetham et al. (Reference Cheetham, Hayek and Thomsen1980) with a link being the portion of a branch between successive bifurcations; a bifurcation is the division of one branch into two; distal is toward the growing tips and proximal toward the colony base; a growing tip is the distal extremity of a branch; the branching ratio is the number of first-order branches divided by the number of second-order branches. Cheetham et al. (Reference Cheetham, Hayek and Thomsen1980) used the Horton-Strahler branch-ordering method as originally proposed by Horton (Reference Horton1945) and modified by Strahler (Reference Strahler1957). This method assigns an order to each branch. A first-order branch is one that has no distal bifurcations. Terminal broken branches were assigned a first order. This should not skew the branching ratio results unless there is a systematic change in branching ratio toward the colony base. This has been documented in a few trees (Steingraeber and Waller, Reference Steingraeber and Waller1986) but not in bryozoans (Cheetham et al., Reference Cheetham, Hayek and Thomsen1980). Where two first-order branches converge, the result is a second-order branch. A third-order branch is the result of two second-order branches merging, and so on. We compare this Horton-Strahler branch-ordering method to the Shreve (Reference Shreve1967) magnitude method (Fig. 3). In this latter method each branch without a distal bifurcation is assigned a magnitude of one. When two branches meet, the resulting branch is given a magnitude of the sum of the two connecting branches (Fig. 3.2). In this method, a lower-order branch can combine with a higher-order branch; however, in the Horton-Strahler method, the order of the branch will not change unless it is of equal order (Fig. 3.1). The pros and cons of the various methods are reviewed by Key et al. (Reference Key, Wyse Jackson and Vitiello2011).
Comparison of (1) the Horton (Reference Horton1945) as modified by Strahler (Reference Strahler1957) branch-ordering method and (2) the Shreve (Reference Shreve1967) magnitude method.

Morphometrics
Colony height was measured as the linear distance from the base of the colony to the distal end of the longest branch. Colony width was measured as the maximum linear distance perpendicular to the basal link of the colony. Colony depth was measured as the thickness of the colony when lying on its side. Branch diameter was measured at the midpoint of each link as the mean of two mutually perpendicular diameters. On one link, it was not measured due to the presence of an epizoic encrusting bryozoan colony, which made the branch thicker. All characters were measured with a digital micrometer to the nearest 0.1 mm.
The branches were counted and classified as either unbroken or broken at their distal end. An unbroken branch should have a hemispherical pristine growing tip (Fig. 2.2), sensu Key (Reference Key1990, fig. 1). Broken branches were classified as either fresh or old. A fresh break had no perceptible surface weathering. They tended to have a flatter end, generally perpendicular to the growth axis of the branch, with more jagged edges (Fig. 2.3). These surfaces had a more yellow-gray color and were possibly attributed to collecting but more likely due to breakage from recent weathering out of the shale outcrop. Weathering of the shale matrix through hydration, expansion, and erosion of the outcrop broke the colonies into fragments. Rapid weathering of the type-Cincinnatian shales in road cuts (Ohio Department of Transportation, 2011) suggests fresh breaks are less than a few years old. Fresh breaks were those that allowed reassembly. By contrast, an old break had more rounded edges with a darker gray color (Fig. 2.4). An old break was attributed to breakage before or at the death of the colony. Old breaks lacked matching fragments for reassembly. Broken branches were additionally classified as either mined or unmined. The former is indicated by the bluish-gray matrix infilling of the endozonal domichnia of the endoskeletozoan that made the ichnofossil Sanctum laurentiensis (Erickson and Bouchard, Reference Erickson and Bouchard2003, fig. 2; Wyse Jackson and Key, Reference Wyse Jackson and Key2007, fig. 3). Mined out old breaks have a distinctive concave, indented, dimpled shape (Fig. 2.5) as illustrated in longitudinal cross section by Erickson and Bouchard (Reference Erickson and Bouchard2003, fig. 2.6, 2.15), which suggests healing and continued postbreakage growth of the branch.
Sources of error
There are four potential sources of error in the data when using reassembled colonies. The obvious one involves erroneously gluing together mismatched branch fragments. In this study, the methodology was designed to minimize this, but it is still possible. Second, anastomosing branches, if misinterpreted, can affect morphometric and branching order data. Of the 376 branch links analyzed in this study, 11 anastomization events were recorded for a frequency of <3%. Intracolony branch intersections are normally avoided by sessile modular organisms (Bell, Reference Bell1986), but when they do occur and branches fuse, it is an indication of physiological integration of the component modules (Franco, Reference Franco1986). In such cases, we arbitrarily but consistently attributed the larger diameter distal branch to the larger diameter proximal branch. In two colonies, branches touched but did not fuse. This may indicate an absence of interbranch fusion in those colonies or that the branches did not touch during life, only after diagenetic compaction.
Third, due to possible dispersal of some fragments at the outcrop, the colonies have an unknown number of first- and perhaps higher-order branches missing. This has the effect of skewing the terminal branches toward lower branching orders. For example, a broken branch could have been a first- or second-order branch, but based on the described methodology, it would be classified as a first-order branch. If it was a second-order branch or higher, it skewed our results toward lower branch orders. In the extreme case, what we reassembled as a smaller colony may simply have been a distal portion of a larger colony. This is not likely as the collections of reassembled colonies were widely distributed on the bedding planes and as discussed in the preceding, fragments were not likely transported postmortem. Whole colonies can only be identified if the holdfast and all terminal growing tips of distal branches are present. In one case (OSUN 9), a holdfast was present (Fig. 1.2), whereas in two other colonies (OSUN 1, OSUN 2), undamaged terminal growing tips were preserved (Fig. 1.1). Therefore, none of the colonies examined were 100% complete.
The final potential source of error when using reassembled colonies is the effects of colony distortion during the fossilization process following the toppling of the colony during burial. There are five independent pieces of evidence that the colonies have been diagenetically compacted. (1) All of the colonies exhibit a clearly flattened profile. Instead of being a perfect radially symmetrical colony, the mean ratio of the average of height and width divided by depth is 3.7 (range: 2.3–6.7, standard deviation: 1.2). (2) Some branches exhibit compaction-induced stress relief breaks that were cemented during diagenesis (Fig. 2.1). (3) Some branches have collapsed, become flattened, and been diagenetically cemented (Fig. 2.6). They are collapsed in the same direction as the colony flattening (i.e., perpendicular to bedding in response to compression from overburden pressure). This is typically due to structural weakening from their endozone being been mined out, as evidenced in trace fossil Sanctum. (4) Some branches touch but are not fused into an anastomosing pattern. Branch fusion is common in bryozoan colonies. If branches are preserved touching but not fused, it suggests they did not touch in life and the touching is a result of postmortem compaction. (5) There was undoubtedly also microscale flattening as our 376 paired mutually perpendicular branch diameter measurements were rarely identical, even in the taxa with circular branch cross-sectional shapes. As a result of all this diagenetic distortion, Cheetham and Hayek’s (Reference Cheetham and Hayek1983) bifurcation angle was not measured in this study. Alternatively, the flattened profile of the colonies may not be diagenetic and could have been original and simply an ecophenotypic response to dominant current flow as seen in many colonial organisms such as plants (Young and Perkocha, Reference Young and Perkocha1994; Tarara et al., Reference Tarara, Ferguson, Hoheisel and Perez Peña2005), sponges (Kaandorp, Reference Kaandorp1999), corals (Filatov et al., Reference Filatov, Kaandorp, Postma, van Liere, Kruszyński, Vermeij, Streekstra and Bak2010; Chindapol et al., Reference Chindapol, Kaandorp, Cronemberger, Mass and Genin2013), and bryozoans (Harmelin, Reference Harmelin1973; Berning, Reference Berning2007). We cannot rule out any of these causes of flattening.
Repositories and institutional abbreviations
The bryozoan colonies used in this study are housed at the Cincinnati Museum Center’s Museum of Natural History and Science’s Geier Collections and Research Center (CMC) or Ohio State University at Newark (OSUN). The CMC has several other reassembled colonies, but they are the more robust frondose forms not addressed in this study.
Geological setting
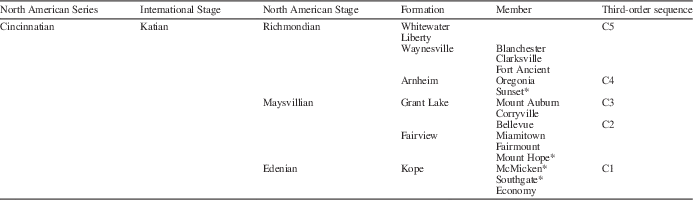
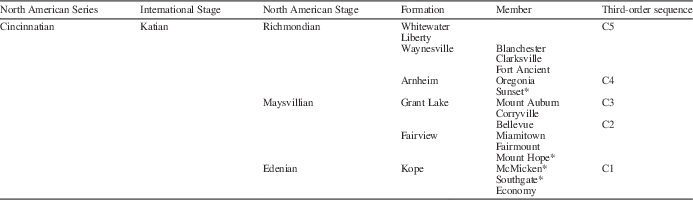
The colonies come from the Upper Ordovician Katian Stage in North America known as the Edenian to Richmondian Stages of the Cincinnatian Series (Table 2, Fig. 1). The colonies are from outcrops exposed in the Cincinnati Arch region of southern Ohio and northern Kentucky. They grew on a storm-dominated, gently northward-dipping, mixed carbonate-siliciclastic ramp bordering an intracratonic basin, the Sebree Trough in eastern Laurentia (McLaughlin et al., Reference McLaughlin, Brett, Holland and Storrs2008; Meyer et al., Reference Meyer, Davis and Holland2009).
Stratigraphic column showing sources of colonies in this study (*). Modified from Smrecak and Brett (Reference Smrecak and Brett2014, fig. 1).
Results
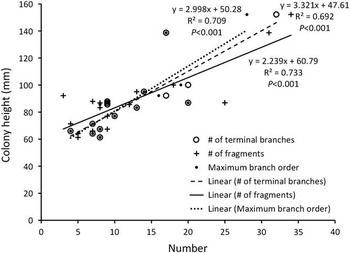
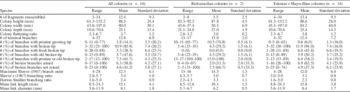
The data for each colony can be found in the Appendix. The summary statistics for the colony-level morphometric data on the colonies in this study can be found in Table 3. No pattern in directional collapse was noted among the colonies. All attempts to reassemble colonies were at least partially successful (Fig. 1). The reassembled colonies incorporated 3–34 fragments (mean: 12.4, standard deviation: 9.3). As expected, the larger colonies required assembling significantly more fragments (Fig. 4). None of the attempts to reassemble colonies were completely successful as indicated by the presence of some branches that ended with a freshly broken tip. Of the total 204 terminal branches in the 16 colonies, 38% were freshly broken (range: 0%–88%, standard deviation: 23%). After reassembly, remaining unmatched associated fragments were probably indicative of mixing of fragments from another colony. The reassembled colonies ranged in size from 61 to 152 mm tall (mean: 88.5 mm, standard deviation: 24.4 mm).
Plot of colony height versus the number of fragments in reassembly, number of first-order branches, and maximum Shreve (Reference Shreve1967) branch order for the 16 colonies in this study.

Summary statistics for the colony-level morphometric data.

Terminal branches
Of the 204 terminal branches examined in this study, 84 (38%) were freshly broken. Ninety-one (48%) had an old broken tip that had started to heal and regrow. Only 29 (14%) had a pristine growing tip preserved. Of the 175 broken branches that allowed examination of the endozone, the majority (59%) were mined out by the Sanctum laurentiensis tracemakers; the others were pristine.
Branching metrics
The maximum Shreve branch order in colonies ranged from 4 to 28 (mean: 12.3, standard deviation: 6.1). In their study of extant ramose cheilostome bryozoans, Cheetham et al. (Reference Cheetham, Hayek and Thomsen1980) defined the branching ratio as the number of first-order branches divided by the number of second-order branches. Our branching ratio using the Shreve method had a mean of 3.4 (range: 2.0–5.7, standard deviation: 1.0) compared to 2.4 (range: 1.6–5.0, standard deviation: 0.9) for the Horton-Strahler method.
Discussion
Most of our colonies are shorter than those from the only other published study on reassembled ramose trepostome colonies. Boardman (Reference Boardman1960) reassembled one colony each from three species of the Devonian genus Leptotrypella that ranged in height from 102 to 450 mm (mean: 218 mm, standard deviation: 164 mm). These differences may be due to interspecific variation and/or different environments. Larger ramose trepostome colonies have been reported in outcrop such as the Permian Stenopora from Australia, which reaches up to 200 mm (Reid, Reference Reid2003, Reference Reid2010), and the Permian Tabulipora from Greenland, which reaches up to 750 mm (Madsen, Reference Madsen1994; Madsen and Håkansson, Reference Madsen and Håkansson1989; Key et al., Reference Key, Wyse Jackson, Håkansson, Patterson and Moore2005). From the Cincinnatian of the Cincinnati Arch region, Erickson and Bouchard (Reference Erickson and Bouchard2003, fig. 2.10, 2.11) figured a 63 mm tall Parvohallopora sp. colony. Finally, Meyer et al. (Reference Meyer, Davis and Holland2009, fig. 7.4A, B) illustrated a 150 mm tall Parvohallopora ramosa (d’Orbigny, Reference d’Orbigny1850) colony and a larger, 240 tall mm, unidentified colony. Thus the colonies in this study are not unique in their size, only their completeness.
Terminal branches
The fact that 76% of the branches without fresh breaks were broken may reflect an architectural predisposition to breakage as a means for asexual colony replication (Håkansson and Thomsen, Reference Håkansson and Thomsen2001). This mode of colony replication is widespread among bryozoan clades (McKinney and Jackson, Reference McKinney and Jackson1991). Alternatively, our low frequency of pristine growing tips (24%) among branches without fresh breaks could partially be an artifact of the terminal branches having the smallest diameters. Smaller diameters make reassembling the branches more difficult, and smaller diameters make branches more prone to breakage during weathering at the outcrop. Alternatively, the depositional environment in the Cincinnatian may have been more conducive to breaking the delicate terminal branches of ramose stenolaemates. This is unlikely as most of the colonies came from the lower energy, deeper water shale units (Dattilo et al., Reference Dattilo, Brett and Schramm2012). Unbroken growing tips were present at some point during the life of the colony, but perhaps most of our colonies were buried during a season with higher storm frequency and/or magnitude (Dattilo et al., Reference Dattilo, Brett and Schramm2012) when most branches were in the broken state.
This paucity of pristine growing tips (29) is in contrast to Boardman (Reference Boardman1960), who reported >180 growing tips in the Devonian Hamilton Group trepostomes of New York. Among our colonies, we see two distinct clusters in the relative frequency of pristine growing tips. The younger cluster from the Richmondian Stage (C4 sequence of Holland and Patzkowsky, Reference Holland and Patzkowsky1996) and the older cluster from the Edenian and Maysvillian Stages (C1–C2 sequences of Holland and Patzkowsky, Reference Holland and Patzkowsky1996; Table 2). The two colonies from the Richmondian Stage have on average 71% of their branches terminated by a pristine growing tip (Table 3). The remaining 29% are old broken tips that have begun to heal and regrow. By contrast, the 14 colonies from the Edenian and Maysvillian Stages have on average 6% of their branches terminated by a pristine growing tip (Table 3). The Richmondian colonies are from a location 30 km to the east of the Edenian+Maysvillian colonies as well as >6 Myr stratigraphically up-section (Brett et al., Reference Brett, Kohrs and Kirchner2008, fig. 2). Thus differences in the relative frequency of pristine growing tips and old broken branches may be due to differences in paleoenvironment, taxonomy, or evolutionary history. If the Richmondian colonies are from a deeper paleoenvironment with less frequent storms, we would predict them to have fewer branches with old breaks and more pristine growing tips. We can rule out this hypothesis as the Sunset Member of the Arnheim Formation has been interpreted as having a shallower paleobathymmetry than the Kope Formation where all but one of the Edenian+Maysvillian colonies originate (Holland, Reference Holland1993, fig. 8; Smrecak and Brett, Reference Smrecak and Brett2014, fig. 1; Table 2). If the Richmondian colonies belong to taxa with more robust branches that are less prone to breakage during storm events, then we would predict them to have fewer branches with old breaks and more pristine growing tips. We can rule out this hypothesis as the Richmondian colonies have on average 26% narrower branches than the Edenian+Maysvillian colonies (Table 3). Finally, if the Richmondian colonies are from a time in evolutionary history when the Sanctum laurentiensis tracemakers were less abundant, then we would predict them to have fewer branches with old breaks and more pristine growing tips. Unfortunately, the abundance and stratigraphic distribution of this trace fossil has not been previously analyzed. The results from this study suggest the Sanctum laurentiensis tracemakers were more abundant during the Edenian+Maysvillian than the Richmondian. This hypothesis will be tested in the following.
The incidence of mined out branches in this study (59%) is higher than in the only other published data on the relative frequency of this trace fossil, which is from Erickson and Bouchard (Reference Erickson and Bouchard2003). They report 33% of distal branches mined out in a colony of the ramose trepostome Parvohallopora sp. from the Cincinnatian. By sectioning the colony transversely below the preserved top, they discovered that the majority of the branches were broken off down to the level of endozonal mining. This supports our results with the majority of broken branches being mined out, which made the branches more susceptible to breakage. On average, 33% of the endozones of broken branches from the Richmondian colonies were mined out. By contrast, 63% of the endozones of broken branches from the Edenian+Maysvillian colonies were mined out. Sanctum laurentiensis tracemakers may have been more abundant prior to the Richmondian Invasion (Holland, Reference Holland1997). This resulted in more old broken branches and fewer pristine growing tips. This is supported by the fact that the Richmondian colonies had on average 3.0 large diameter borings per colony that could have provided access for the endoskeletozoan that mined out the endozones. The Edenian+Maysvillian colonies had on average 5.4 borings (unpublished data, Wyse Jackson and Key).
Branching metrics
As shown by Fibonacci in 1202 (Sigler, Reference Sigler2002), the number of branches in an arborescent organism increases systematically with growth. As expected, our colonies also showed this, with taller colonies having significantly higher maximum Shreve branch orders and significantly more first-order branches (Fig. 4). Our Horton-Strahler branching ratios (mean of 2.4) are similar to those of Cheetham et al. (Reference Cheetham, Hayek and Thomsen1980), who measured a range of 2.0–2.5. These ratios are lower than marine coral values (Sánchez et al., Reference Sánchez, Lasker, Nepomuceno, Sánchez and Woldenberg2004) and terrestrial tree values (Oohata and Shidei, Reference Oohata and Shidei1971; Whitney, Reference Whitney1976). Cheetham et al. (Reference Cheetham, Hayek and Thomsen1980) claimed that lower branching ratios are a function of higher internal (i.e., genetic) control of colony form rather than external (i.e., environmental) control. They argue, sensu Oster and Alberch’s (Reference Oster and Alberch1982) canalized development or Gould’s (Reference Gould2002) channelized development, that the tendency to adhere to characteristic values of branching properties during growth is apparently a direct expression of genetic control. In bryozoans, this evidences itself in a type of self-similarity, different from that in trees (Cheetham et al., Reference Cheetham, Hayek and Thomsen1980). A distal portion of a tree is essentially a miniature tree (Leopold, Reference Leopold1971), but a distal portion of a bryozoan colony is essentially a representation of the whole branching structure at a less developed stage of growth (Cheetham et al., Reference Cheetham, Hayek and Thomsen1980). This is reflected in lower branching ratios in bryozoans.
We investigated the internal (i.e., genetic) control versus external (i.e., environmental) control of branching ratio by comparing the two orders included in this study. The one cystoporate species (i.e., Constellaria florida with a Horton-Strahler branching ratio of 2.0) falls within the range of the six trepostome species (range: 1.9–3.3, mean: 2.5, n: 6, standard deviation: 0.5). This suggests that the low branching ratio is similar among the orders within class Stenolaemata. As our ratios (1.9–3.3) overlap those from the study by Cheetham et al. (Reference Cheetham, Hayek and Thomsen1980) involving cheilostome species from class Gymnolaemata (2.0–2.5), it suggests branching order may even be genetically controlled at the phylum level. The small sample size and minimal intraphylum clade diversity between this study and that of Cheetham et al. (Reference Cheetham, Hayek and Thomsen1980) prevent more thoroughly differentiating genetic from environmental constraints (e.g., shallower unstable vs. deeper more stable environments).
Drawing on the study by Cheetham et al. (Reference Cheetham, Hayek and Thomsen1981) on branching in cheilostomes, we predicted link diameter would increase with increasing branch order (i.e., proximally toward the base of the colony). Maximum branch order of colonies was positively correlated with mean link length and diameter, but only the former was significant (R2 = 0.257, p = .045). The lack of significant correlation with link diameter may be due to interspecific variation in branch diameter as indicated in Figure 1. The mean branch diameters in our 16 colonies ranged from 5.6 mm in Batostomella gracilis (Nicholson, Reference Nicholson1874), OSUN 2 to 10.5 mm in Stigmatella sp., OSUN 9 (Appendix). Using only the complete links (i.e., not terminal links with broken tips), mean link length is positively and significantly correlated with mean link diameter in the 16 colonies (R2 = 0.300, p = .028). This means that as predicted, as a colony grows the branches are getting narrower as well as shorter in response to more frequent bifurcations. This is true for many bryozoans (Cheetham et al., Reference Cheetham, Hayek and Thomsen1980, Reference Cheetham, Hayek and Thomsen1981) as well as for branching organisms and streams in general (Fleury et al., Reference Fleury, Gouyet and Léonetti2001). Our fossil data do not permit discrimination between this being determinant (i.e., genetically controlled) and simply being a function of younger branches having narrower branches than older branches that have had more time to thicken.
In ramose colonies, this basal branch thickening allows a colony to withstand the exponentially increasing drag on the colony with increasing height above the substrate (Cheetham, Reference Cheetham1971, Reference Cheetham1986). Boardman’s (Reference Boardman1960) study of Devonian ramose trepostomes found no such pattern due to rampant self and epibiotic overgrowths in his species and dead or at least dormant proximal portions of colonies. The rarity of overgrowths, encrusters, and borers (unpublished data, Wyse Jackson and Key) and the systematic proximal increase in branch diameter suggest the zooids in the proximal portions of our colonies were alive.
Conclusions
Fragmentation has always been a major problem when attempting to reconstruct environmental tolerance levels in paleocommunities dominated by arborescent organisms. This study involving reassembled ramose bryozoan colonies provides a rare glimpse across this temporal barrier.
Collecting clusters of associated bryozoan colony fragments weathering out of bedding planes allows for the reassembly of colonies. Despite the enormous effort and resulting reduced sample sizes in studies involving reassembled bryozoan colonies, much valuable colony-level information can be acquired. Endozonal mining by endoskeletozoans resulted in branch breakage, which was widespread. The frequency of this breakage varies stratigraphically, perhaps in response to the distribution of the boring animals. We were able to quantify colony dimensions, branch link length and diameter, as well as branch order. Height and width of the original colony shape could be more accurately determined than the third dimension due to diagenetic compaction. Colony branching ratio may be more genetically than environmentally controlled. These preliminary results suggest branching ratio is consistent across some stenolaemates orders, but not all (e.g., ‘Idmonea’ atlantica in Harmelin, Reference Harmelin1973). The rarity of borers and the systematic proximal increase in branch diameter in these colonies suggest the zooids in the proximal portions of the colonies were alive at the time of colony death. Colony-level morphometric data should provide new characters to test taxonomic, phylogenetic, and paleoenvironmental hypotheses.
Acknowledgments
J. St. John (Department of Geology, Ohio State University at Newark, USA) provided the OSUN colonies that were reassembled by himself, M. E. St. John, and N. Anderson. G. Courtney and R. Fine of the Dry Dredgers were invaluable in sharing their knowledge of reassembled colonies in the diligent amateur paleontology community. This paper was greatly improved through critical reviews by J. St. John, S. J. Hageman (Department of Geology, Appalachian State University, USA), E. Håkansson (School of Earth & Environment, University of Western Australia, Australia), and C. Reid (Department of Geological Sciences, University of Canterbury, New Zealand).
Appendix
Colony-level morphometric data for each of the Upper Ordovician (Cincinnatian) ramose bryozoan colonies in this study. CMC = Cincinnati Museum of Natural History and Science’s Geier Collections and Research Center; OSUN = Ohio State University at Newark.