Introduction
The American agricultural community of today is challenged with producing an adequate quantity of healthy food without further damage to the environment. The key issue confronted by agricultural producers in America is that our current methods of food production and handling are not comprehensively environmentally, economically and socially sustainable. If appropriate changes are not made, our ability to produce sufficient quantities of high quality food and maintain an ecological and social environment that can support a growing population will be impaired. Consequently, food production may decline in America with increased imports to support our population.
The application of conventional agricultural practices on our nation's soils can foster an environment for the introduction of a wide variety of destructive pestsReference Hill1. These pests are then largely controlled by the use of chemicals. This cycle is particularly evident in the bare-soil monocultures prevalent in much of American agriculture. The results of these cultural practices include, but are not limited to, increased soil erosion, contamination of food and water with nutrients and agrichemicals, and reduction in the number of farms and farmers.
Environmentally sustainable agriculture emphasizes growing complementary crops and animals together in appropriate sequences, keeping the soil covered with growing crops and mulches, including crops and practices that maintain the productivity of the farm, and using detailed knowledge of ecological relationships to reduce the use of purchased inputs such as pesticides and fertilizers to solve problems. Nutrient-use efficiency is a major concern when environmental sustainability is the goalReference Bergström and Goulding2. A range of solutions for improving nutrient-use efficiency exist and they range from simple to complex. Government policies, including subsidies; research and technology; and public acceptance of farming practices all combine to create these solutions.
Social and political commitments are required to balance the goals of improved production and profitability, stewardship of the natural resource base and ecological systems, and enhancement of the vitality of rural communities. Such goals must be integrated into various policies and programs, particularly through interagency collaboration, partnerships and outreachReference Gold3. A transition to sustainable practices from conventional agriculture is going to be difficult. It will depend on our ability to integrate technological, economic, social and political aspects of environmental protection and economic development into a unified and consistent management strategy. Agricultural land (cropland and grassland) now rivals forestland in terms of land use and because of anthropogenic impact it is becoming more dominant in environmental managementReference Ramankutty and Foley4. Although the trend is decreasing as availability of suitable land is becoming more limited, more than 13 million ha−1 year globally is converted from some other land use into agriculture. This is driven in part by the need to feed a growing world population and the degradation of existing agricultural lands. Some forecasters are estimating a worldwide population explosion from the current 6.6 billion people to 8 billion people by the year 2020 and to 9.4 billion by 2050. To meet the inevitable soaring worldwide food demands of these people, agriculture will need to produce as much in the next 25 years as it has produced in the past 10,000 years5.
The doubling of global agricultural food production during the past 35 years was associated with a 6.9-fold increase in nitrogen fertilization, a 3.5-fold increase in phosphorus fertilization, a 1.68-fold increase of irrigated cropland, and a 1.1-fold increase of land in cultivation. Based on linear extrapolation, the anticipated next doubling of global food production would be associated with an approximate 3-fold increase in nitrogen and phosphorus fertilization rates, a doubling of the irrigated land area, and 18% increase in croplandReference Tilman6.
Current Trends in Agriculture
American agriculture has changed greatly over the past century. From 1930 to 2002 we have seen a decrease in the workforce employed in agriculture from 22 to 2%, a decrease in the percentage of agriculture as an apportionment of total gross domestic product from 7.7 to 0.7%, and an increase in the percentage of farmers working off farm from 30 to 93%Reference Dimitri, Effland and Conklin7. These statistics are indicative of several current trends in US and world agriculture.
Increased land degradation
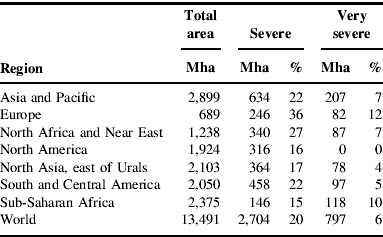
Human-induced land degradation is a serious global problem. Currently, approximately 25% of the world's, and nearly half of Europe's, total land area is severely or very severely degraded (Table 1). The causes of degradation are poor agricultural practices, overgrazing, deforestation, commercialization and overexploitation of vegetation8. As population pressures increase, there may be increased pressure to develop marginal lands for agriculture, which may increase global land degradation.
Table 1.Total area and percent of total land area with severe or very severe human-induced land degradation by region and world total.
Competing land uses
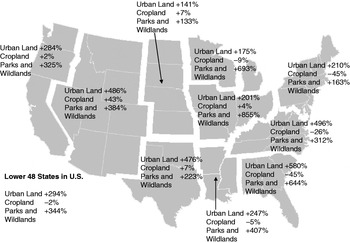
Another trend in modern-day American agriculture is that of competing uses for land that prevent conversion of land to agriculture and lead to conversion of one-time agricultural land to urbanized, wildlife or recreational use. Of particular concern is conversion to urban use, which causes permanent losses of often very productive agricultural lands. To accommodate a growing urban population, world cities will need to expand at a rate equivalent to building more than 13 new great cities (of population >5 million) each year, primarily in developing areas of the worldReference Kates and Parris9. In the contiguous US, urban areas are increasing at a rate of 405,000 to 567,000 ha per yearReference Westerby and Krupa10. Urban areas are increasing most rapidly in the Southeastern, Appalachian and Mountain areas of the US (Fig. 1). Land in parks and wildlife areas have increased >300% in the US since 1945 (Fig. 1). Land area in cropland has remained stable since 1945 with the largest increases in the Northern and Southern Plains states largely offset by decreases in Eastern states (Fig. 1).
Figure 1.Percentage change in urban land, cropland, and parks and wildlands from 1945 to 2002 for ten different regions of the US and for the lower 48 US States. Source: ERS-USDA Major Land Uses (http://www.ers.usda.gov/Data/MajorLandUses/), updated October 19, 2005, accessed December 2, 2005.
Focus on single ecosystem service
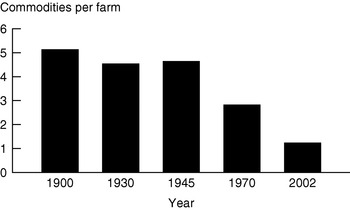
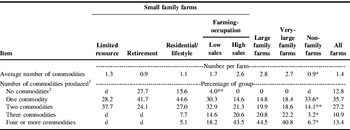
Farmland increased in the US until 195011. Since then farmland has declined. Farm specialization has become predominant. This has led to a general decline in landscape diversity with negative consequences for provision of ecosystem services. From 1900 to 2000, the number of commodities produced in the US has decreased from about five to just over one per farm (Fig. 2). Currently >60% of the farms in the US produce only one or two commodities and <14% of farms produce four or more commodities (Table 2). In part, the low average may be due to the inclusion of a large number of retirement and residential/lifestyle farms, which often do not produce any commodities. However, small family farms with high sales, large family farms, and very large family farms, which have the highest average number of commodities per farm, produce fewer than three commodities per farm (Table 2). These farms have more than double the number of commodities compared with limited resource farms. Nearly one-third of limited resource farms specialize in beef cattle production, which generally has low labor requirements (Table 2). Small family farms with high sales, large family farms, and very large family farms may have the economic or labor resources needed to operate multiple commodities. Hoppe and KorbReference Hoppe, Korb, Banker and MacDonald12 also suggested that the tax code might limit commodity diversity on residential/lifestyle farms. These farms can write-off farm losses especially if they are offset by high off-farm income.
Figure 2.Average number of commodities produced on a US farm from 1900 to 2002. Note: the average number of commodities per farm is a simple average of the number of farms producing different commodities (corn, sorghum, wheat, oats, barley, rice, soybeans, peanuts, alfalfa, cotton, tobacco, sugar beets, potatoes, cattle, pigs, sheep, and chickens) divided by the total number of farms. Modified from Dimitri et al. Reference Dimitri, Effland and Conklin7.
Table 2.Commodity specialization by farm type in 2001.
Farmers want to produce the most marketable and cost effective products. Therefore, they logically choose to produce what they perceive as the most marketable commodity. Actively managing for multiple ecosystem services can substantially reduce agriculture's environmental footprint and can be encouraged with production incentives that reward environmental stewardship. These incentives, whether trade-based or policy-based, must be tailored to work in both developed and developing economies to forestall continued environmental degradation and loss of agricultural sustainabilityReference Robertson and Swinton13. Policies with adequate incentives must be provided for ecosystem services such as clean water and air, plant pollination, disease suppression, habitat development and restoration, and carbon storage.
Increase in farm size
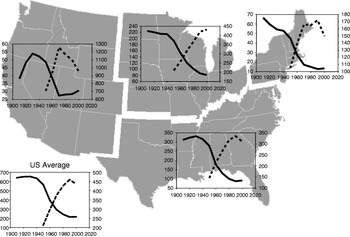
The number of farms in the US has been decreasing since about 1930, with a corresponding increase in farm size (Fig. 3). This trend has been most pronounced for states in the North Central and Southern US. In the Western US, the number of farms has increased slightly since 1970. In 1997, the government's definition of a farm changed. According to the new definition, people living in town whose only farm income was a Conservation Reserve Program (CRP) payment as well as people who owned or stabled at least five horses somewhere on the property were counted as farmers. The change resulted in a 17% increase in farms with less than $10,000 in annual income. Therefore, when examining the five-year window from 1992 to 1997 the number of farms decreased by less than 1%. In the 50-year period between 1940 and 1990, farm size more than doubled and the number of farms decreased 67%Reference Dimitri, Effland and Conklin7. Large, very large and nonfamily farms account for 72% of the value of agricultural production in the US, but make up only 10% of the farmsReference Westerby and Krupa10.
Figure 3.Regional and US average change in farm numbers from 1910 to 2002 and in average farm size from 1945 to 2002. In each graph the x-axis is year, left y-axis is farm number (10,000) and right y-axis is farm size in acres. Solid line is farm number and the dashed line is farm size. Source: NASS, USDA Quick Stats (http://151.121.3.33:8080/QuickStats/PullData_US), accessed December 2, 2005.
Movement toward commercialization
The commercialization of the American farm has been pronounced over the past several years. As farm numbers have decreased and farm size increased, the food processing industry has also been concentrated into fewer commercial operations. The four-firm concentration ratio (i.e., the sales of the four largest firms as a percentage of total sales) in meatpacking increased from 26% in 1972 to 57% in 1997 with similar increases in other processing industries such as poultry slaughter and soybean processingReference Ollinger, Nguyen, Blayney, Chambers and Nelson14. A trend is also developing toward supply-chain consolidationReference Ollinger, Nguyen, Blayney, Chambers and Nelson14. In this type of consolidation, all stages of production, processing and distribution are woven tightly together to ensure reliable, efficient product deliveryReference Drabenstott15. Supply chain consolidation predominates in the poultry industry and is beginning in the pork industry. This consolidation has geographic consequences. This concentration further decouples crop and livestock agriculture by shifting the base of operations from near feed production facilities to areas of lower labor costs and closer to key markets. In the pork industry, for example, real growth has not occurred in the Corn Belt but rather in the Southeastern and in the Southern Great Plains areas of the USReference Drabenstott15.
Commercialization in the US has replaced ownership and farm control by the farmer with that of the investment community. This has restricted the involvement of the farmer in the decision-making process. In the commercialization model, the predominant decision-making criterion has become the economic bottom-line. We can see and understand more fully the intent of commercialized farming by examining its philosophical bent: (1) nature is a resource to be exploited and variation is to be suppressed; (2) natural resources are not valued except when a necessary expense in production is incurred; (3) progress is equivalent to the evolution of larger farms and depopulation of farm communities; (4) progress is measured primarily by increased material consumption; (5) efficiency is measured by looking at the bottom-line economics; and (6) science is an unbiased enterprise driven by natural forces to produce social goodReference Stauber, Hassebrook, Bird, Bultena, Hoiberg, MacCormick, Menanteau-Horta, Bird, Bultena and Gardner16. Certainly, these philosophies are in direct conflict with the development of sustainable agricultural systems. Specifically, we can immediately recognize three areas of concern regarding commercialization of the farming enterprise. First is the ecological concern. Declines in soil productivity, desertification and water pollution, increased scarcity of water, increased and new pests, and rapid global climate change are viewed as negative impacts only if they have a direct cost to the production system. Secondly are the economic and social concerns. These include increased federal regulation, disparate farmer incomes, disappearance of the mid-sized farm, and urban sprawl. Once again, without a direct cost to the production system, or an overriding social consequence, these changes in agricultural systems are not viewed as losses or problems. Finally are the human health concerns. Included here are the overuse of antibiotics in animal production, nitrate and pesticide contamination of water and food, and the release of other toxic residues into our food and fiber supplyReference Gold3. These negative consequences are traditionally handled by reactive rather than proactive approaches.
Genetic engineering
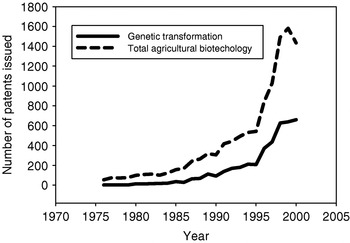
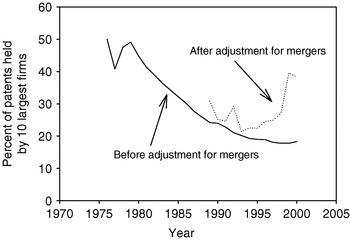
Genetic engineering has become an important technology in US agricultural production. In 2005, 87% of soybean, 79% of cotton and 52% of corn acreage in the US were planted to genetically engineered varieties17. Genetic transformation as well as all agricultural biotechnology patents have increased dramatically since 1975 (Fig. 4) and funding has skyrocketed for projects involving the development of genetically modified organisms. However, consolidation has increased in the biotechnology industry since 1995, following the same trends as for other aspects of agricultural production (Fig. 5).
Genetic engineering has been incorporated into current agricultural systems out of a need to overcome several agricultural issues, including the availability of farming land, climatic change, declining water resources, and growing demand for food, fiber, fuel, industrial products and products based on ‘functional’ plants. In perhaps an overly optimistic push, proponents of genetic engineering promise to conquer world hunger. Genetic engineering is based on a mechanistic worldview, which presumes the world operates a lot like a machine. Biotechnology may give us the ability to build, redesign, repair and replace living things. However, careful evaluation of the application and potential overuse of biotechnology in agriculture raises several concerns. First, the risks may outweigh the benefits. The risks involved in biotechnology are not fully understood. Currently there is no adequate method to predetermine the potential impacts of a released genetically modified organism on the ecosystem. Therefore, a precautionary principle should be applied to assure public safety. A new product should not be approved unless there is strong evidence that it is safe and promises important public benefit. The burden of evidence of safety and effectiveness should be the responsibility of the one seeking approval and not the responsibility of the public. Yet for agriculture to continue, knowledge-based and value-added agriculture must become a reality. Resource conservation becomes the most important issue for the future of agriculture. ‘The possibilities offered by efficiency developments in conventional seed breeding, supported by gene technology and plant genomic research, will improve the prospects of being able to use our limited natural resources to best effect in the 21st century’Reference Kern18.
Global markets
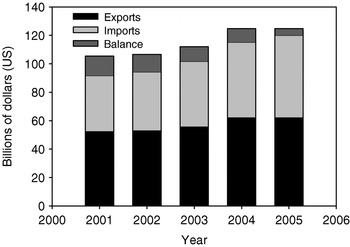
Agricultural producers in the US are competing in an increasingly global marketplace. Compared to producers in the US, producers in other countries may be able to produce agricultural commodities cheaper. For example, foreign soybean production has recently exceeded that of the US Reference Ash19. Even though agricultural exports remain strong and imports are increasing, the overall US agricultural trade balance has decreased since 2001 (Fig. 6).
The expansion of trade and faster information flow through the internet are converging to alter the worldwide farm and food system. The new farm era is fueled by at least five major issuesReference Thiermann20: (1) finance, technology and information are being democratized; (2) the internet has empowered global information dissemination and increased the speed of information dissemination; (3) the basic human desire for a better life has emerged at the root of globalization; (4) an increased role of world governments to become competitive in the global agricultural marketplace by becoming more efficient and offering higher quality service; and (5) opportunities have evolved through international trade to improve consumer health, provide consumer choices and increase producer income.
Changing social structure
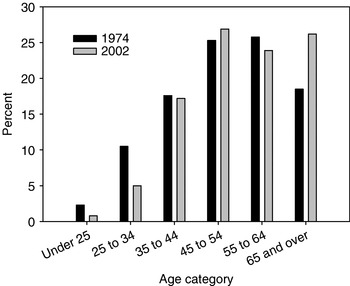
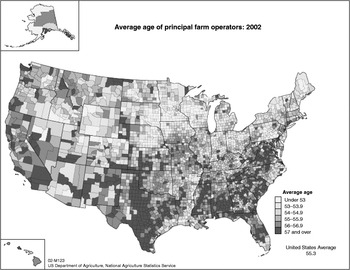
The previous trends have led to a fundamental change in the social structure of US agricultural communities. Agriculturalists in the US are aging at an alarming rate. Since 1974 the number of farmers ⩾65 years old has increased and the number of farmers ⩽35 years old has decreased (Fig. 7). In general, farmers are older in the southern states than in other areas (Fig. 8). There are also age differences between principal production enterprises. Hog and pig farmers had the youngest average age (49.2) and sugar cane, hay crop and other crops had the oldest average age (57.5)Reference Allen and Harris21. Capital investment can serve as an effective barrier to new farms and limit the types of new, viable enterprises.
Fewer and fewer young people have an interest or opportunity to be directly employed in production agriculture. This subsequently has led to a movement away from rural environments toward urban centers. Corporate farms are being established throughout the US resulting in a disappearance of the middle-sized farms. The outcome of these combined phenomena is a polarization of the agricultural community.
Future Trends and Challenges in Agriculture
The question now is, ‘What does the future have in store for US agriculture?’ The driving factors for the near future in agriculture have been put in place. Judging from the outcome of past legislation, the US Farm Bill appears to dictate the crops farmers should produce and thereby drives the production practices employed. Ultimately, this leads to competition between farmers and other programs for federal funds. Increased competition for limited federal funds in combination with international trade issues are likely to result in changes to farm programs. The general population is one or more generations removed from farming. Although the public has less direct connection to agricultural production, there is increased demand for a perceived environmental stewardship. Consumers may not be well informed, but they are discerning. This will bring to the forefront such issues as product identity preservation, designer crops, improved quality (especially in relation to health issues), and organic (reduced use of chemical pesticides and fertilizers) production and commercialization of food. These demands for environmental stewardship and food quality characteristics are likely to shape future agricultural policy and to be reflected in the marketplace. Concurrently, producers are looking for additional economic opportunities and are becoming more market astute. This may cause a movement away from standard crop rotations. This will result in an increase in multiple farm enterprises within a single farm operation, farm ownership in different geographical regions, development of other forms of income-generating operations (i.e., hunting, fishing, site-seeing, etc.) and a flexibility in the use of the products they produce. Agricultural production will no longer be focused solely on the food and feed markets, but will include other outlets such as energy and industrial uses. For example, corn and soybean will not only be used as livestock feed, but will also be sold for the generation of biofuels (ethanol and biodiesel). The use of a biofuel crop within an integrated system adds not only to farm diversity but also is of great importance to the rural community. Selling starch (corn or dry peas) or lignocellulosic material (switchgrass or big bluestem) certainly gives the producer an added economic incentive. But, facilities must be developed to manage and use these materials. Thus, the development of a bioenergy program helps enhance the local economy by providing jobs and an increased tax base.
Because of the bimodalization of farm size and wealth, the middle-sized farm is disappearing. In response to these changes, producers are focusing more on controlling perceived risks. Producers are seeking to increase diversity of marketable products and want an array of options for making the best possible decisions.
Future trends of US agriculture can be inferred from the aforementioned driving factors. These trends are based on the assumption that the conditions that have favored the development of commercialized agriculture will continue. Alternative viewpoints argue that to be sustainable, agriculture must adopt a holistic systems approach that works with the environmental constraints of nature rather than against themReference Ikerd22. Ten future trends regarding the future of US agriculture are envisioned: (1) there will be diminishing margins of return and increased volatility of farm incomes; (2) the predominant player in food regulation will no longer be the government, but rather international trade organizations or perhaps other non-government organizations; (3) a movement from farming to agribusiness will continue; (4) land-use issues will become major issues; (5) the US consumer will continue to increase animal protein consumption; (6) the public will be increasingly concerned regarding the methods of production and movement of livestock; (7) many historically rural counties in the US will experience increased urbanization; (8) the public concern regarding food safety will increase; (9) the medicalization of agriculture will continue to increase; (10) new and emerging tastes, markets and opportunities will expandReference Fresco23.
In addition, farms of the future that are owned and run by resident producers will be more diverse, they will exhibit managers who are more innovative and creative, they will be based on stronger notions of economic, environmental, social and political sustainability, and they will contribute more to the well being of the community. Overall, farms of the future will be managed much more intensively. A transition to a sustainable world will depend on our ability to integrate technological, economic, social and political issues of environmental protection and economic developmentReference Weston24. Whether or not commercialized farms become dominant, US agriculture of tomorrow will face at least four major challenges in completing this transition:
1. Competitive pressures. Future farm policies and management scenarios must be developed to minimize conflicts over land use. Ultimately, land-use decisions should be based on providing the greatest need to the community, and ideally, regulatory and incentive systems will help in the valuation of community benefits. If this is not the case, look for the continued failure of US agricultural systems. In addition, because foreign producers may be able to produce some products cheaper than US farmers, producers must be willing to produce products where they have a competitive advantage.
2. Sustainable development. Agriculture in the US will remain viable only if the environment is protected and enhanced. Thus, sustainability will become the central organizing principle for environmental management. Stated more completely, sustainable development is ‘a process of change in which the direction of investment, the orientation of technology, the allocation of resources, and the development and functioning of institutions meet present needs and aspirations without endangering the capacity of natural systems to absorb the effects of human activities, and without compromising the ability of future generations to meet their own needs and aspirations’Reference Brooks and Carter25.
3. Resource conservation. Policies must encourage efficient use of land for maximum benefit of the entire population.
4. Research and development. New and improved products must be developed. This should not be restricted to biotechnology and genomics, but also include social and economic development. Social, economic and environmental information will need to be developed and policies implemented to identify, quantify and harmonize the different and often conflicting priorities within the society.
Principles for Meeting Future Challenges
In the past, American agriculture was focused solely on its ability to produce sufficient food, fuel and fiber to meet national and global demands. While productivity will continue to be a major factor in food production systems, increased societal demands for environmentally sound management, the need for rural community viability and a rapidly changing global marketplace have resulted in the relatively rapid evolution of agricultural systems. Integrated agricultural systems may assist in addressing some of these challenges. However, when helping to design and manage these systems, researchers need to be aware of the external influences that may affect these systems. Ludwig et al. suggested four reasons for overexploitation and frequent collapse of systems that are modified in response to scientific information and consensus, including: (1) wealth or prospect of wealth generates political and social power that is used to drive overexploitation of the system; (2) each system is so unique that comparisons between systems are impossible, therefore one's ability to manipulate the system is hampered and the impact of those manipulations is unpredictable; (3) natural variation masks arising problems and even potential system collapse until it is too late to correct the problem; and (4) assigning causes to past events is problematical, future events are not predicted well, and even well-meaning attempts to exploit the system responsibly may lead to disastrous consequencesReference Ludgwig, Hilborn and Walters26. By considering these factors, perhaps the paralysis that so frequently occurs and prevents proactive adjustments to conserve needed resources can be overcome.
Yet, in the pursuit of sustainable agricultural systems, it would be useful to identify guiding principles by which they may be developed. Ideally, these principles would facilitate the development of sustainable systems without a change of ownership or bankruptcy. These principles should represent ‘fundamental truths’ that are common to all sustainable systems. By analyzing external influences on agricultural systems, a preliminary set of principles for integrated and dynamic agricultural systems is proposed below. These principles are organized into four categories, and are presented as a starting point with the idea that they may be tested and modified.
Economics and economic policies
• Bigger is not necessarily better.
• As farm size goes up, the number of farmers decreases.
• The commercial agricultural model does not lead to sustainability.
• Corporate production contracts result in dependent ‘corporate farm hands’.
• Economic efficiency must be balanced by regional economic concerns. When efficiency losses are not too great, recycling farm income through the local community will strengthen the community, which will in turn strengthen local farms.
Environmental
• Serious consideration of limited natural resources, efficient and judicious use of nonrenewable resources, and care for the environment are critical to the health of the ecosystem and our own well-being.
• Zero waste is an appropriate goal for managed agroecosystems.
• Streamlining processes and reusing materials will result in zero waste.
• Relying increasingly more on renewable resources for energy will reduce or eliminate agricultural dependency on fossil fuels.
• Reducing consumption of animal protein and food in general will relieve the burden on available global resources.
• Managers should adapt farm production to the environment rather than attempt to adapt the environment to farm production practices.
Social and political
• Through the efficient use of space, increased conservation of materials and energy resources, and reduced transportation, sustainable communities can be developed.
• Through more efficient administration and planning, ecological living conditions that are more economically and socially desirable can be developed.
• Consumerism is not sustainable.
• The principle of sustainable agriculture must be included as a component for developing sustainable communities.
• Regional cooperation between farmers and other relevant stakeholders is necessary for sustainable landscape development.
• To value and manage agricultural landscapes for multiple ecological services the integration of ecological and socioeconomic research, policy innovation and public education is required.
Technological
• New technologies can be useful for solving environmental problems while increasing economic productivity.
• For US agriculture to continue along a sustainable path of economic development, further production increases must be generated by technologies that are profitable, environmentally benign and not socially destructive.
• Markets must be developed that value environmental attributes to speed the adoption of ‘sustainable or green technologies’.
• Even when technologies are profitable, barriers to adopting new practices can limit the effectiveness of green technologies.
• Technology should be selected for appropriateness rather than simply for the sake of technology.
• Use of off-farm inputs can be reduced by increasing the level of management.
Summary
Agriculture, as we know it, is destined to undergo remarkable change. The US agricultural community will face many new and difficult challenges in the years to come. The global marketplace is already dictating agricultural policy and subsequent production in the US. New policies need to be developed to encourage the development of integrated-dynamic agricultural systems. These systems can ultimately assist land managers to develop new and improved sustainable land-use strategies to the benefit of generations to come.





 You have
Access
Introduction
The American agricultural community of today is challenged with producing an adequate quantity of healthy food without further damage to the environment. The key issue confronted by agricultural producers in America is that our current methods of food production and handling are not comprehensively environmentally, economically and socially sustainable. If appropriate changes are not made, our ability to produce sufficient quantities of high quality food and maintain an ecological and social environment that can support a growing population will be impaired. Consequently, food production may decline in America with increased imports to support our population.
The application of conventional agricultural practices on our nation's soils can foster an environment for the introduction of a wide variety of destructive pestsReference Hill1. These pests are then largely controlled by the use of chemicals. This cycle is particularly evident in the bare-soil monocultures prevalent in much of American agriculture. The results of these cultural practices include, but are not limited to, increased soil erosion, contamination of food and water with nutrients and agrichemicals, and reduction in the number of farms and farmers.
Environmentally sustainable agriculture emphasizes growing complementary crops and animals together in appropriate sequences, keeping the soil covered with growing crops and mulches, including crops and practices that maintain the productivity of the farm, and using detailed knowledge of ecological relationships to reduce the use of purchased inputs such as pesticides and fertilizers to solve problems. Nutrient-use efficiency is a major concern when environmental sustainability is the goalReference Bergström and Goulding2. A range of solutions for improving nutrient-use efficiency exist and they range from simple to complex. Government policies, including subsidies; research and technology; and public acceptance of farming practices all combine to create these solutions.
Social and political commitments are required to balance the goals of improved production and profitability, stewardship of the natural resource base and ecological systems, and enhancement of the vitality of rural communities. Such goals must be integrated into various policies and programs, particularly through interagency collaboration, partnerships and outreachReference Gold3. A transition to sustainable practices from conventional agriculture is going to be difficult. It will depend on our ability to integrate technological, economic, social and political aspects of environmental protection and economic development into a unified and consistent management strategy. Agricultural land (cropland and grassland) now rivals forestland in terms of land use and because of anthropogenic impact it is becoming more dominant in environmental managementReference Ramankutty and Foley4. Although the trend is decreasing as availability of suitable land is becoming more limited, more than 13 million ha−1 year globally is converted from some other land use into agriculture. This is driven in part by the need to feed a growing world population and the degradation of existing agricultural lands. Some forecasters are estimating a worldwide population explosion from the current 6.6 billion people to 8 billion people by the year 2020 and to 9.4 billion by 2050. To meet the inevitable soaring worldwide food demands of these people, agriculture will need to produce as much in the next 25 years as it has produced in the past 10,000 years5.
The doubling of global agricultural food production during the past 35 years was associated with a 6.9-fold increase in nitrogen fertilization, a 3.5-fold increase in phosphorus fertilization, a 1.68-fold increase of irrigated cropland, and a 1.1-fold increase of land in cultivation. Based on linear extrapolation, the anticipated next doubling of global food production would be associated with an approximate 3-fold increase in nitrogen and phosphorus fertilization rates, a doubling of the irrigated land area, and 18% increase in croplandReference Tilman6.
Current Trends in Agriculture
American agriculture has changed greatly over the past century. From 1930 to 2002 we have seen a decrease in the workforce employed in agriculture from 22 to 2%, a decrease in the percentage of agriculture as an apportionment of total gross domestic product from 7.7 to 0.7%, and an increase in the percentage of farmers working off farm from 30 to 93%Reference Dimitri, Effland and Conklin7. These statistics are indicative of several current trends in US and world agriculture.
Increased land degradation
Human-induced land degradation is a serious global problem. Currently, approximately 25% of the world's, and nearly half of Europe's, total land area is severely or very severely degraded (Table 1). The causes of degradation are poor agricultural practices, overgrazing, deforestation, commercialization and overexploitation of vegetation8. As population pressures increase, there may be increased pressure to develop marginal lands for agriculture, which may increase global land degradation.
Total area and percent of total land area with severe or very severe human-induced land degradation by region and world total.
Source: FAO AGL.
Competing land uses
Another trend in modern-day American agriculture is that of competing uses for land that prevent conversion of land to agriculture and lead to conversion of one-time agricultural land to urbanized, wildlife or recreational use. Of particular concern is conversion to urban use, which causes permanent losses of often very productive agricultural lands. To accommodate a growing urban population, world cities will need to expand at a rate equivalent to building more than 13 new great cities (of population >5 million) each year, primarily in developing areas of the worldReference Kates and Parris9. In the contiguous US, urban areas are increasing at a rate of 405,000 to 567,000 ha per yearReference Westerby and Krupa10. Urban areas are increasing most rapidly in the Southeastern, Appalachian and Mountain areas of the US (Fig. 1). Land in parks and wildlife areas have increased >300% in the US since 1945 (Fig. 1). Land area in cropland has remained stable since 1945 with the largest increases in the Northern and Southern Plains states largely offset by decreases in Eastern states (Fig. 1).
Percentage change in urban land, cropland, and parks and wildlands from 1945 to 2002 for ten different regions of the US and for the lower 48 US States. Source: ERS-USDA Major Land Uses (http://www.ers.usda.gov/Data/MajorLandUses/), updated October 19, 2005, accessed December 2, 2005.
Focus on single ecosystem service
Farmland increased in the US until 195011. Since then farmland has declined. Farm specialization has become predominant. This has led to a general decline in landscape diversity with negative consequences for provision of ecosystem services. From 1900 to 2000, the number of commodities produced in the US has decreased from about five to just over one per farm (Fig. 2). Currently >60% of the farms in the US produce only one or two commodities and <14% of farms produce four or more commodities (Table 2). In part, the low average may be due to the inclusion of a large number of retirement and residential/lifestyle farms, which often do not produce any commodities. However, small family farms with high sales, large family farms, and very large family farms, which have the highest average number of commodities per farm, produce fewer than three commodities per farm (Table 2). These farms have more than double the number of commodities compared with limited resource farms. Nearly one-third of limited resource farms specialize in beef cattle production, which generally has low labor requirements (Table 2). Small family farms with high sales, large family farms, and very large family farms may have the economic or labor resources needed to operate multiple commodities. Hoppe and KorbReference Hoppe, Korb, Banker and MacDonald12 also suggested that the tax code might limit commodity diversity on residential/lifestyle farms. These farms can write-off farm losses especially if they are offset by high off-farm income.
Average number of commodities produced on a US farm from 1900 to 2002. Note: the average number of commodities per farm is a simple average of the number of farms producing different commodities (corn, sorghum, wheat, oats, barley, rice, soybeans, peanuts, alfalfa, cotton, tobacco, sugar beets, potatoes, cattle, pigs, sheep, and chickens) divided by the total number of farms. Modified from Dimitri et al. Reference Dimitri, Effland and Conklin7.
Commodity specialization by farm type in 2001.
Source: Hoppe and KorbReference Hoppe, Korb, Banker and MacDonald12.
1 Based on 26 commodities or commodity groups.
2 Includes farms with no production because of drought, other adverse weather, crop, and livestock disease, etc. Also includes farms with all cropland in Conservation Reserve or Wetlands Reserve Programs (CRP and WRP).
* Standard error between 51 and 75% of estimate.
** Standard error between 25 and 50% of estimate.
d, Data suppressed due to insufficient observations.
Farmers want to produce the most marketable and cost effective products. Therefore, they logically choose to produce what they perceive as the most marketable commodity. Actively managing for multiple ecosystem services can substantially reduce agriculture's environmental footprint and can be encouraged with production incentives that reward environmental stewardship. These incentives, whether trade-based or policy-based, must be tailored to work in both developed and developing economies to forestall continued environmental degradation and loss of agricultural sustainabilityReference Robertson and Swinton13. Policies with adequate incentives must be provided for ecosystem services such as clean water and air, plant pollination, disease suppression, habitat development and restoration, and carbon storage.
Increase in farm size
The number of farms in the US has been decreasing since about 1930, with a corresponding increase in farm size (Fig. 3). This trend has been most pronounced for states in the North Central and Southern US. In the Western US, the number of farms has increased slightly since 1970. In 1997, the government's definition of a farm changed. According to the new definition, people living in town whose only farm income was a Conservation Reserve Program (CRP) payment as well as people who owned or stabled at least five horses somewhere on the property were counted as farmers. The change resulted in a 17% increase in farms with less than $10,000 in annual income. Therefore, when examining the five-year window from 1992 to 1997 the number of farms decreased by less than 1%. In the 50-year period between 1940 and 1990, farm size more than doubled and the number of farms decreased 67%Reference Dimitri, Effland and Conklin7. Large, very large and nonfamily farms account for 72% of the value of agricultural production in the US, but make up only 10% of the farmsReference Westerby and Krupa10.
Regional and US average change in farm numbers from 1910 to 2002 and in average farm size from 1945 to 2002. In each graph the x-axis is year, left y-axis is farm number (10,000) and right y-axis is farm size in acres. Solid line is farm number and the dashed line is farm size. Source: NASS, USDA Quick Stats (http://151.121.3.33:8080/QuickStats/PullData_US), accessed December 2, 2005.
Movement toward commercialization
The commercialization of the American farm has been pronounced over the past several years. As farm numbers have decreased and farm size increased, the food processing industry has also been concentrated into fewer commercial operations. The four-firm concentration ratio (i.e., the sales of the four largest firms as a percentage of total sales) in meatpacking increased from 26% in 1972 to 57% in 1997 with similar increases in other processing industries such as poultry slaughter and soybean processingReference Ollinger, Nguyen, Blayney, Chambers and Nelson14. A trend is also developing toward supply-chain consolidationReference Ollinger, Nguyen, Blayney, Chambers and Nelson14. In this type of consolidation, all stages of production, processing and distribution are woven tightly together to ensure reliable, efficient product deliveryReference Drabenstott15. Supply chain consolidation predominates in the poultry industry and is beginning in the pork industry. This consolidation has geographic consequences. This concentration further decouples crop and livestock agriculture by shifting the base of operations from near feed production facilities to areas of lower labor costs and closer to key markets. In the pork industry, for example, real growth has not occurred in the Corn Belt but rather in the Southeastern and in the Southern Great Plains areas of the USReference Drabenstott15.
Commercialization in the US has replaced ownership and farm control by the farmer with that of the investment community. This has restricted the involvement of the farmer in the decision-making process. In the commercialization model, the predominant decision-making criterion has become the economic bottom-line. We can see and understand more fully the intent of commercialized farming by examining its philosophical bent: (1) nature is a resource to be exploited and variation is to be suppressed; (2) natural resources are not valued except when a necessary expense in production is incurred; (3) progress is equivalent to the evolution of larger farms and depopulation of farm communities; (4) progress is measured primarily by increased material consumption; (5) efficiency is measured by looking at the bottom-line economics; and (6) science is an unbiased enterprise driven by natural forces to produce social goodReference Stauber, Hassebrook, Bird, Bultena, Hoiberg, MacCormick, Menanteau-Horta, Bird, Bultena and Gardner16. Certainly, these philosophies are in direct conflict with the development of sustainable agricultural systems. Specifically, we can immediately recognize three areas of concern regarding commercialization of the farming enterprise. First is the ecological concern. Declines in soil productivity, desertification and water pollution, increased scarcity of water, increased and new pests, and rapid global climate change are viewed as negative impacts only if they have a direct cost to the production system. Secondly are the economic and social concerns. These include increased federal regulation, disparate farmer incomes, disappearance of the mid-sized farm, and urban sprawl. Once again, without a direct cost to the production system, or an overriding social consequence, these changes in agricultural systems are not viewed as losses or problems. Finally are the human health concerns. Included here are the overuse of antibiotics in animal production, nitrate and pesticide contamination of water and food, and the release of other toxic residues into our food and fiber supplyReference Gold3. These negative consequences are traditionally handled by reactive rather than proactive approaches.
Genetic engineering
Genetic engineering has become an important technology in US agricultural production. In 2005, 87% of soybean, 79% of cotton and 52% of corn acreage in the US were planted to genetically engineered varieties17. Genetic transformation as well as all agricultural biotechnology patents have increased dramatically since 1975 (Fig. 4) and funding has skyrocketed for projects involving the development of genetically modified organisms. However, consolidation has increased in the biotechnology industry since 1995, following the same trends as for other aspects of agricultural production (Fig. 5).
Number of agricultural biotechnology and genetic transformation patents issued by the US patent office since 1975. Source: http://www.ers.usda.gov/Data/AgBiotechIP/Data/Table02_UtilityPatentsByYearTech.html, accessed December 2, 2005.
Number of agricultural biotechnology patents issued to the ten largest firms since 1975 with adjustment for consolidation. Figure modified from http://www.ers.usda.gov/Data/AgBiotechIP/Gallery/Graphic4.htm, updated August 26, 2004, accessed December 2, 2005.
Genetic engineering has been incorporated into current agricultural systems out of a need to overcome several agricultural issues, including the availability of farming land, climatic change, declining water resources, and growing demand for food, fiber, fuel, industrial products and products based on ‘functional’ plants. In perhaps an overly optimistic push, proponents of genetic engineering promise to conquer world hunger. Genetic engineering is based on a mechanistic worldview, which presumes the world operates a lot like a machine. Biotechnology may give us the ability to build, redesign, repair and replace living things. However, careful evaluation of the application and potential overuse of biotechnology in agriculture raises several concerns. First, the risks may outweigh the benefits. The risks involved in biotechnology are not fully understood. Currently there is no adequate method to predetermine the potential impacts of a released genetically modified organism on the ecosystem. Therefore, a precautionary principle should be applied to assure public safety. A new product should not be approved unless there is strong evidence that it is safe and promises important public benefit. The burden of evidence of safety and effectiveness should be the responsibility of the one seeking approval and not the responsibility of the public. Yet for agriculture to continue, knowledge-based and value-added agriculture must become a reality. Resource conservation becomes the most important issue for the future of agriculture. ‘The possibilities offered by efficiency developments in conventional seed breeding, supported by gene technology and plant genomic research, will improve the prospects of being able to use our limited natural resources to best effect in the 21st century’Reference Kern18.
Global markets
Agricultural producers in the US are competing in an increasingly global marketplace. Compared to producers in the US, producers in other countries may be able to produce agricultural commodities cheaper. For example, foreign soybean production has recently exceeded that of the US Reference Ash19. Even though agricultural exports remain strong and imports are increasing, the overall US agricultural trade balance has decreased since 2001 (Fig. 6).
US agricultural exports, imports and trade balance from 2001 to 2005. Figure modified from data in Table 1 of Brooks and CarterReference Brooks and Carter25.
The expansion of trade and faster information flow through the internet are converging to alter the worldwide farm and food system. The new farm era is fueled by at least five major issuesReference Thiermann20: (1) finance, technology and information are being democratized; (2) the internet has empowered global information dissemination and increased the speed of information dissemination; (3) the basic human desire for a better life has emerged at the root of globalization; (4) an increased role of world governments to become competitive in the global agricultural marketplace by becoming more efficient and offering higher quality service; and (5) opportunities have evolved through international trade to improve consumer health, provide consumer choices and increase producer income.
Changing social structure
The previous trends have led to a fundamental change in the social structure of US agricultural communities. Agriculturalists in the US are aging at an alarming rate. Since 1974 the number of farmers ⩾65 years old has increased and the number of farmers ⩽35 years old has decreased (Fig. 7). In general, farmers are older in the southern states than in other areas (Fig. 8). There are also age differences between principal production enterprises. Hog and pig farmers had the youngest average age (49.2) and sugar cane, hay crop and other crops had the oldest average age (57.5)Reference Allen and Harris21. Capital investment can serve as an effective barrier to new farms and limit the types of new, viable enterprises.
Age demographics for US farmers for the years 1974 and 2002. Figure modified from data in Table 1 of Allen and HarrisReference Allen and Harris21.
Geographic distribution of average US farmer age in 2002. Figure from Map 1 in Allen and HarrisReference Allen and Harris21.
Fewer and fewer young people have an interest or opportunity to be directly employed in production agriculture. This subsequently has led to a movement away from rural environments toward urban centers. Corporate farms are being established throughout the US resulting in a disappearance of the middle-sized farms. The outcome of these combined phenomena is a polarization of the agricultural community.
Future Trends and Challenges in Agriculture
The question now is, ‘What does the future have in store for US agriculture?’ The driving factors for the near future in agriculture have been put in place. Judging from the outcome of past legislation, the US Farm Bill appears to dictate the crops farmers should produce and thereby drives the production practices employed. Ultimately, this leads to competition between farmers and other programs for federal funds. Increased competition for limited federal funds in combination with international trade issues are likely to result in changes to farm programs. The general population is one or more generations removed from farming. Although the public has less direct connection to agricultural production, there is increased demand for a perceived environmental stewardship. Consumers may not be well informed, but they are discerning. This will bring to the forefront such issues as product identity preservation, designer crops, improved quality (especially in relation to health issues), and organic (reduced use of chemical pesticides and fertilizers) production and commercialization of food. These demands for environmental stewardship and food quality characteristics are likely to shape future agricultural policy and to be reflected in the marketplace. Concurrently, producers are looking for additional economic opportunities and are becoming more market astute. This may cause a movement away from standard crop rotations. This will result in an increase in multiple farm enterprises within a single farm operation, farm ownership in different geographical regions, development of other forms of income-generating operations (i.e., hunting, fishing, site-seeing, etc.) and a flexibility in the use of the products they produce. Agricultural production will no longer be focused solely on the food and feed markets, but will include other outlets such as energy and industrial uses. For example, corn and soybean will not only be used as livestock feed, but will also be sold for the generation of biofuels (ethanol and biodiesel). The use of a biofuel crop within an integrated system adds not only to farm diversity but also is of great importance to the rural community. Selling starch (corn or dry peas) or lignocellulosic material (switchgrass or big bluestem) certainly gives the producer an added economic incentive. But, facilities must be developed to manage and use these materials. Thus, the development of a bioenergy program helps enhance the local economy by providing jobs and an increased tax base.
Because of the bimodalization of farm size and wealth, the middle-sized farm is disappearing. In response to these changes, producers are focusing more on controlling perceived risks. Producers are seeking to increase diversity of marketable products and want an array of options for making the best possible decisions.
Future trends of US agriculture can be inferred from the aforementioned driving factors. These trends are based on the assumption that the conditions that have favored the development of commercialized agriculture will continue. Alternative viewpoints argue that to be sustainable, agriculture must adopt a holistic systems approach that works with the environmental constraints of nature rather than against themReference Ikerd22. Ten future trends regarding the future of US agriculture are envisioned: (1) there will be diminishing margins of return and increased volatility of farm incomes; (2) the predominant player in food regulation will no longer be the government, but rather international trade organizations or perhaps other non-government organizations; (3) a movement from farming to agribusiness will continue; (4) land-use issues will become major issues; (5) the US consumer will continue to increase animal protein consumption; (6) the public will be increasingly concerned regarding the methods of production and movement of livestock; (7) many historically rural counties in the US will experience increased urbanization; (8) the public concern regarding food safety will increase; (9) the medicalization of agriculture will continue to increase; (10) new and emerging tastes, markets and opportunities will expandReference Fresco23.
In addition, farms of the future that are owned and run by resident producers will be more diverse, they will exhibit managers who are more innovative and creative, they will be based on stronger notions of economic, environmental, social and political sustainability, and they will contribute more to the well being of the community. Overall, farms of the future will be managed much more intensively. A transition to a sustainable world will depend on our ability to integrate technological, economic, social and political issues of environmental protection and economic developmentReference Weston24. Whether or not commercialized farms become dominant, US agriculture of tomorrow will face at least four major challenges in completing this transition:
1. Competitive pressures. Future farm policies and management scenarios must be developed to minimize conflicts over land use. Ultimately, land-use decisions should be based on providing the greatest need to the community, and ideally, regulatory and incentive systems will help in the valuation of community benefits. If this is not the case, look for the continued failure of US agricultural systems. In addition, because foreign producers may be able to produce some products cheaper than US farmers, producers must be willing to produce products where they have a competitive advantage.
2. Sustainable development. Agriculture in the US will remain viable only if the environment is protected and enhanced. Thus, sustainability will become the central organizing principle for environmental management. Stated more completely, sustainable development is ‘a process of change in which the direction of investment, the orientation of technology, the allocation of resources, and the development and functioning of institutions meet present needs and aspirations without endangering the capacity of natural systems to absorb the effects of human activities, and without compromising the ability of future generations to meet their own needs and aspirations’Reference Brooks and Carter25.
3. Resource conservation. Policies must encourage efficient use of land for maximum benefit of the entire population.
4. Research and development. New and improved products must be developed. This should not be restricted to biotechnology and genomics, but also include social and economic development. Social, economic and environmental information will need to be developed and policies implemented to identify, quantify and harmonize the different and often conflicting priorities within the society.
Principles for Meeting Future Challenges
In the past, American agriculture was focused solely on its ability to produce sufficient food, fuel and fiber to meet national and global demands. While productivity will continue to be a major factor in food production systems, increased societal demands for environmentally sound management, the need for rural community viability and a rapidly changing global marketplace have resulted in the relatively rapid evolution of agricultural systems. Integrated agricultural systems may assist in addressing some of these challenges. However, when helping to design and manage these systems, researchers need to be aware of the external influences that may affect these systems. Ludwig et al. suggested four reasons for overexploitation and frequent collapse of systems that are modified in response to scientific information and consensus, including: (1) wealth or prospect of wealth generates political and social power that is used to drive overexploitation of the system; (2) each system is so unique that comparisons between systems are impossible, therefore one's ability to manipulate the system is hampered and the impact of those manipulations is unpredictable; (3) natural variation masks arising problems and even potential system collapse until it is too late to correct the problem; and (4) assigning causes to past events is problematical, future events are not predicted well, and even well-meaning attempts to exploit the system responsibly may lead to disastrous consequencesReference Ludgwig, Hilborn and Walters26. By considering these factors, perhaps the paralysis that so frequently occurs and prevents proactive adjustments to conserve needed resources can be overcome.
Yet, in the pursuit of sustainable agricultural systems, it would be useful to identify guiding principles by which they may be developed. Ideally, these principles would facilitate the development of sustainable systems without a change of ownership or bankruptcy. These principles should represent ‘fundamental truths’ that are common to all sustainable systems. By analyzing external influences on agricultural systems, a preliminary set of principles for integrated and dynamic agricultural systems is proposed below. These principles are organized into four categories, and are presented as a starting point with the idea that they may be tested and modified.
Economics and economic policies
• Bigger is not necessarily better.
• As farm size goes up, the number of farmers decreases.
• The commercial agricultural model does not lead to sustainability.
• Corporate production contracts result in dependent ‘corporate farm hands’.
• Economic efficiency must be balanced by regional economic concerns. When efficiency losses are not too great, recycling farm income through the local community will strengthen the community, which will in turn strengthen local farms.
Environmental
• Serious consideration of limited natural resources, efficient and judicious use of nonrenewable resources, and care for the environment are critical to the health of the ecosystem and our own well-being.
• Zero waste is an appropriate goal for managed agroecosystems.
• Streamlining processes and reusing materials will result in zero waste.
• Relying increasingly more on renewable resources for energy will reduce or eliminate agricultural dependency on fossil fuels.
• Reducing consumption of animal protein and food in general will relieve the burden on available global resources.
• Managers should adapt farm production to the environment rather than attempt to adapt the environment to farm production practices.
Social and political
• Through the efficient use of space, increased conservation of materials and energy resources, and reduced transportation, sustainable communities can be developed.
• Through more efficient administration and planning, ecological living conditions that are more economically and socially desirable can be developed.
• Consumerism is not sustainable.
• The principle of sustainable agriculture must be included as a component for developing sustainable communities.
• Regional cooperation between farmers and other relevant stakeholders is necessary for sustainable landscape development.
• To value and manage agricultural landscapes for multiple ecological services the integration of ecological and socioeconomic research, policy innovation and public education is required.
Technological
• New technologies can be useful for solving environmental problems while increasing economic productivity.
• For US agriculture to continue along a sustainable path of economic development, further production increases must be generated by technologies that are profitable, environmentally benign and not socially destructive.
• Markets must be developed that value environmental attributes to speed the adoption of ‘sustainable or green technologies’.
• Even when technologies are profitable, barriers to adopting new practices can limit the effectiveness of green technologies.
• Technology should be selected for appropriateness rather than simply for the sake of technology.
• Use of off-farm inputs can be reduced by increasing the level of management.
Summary
Agriculture, as we know it, is destined to undergo remarkable change. The US agricultural community will face many new and difficult challenges in the years to come. The global marketplace is already dictating agricultural policy and subsequent production in the US. New policies need to be developed to encourage the development of integrated-dynamic agricultural systems. These systems can ultimately assist land managers to develop new and improved sustainable land-use strategies to the benefit of generations to come.