Introduction
The main difficulty when handling cumulus–oocyte complexes (COCs) outside the ovarian environment is the identification and selection of competent oocytes for further in vivo or in vitro embryo development. Successful use of biotechnologies such as in vitro maturation (IVM), in vitro fertilization (IVF), cryopreservation of oocytes, and embryonic development depends on the ability to separate oocytes using conditions that allow us to follow their development from those that are destined to degenerate (Opiela and Kątska-Książkiewicz, Reference Opiela and Kątska-Książkiewicz2013; Ashry et al., Reference Ashry, Lee, Mondal, Datta, Folger, Rajput, Zhang, Hemeida and Smith2015).
COCs can be routinely obtained by slicing the ovary surface, resulting in oocytes with heterogeneous diameters, different COC morphology and, possibly, at varying stages of atresia (Catalá et al., Reference Catalá, Izquierdo, Uzbekova, Morató, Roura, Romaguera, Papillier and Paramio2011). Generally, COCs are selected using morphological assessment by observing the numbers and compactness of cumulus cell layers surrounding the oocyte, granulation and homogeneity of the cytoplasm. However, the viability of oocytes selected using these criteria is often inaccurate, making it difficult to distinguish oocytes by developmental competence (Su et al., Reference Su, Wang, Li, Peng, Hua, Li, Quan, Guo and Zhang2012). It has been shown that a portion of morphologically selected oocytes are still in the growth phase and are unable to mature (Alm et al., Reference Alm, Torner, Löhrke, Viergutz, Ghoneim and Kanitz2005).
An alternative method that improves oocyte selection and, therefore, allows the identification of oocytes with greater competence for later development is brilliant cresyl blue (BCB) staining, which has been used in several animal models including rats (Alcoba et al., Reference Alcoba, da Rosa Braga, Sandi-Monroy, Proença, Felix Lopes and de Oliveira2013), swine (Wongsrikeao et al., Reference Wongsrikeao, Otoi, Yamasaki, Agung, Taniguchi, Naoi, Shimizu and Nagai2006), bovine (Alm et al., Reference Alm, Torner, Löhrke, Viergutz, Ghoneim and Kanitz2005) and mice (Wu et al., Reference Wu, Liu, Zhou, Lan, Han, Miao and Tan2007), among others species. Despite the widespread use of this stain, the literature reports some divergent results, pointing to the need to improve the techniques that have already been described (Ghanem et al., Reference Ghanem, Hölker, Rings, Jennen, Tholen, Sirard, Torner, Kanitz, Schellander and Tesfaye2007; Opiela et al., Reference Opiela, Lipiński, Słomski and Kątska-Książkiewicz2010; Su et al., Reference Su, Wang, Li, Peng, Hua, Li, Quan, Guo and Zhang2012; Tabandeh et al., Reference Tabandeh, Golestani, Kafi, Hosseini, Saeb and Sarkoohi2012; Opiela e Kątska-Książkiewicz, Reference Opiela and Kątska-Książkiewicz2013; Lopes et al., Reference Lopes, Marques, Duranti, de Oliveira, Lopes and Rodrigues2015).
The use of BCB staining is noninvasive and measures the activity of the enzyme glucose-6-phosphate dehydrogenase (G6PDH). This enzyme is active in growing oocytes but, in oocytes that have already completed this phase, G6PDH activity declines. It is synthesized within the oocytes during oogenesis, G6PDH is a component of the pentose phosphate cycle that provides ribose phosphate for nucleotide synthesis, and much of the NAPDH is utilized as an electron or hydrogen donor in reductive biosynthetic reactions such as the formation of fatty acids. G6PDH metabolizes and neutralizes the BCB, resulting in colourless oocytes. Therefore, we can infer the level of enzymatic activity of G6PDH and the competence of the oocyte to undergo successful IVM (Alm et al., Reference Alm, Torner, Löhrke, Viergutz, Ghoneim and Kanitz2005, Opiela and Kątska-Książkiewicz, Reference Opiela and Kątska-Książkiewicz2013). Oocytes that have terminated the growth phase, and have low G6PDH enzyme activity, will retain the stain in the cytoplasm and appear blue [classified as BCB(+)]. Oocytes still in the growth phase, having high levels of G6PDH activity, will appear colourless [classified as BCB(−)] (Torner et al., Reference Torner, Ghanem, Ambros, Hölker, Tomek, Phatsara, Alm, Sirard, Kanitz, Schellander and Tesfaye2008, Opiela and Kątska-Książkiewicz, Reference Opiela and Kątska-Książkiewicz2013).
Although some studies have shown the effectiveness of BCB staining for oocyte selection, it is necessary to establish a species-specific protocol including relevant exposure times and specific concentrations (Alm et al., Reference Alm, Torner, Löhrke, Viergutz, Ghoneim and Kanitz2005; Mirshamsi et al., Reference Mirshamsi, KaramiShabankareh, Ahmadi-Hamedani, Soltani, Hajarian and Abdolmohammadi2013; Silva et al., Reference Silva, Rodriguez, Galuppo, Arruda and Rodrigues2013; Santos et al., Reference Santos, Pradieé, Madeira, Pereira, Mion, Mondadori, Vieira, Pegoraro and Lucia2017). Our group, in a previous report, tested different exposure times and different concentrations of BCB staining to select rat cumulus–oocyte complexes for IVM. However, this is the only published work regarding the use of BCB staining for this species. The best exposure time observed was 1 h, but the best concentration was not well established, ranging from 13 to 20 μM. Therefore, it was still necessary to optimize this methodology (Alcoba et al., Reference Alcoba, da Rosa Braga, Sandi-Monroy, Proença, Felix Lopes and de Oliveira2013).
An alternative to increase oocyte survival after vitrification is to improve COC assessment by other methods than morphological evaluation using a stereomicroscope (Hadi et al., Reference Hadi, Wahid, Rosnina, Daliri, Dashtizad, Karamishab, Faizah, Iswadi and Mazni2010). Differences in the maturation stage of oocytes result in different physiological and biophysical properties that affect susceptibility to damage caused by cryopreservation and toxicity of cryoprotectants (Brambillasca et al., Reference Brambillasca, Guglielmo, Coticchio, Mignini Renzini, Dal Canto and Fadini2013). In mature oocytes, the damage observed includes disruption of polymerization chains, abnormal formation of microtubules and actin, and irregular dispersion of chromosomes. In theory, because immature oocyte microtubules are not organized at the meiotic spindle, cryopreservation at this stage might avoid the risk of chromosomal aberrations as the chromatin is protected by the nuclear envelope (Brambillasca et al., Reference Brambillasca, Guglielmo, Coticchio, Mignini Renzini, Dal Canto and Fadini2013). Hadi et al. (Reference Hadi, Wahid, Rosnina, Daliri, Dashtizad, Karamishab, Faizah, Iswadi and Mazni2010) stated that the stage of oocyte development may also play an important role in all in vitro reproduction procedures.
The effects of various vitrification protocols on the cell cycle and the cytoskeleton of immature rat oocytes were observed (Kim et al., Reference Kim, Olsen, Kim and Albertini2014). In this article, the authors used varying conditions of vitrification, including two or four stages of balance and equilibrium and cryoprotectant solutions composed of ethylene glycol, DMSO and human serum albumin (HSA) at varying concentrations. After assessing chromatin integrity, the authors found that a large percentage of vitrified and warmed oocytes tended to exhibit abnormal chromatin condensation, suggesting that vitrification conditions may impair nuclear maturation (Kim et al., Reference Kim, Olsen, Kim and Albertini2014). In another study, experiments in rats used COCs as a research object. Paim et al. (Reference Paim, Gal, Lopes and Oliveira2015) used different cryoprotectants solutions in COCs of Rattus norvegicus and observed the recovery of meiotic and nuclear maturation of gametes after vitrification. Among the groups, the control group (non-vitrified) had higher rates of meiosis resumption and nuclear maturation, in accordance with Kim et al. (Reference Kim, Olsen, Kim and Albertini2014), but among the vitrified groups, those containing hyaluronic acid demonstrated the best rates of meiosis resumption and nuclear maturation. These results corroborated the hypothesis that, for each species, there must be a specific vitrification protocol (Paim et al. Reference Paim, Gal, Lopes and Oliveira2015).
Oocytes or COCs may undergo morphological and functional changes during vitrification, depending on the species, stage of development, and ability to repair damage. Cryopreservation of immature oocytes (during early phases of meiosis) has gained attention, as the plasma membrane of these cells, during this phase of meiosis, has a low permeability coefficient, causing movement of cryoprotectants and water to occur within more acceptable parameters for the cryopreserved cell (Díez et al., Reference Díez, Muñoz, Caamaño and Gómez2012).
The objectives of this work were to determine a protocol for the selection of Rattus norvegicus COCs using the BCB test for in vitro procedures and to evaluate the viability and in vitro developmental capacity of COCs selected by BCB staining after vitrification and in vitro maturation.
Materials and methods
Chemical and reagents
All reagents used in this study were purchased from Sigma Aldrich (St. Louis, MO, USA), unless otherwise indicated in the text. BCB staining reagents used in the experiments were purchased from Sigma Aldrich (catalogue number B-5388). Equine chorionic gonadotropin was used from Folligon® (Intervet International B.V., Boxmeer, The Netherlands). Luteinizing hormone was used from Chorulon® (Intervet International B.V., Boxmeer, The Netherlands) and follicular stimulating hormone from Follitropin®-V (Bioniche Animal Health Canada Inc., Ontario, Canada).
Animals
Fifty-seven female Wistar rats (31 ± 2.1 days old) obtained from the Animal Facility at the Federal University of Rio Grande do Sul (UFRGS, Porto Alegre, Brazil) were used in these experiments. The animals were housed in a vivarium at the UFRGS in standard cages (41 × 34 × 17.8 cm; Beiramar, Campinas, Brazil) with woodchip bedding in a colony room. The animal room was maintained at 22 ± 2°C, 50–57% humidity and on a 12 h/12 h light/dark cycle (lights on at 06:00 h). They were given a commercial pelletized diet (Nuvilab CR1, Nuvital Nutrientes S/A, Colombo, Brazil) and water ad libitum.
Experimental design
This study was conducted in two main experiments. In the first experiment, all COCs were selected by morphological criteria and separated into four groups. COCs used as the control group were matured in vitro immediately. In the other groups, COCs were incubated for 1 h in M16 medium (without phenol red) containing BCB at different concentrations (group 1:13 µM; group 2: 16 µM; and group 3: 20 µM). After the incubation, IVM and parthenogenetic activation were conducted to induce embryonic development. The objective of this experiment was to find the best concentration of BCB for the selection of rat COCs. The range of BCB concentrations was based on the previous work of our group (Alcoba et al., Reference Alcoba, da Rosa Braga, Sandi-Monroy, Proença, Felix Lopes and de Oliveira2013). The effect of BCB was evaluated on in vitro embryo development after parthenogenetic activation. In each repetition of Experiment 1, 10–40 COCs were grouped by treatment. In total, six repetitions were accomplished in Experiment 1. Based on the results of the first experiment, the second experiment was performed using the best concentration of BCB for COC evaluation. The effect of COC selection by BCB and vitrification was evaluated on in vitro embryo development after parthenogenetic activation. COCs were divided into four groups: BCB(+) (blue), BCB(−) (colourless), fresh control (COCs selected by morphological criteria and immediately in vitro matured, without vitrification) and vitrified control (COCs selected by morphological criteria, vitrified, and in vitro matured). In each repetition of Experiment 2, 3–50 COCs were grouped by treatment. In total, five repetitions were accomplished in Experiment 2.
Cumulus–oocyte complex recovery
Females intended for superovulation were treated with 20 UI eCG by intraperitoneal (i.p.) injection. After 48 h, rats were euthanized with isoflurane vapour overdose. Immediately after euthanasia, the ovaries were removed from the abdominal cavity of each female, as described by Alcoba et al. (Reference Alcoba, da Rosa Braga, Sandi-Monroy, Proença, Felix Lopes and de Oliveira2013) and Paim et al. (Reference Paim, Gal, Lopes and Oliveira2015). Briefly, ovaries were maintained at 37°C in modified PBS (mPBS; Whittingham, Reference Whittingham1971) until the moment of scraping. Then, the ovaries were transferred to a plastic Petri dish containing mPBS supplemented with 2% FBS, and the cortexes were sliced using a scalpel blade to release COCs into the medium. After this procedure, Petri dishes containing COCs were analyzed using a stereomicroscope (Meiji EMZ 13TR, Meiji Techno Co, Saitama, Japan) for further morphological selection. COCs containing compact cumulus cells that demonstrated homogeneous ooplasm were selected, as described by Alcoba et al. (Reference Alcoba, da Rosa Braga, Sandi-Monroy, Proença, Felix Lopes and de Oliveira2013) and Paim et al. (Reference Paim, Gal, Lopes and Oliveira2015), and placed in a dish containing manipulation medium (M2; Quinn et al., Reference Quinn, Barros and Whittingham1982). Selected COCs used as control groups in Experiments 1 and 2 were immediately matured in vitro.
BCB staining
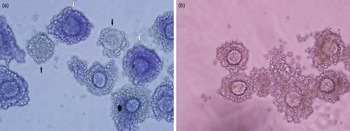
For staining, COCs were incubated in M16 medium (Whittingham, Reference Whittingham1971), without phenol red, containing BCB at different concentrations for each experiment, as mentioned above, at 37ºC with 100% relative humidity under a 5% CO2 atmosphere. After incubation, COCs were examined under a stereomicroscope (EMZ-13TR, Meiji Techno Co., Ltd) at ×50 magnification and were divided into two groups according to oocyte cytoplasm colouration: oocytes that have terminated the growth phase, having low G6PDH enzyme activity, will retain the stain in the cytoplasm and appear blue [classified as BCB(+)], oocytes still in the growth phase, having high levels of G6PDH activity, will appear colourless (classified as BCB(−); Figure 1a). COCs from different cytoplasm staining groups were washed several times in M16 medium to remove any remaining stain and were then submitted to IVM or vitrification, depending on the experiment.
(a) Representative image of rat COCs after incubation with BCB for 1 h. White arrows indicate COCs classified as BCB(+) and black arrows indicate BCB(−) COCs (×400 magnification). (b) Rat cumulus–oocyte complexes from the BCB(+) group after 30 h of IVM in M16 medium supplemented with 10% FBS, FSH and LH (×400 magnification).

Vitrification and warming
Cumulus–oocyte complexes were exposed to an equilibrium solution composed of 2.7 M ethylene glycol (EG) diluted in mPBS and a cryoprotective solution composed of 5.4 M EG, 0.5 M sucrose, and 0.025 M hyaluronic acid diluted in mPBS (Paim et al., Reference Paim, Gal, Lopes and Oliveira2015). For vitrification, after exposure to a cryoprotective solution, COCs were held by capillary action in the tip of a straw with a reduced diameter such as an open pulled straw (OPS; Vajta et al., Reference Vajta, Holm, Kuwayama, Booth, Jacobsen, Greve and Callesen1998) and immediately plunged directly into liquid nitrogen. In total, 5–10 COCs were stored per straw, and were kept in a liquid nitrogen container for 7 days before warming. To produce the OPS, 0.25 ml straws were elongated using a warmed platform. The straws were warmed and pulled manually until the internal diameter and thickness of the central wall decreased to half the size, so the diameter decreased from 1.7 mm to ∼0.8 mm and the thickness decreased from 0.15 mm to ∼0.07 mm. For warming, OPS were removed from the liquid nitrogen container, and kept in the air for 5 s, and the tip of the OPS capillary was placed in a 400-µl microdrop containing mPBS supplemented with 0.5 M sucrose, releasing COCs into the medium. COCs were kept in the medium for 5 min before IVM (Pornwiroon et al., Reference Pornwiroon, Kunathikom, Makemaharn and Huanaraj2006).
In vitro maturation
After washing, COCs were transferred to IVM plates containing 100 µl maturation medium - M16 (Whittingham, Reference Whittingham1971) supplemented with 10% FBS, 0.1 IU luteinizing hormone (LH), and 5 µg/ml follicle-stimulating hormone (FSH), covered with mineral oil. In total, 10–15 COCs were placed in each microdrop, and the plates were maintained in an incubator containing a 5% CO2 atmosphere with 100% humidity at 37°C for 30 h for maturation (Figure 1b).
Parthenogenetic activation and embryonic development
For parthenogenetic activation, COCs were initially exposed to ionomycin calcium salt (5 µM) diluted in mR1ECM medium (Miyoshi et al., Reference Miyoshi, Abeydeera, Okuda and Niwa1995) for 5 min at room temperature. Subsequently, COCs were washed in M2 medium and incubated in 2 mM 6-(dimethylamino)purine (6-DMAP) diluted in mR1ECM for 4 h in an incubator containing a 5% CO2 atmosphere with 100% humidity at 37°C. After incubation, COCs were washed in M2 medium and placed in 100-µl microdrops of mR1ECM for in vitro culture. Cleavage rates were analyzed after 48 h incubation and subsequent morula and blastocyst rates were analyzed during the next 5 days. Here, 10–15 zygotes/embryos were maintained in each microdrop for parthenogenetic activation and in vitro development.
Statistical analysis
Cleavage, morula, and blastocyst rates were analyzed using the chi-squared (χ2) test, supplemented by adjusted residual calculation, when statistical differences were observed. Fisher’s exact test was used to replace the chi-squared test when necessary. Differences were considered significant if the P-value was ≤ 0.05.
Results
Experiment 1
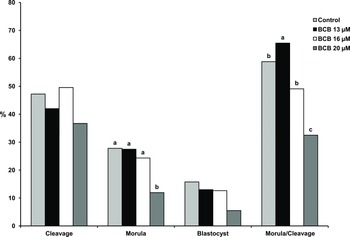
In total, 459 COCs were obtained and used in this experiment, which was repeated six times. Statistically, cleavage rates were similar in the control group and the BCB groups (Table 1; Figure 2). However, morula rates were lower in the 20 µM BCB group compared with the other groups. Blastocyst rates were similar in all groups. When we compared development up to the morula stage from the cleaved embryos, statistically higher rates were observed in the 13 µM BCB group compared with the other BCB groups and even with the control group (Table 1; Figure 2). The percentage of oocytes classified as BCB(−) was similar (P = 0.2512) between COCs exposed to BCB 13 µM (12/143, 8.39%), 16 µM (15/126,11.90%) or 20 µM (19/128, 14.84%). No COCs classified as BCB(−) were able to proceed with in vitro embryonic development. Data regarding embryo development of the control and BCB(+) groups are summarized in Table 1.
Evaluation of parthenogenetic activation and embryo development (from cleavage to blastocyst) after morphological assessment and 1 h of incubation with different concentrations of BCB staining in Rattus norvegicus cumulus–oocyte complexes (COCs)

Note: N = total number of COCs used in each group; n = number of embryos at each stage of embryonic development; % percentage of embryos at each stage of embryonic development; A, B, C values with different superscripts within same column are statistically different (P < 0.05); MA: selected only by morphological assessment; data obtained after six repetitions.
Rat embryo development rates after incubation with different concentrations of BCB, IVM and parthenogenetic activation. Statistically significant differences are indicated by different letters above each bar. The probability values for the comparison of BCB (13, 16 and 20 µM) and control groups were as follows: cleavage, P = 0.220; morula, P = 0.015; blastocyst, P = 0.111; and morula/cleavage, P = 0.011. In the control group, COCs were selected only by morphological assessment.

Experiment 2
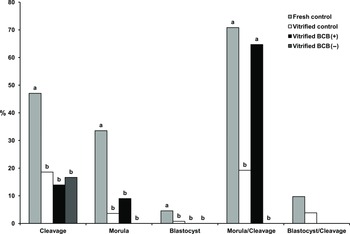
The experiment was repeated five times and, in total, 437 COCs were used. As shown in Table 2 and Figure 3, in the control group (fresh COCs), cleavage, morula, and blastocysts rates were statistically higher than the other groups. However, when we evaluated vitrified BCB(+) and control groups, the development to the morula stage considering cleavage was statistically different (Table 2; Figure 3).
Evaluation of parthenogenetic activation and embryo development (from the first cleavage to blastocyst) after morphological assessment, 13 µM BCB staining incubation and vitrification of Rattus norvegicus cumulus–oocyte complexes

Note: N = total number of COCs used in each group; n = number of embryos at each stage of embryonic development; % percentage of embryos at each stage of embryonic development; A, B, C values with different superscripts within same column are statistically different (P < 0.05); COCs were not submitted to vitrification in fresh control group; In vitrified control group, COCs were selected only by morphological criteria and vitrified with same protocol that BCB(+) and BCB(−) groups; (P < 0.05); data obtained after five repetitions.
Rat embryo development rates after morphological assessment, 13 µM BCB staining incubation and vitrification of COCs. Statistically significant differences are indicated by different letters above each bar. The probability values for the comparison between the experimental groups were as follows: cleavage, P < 0.001; morula, P < 0.001; blastocyst, P = 0.017; morula/cleavage, P < 0.001; and blastocyst/cleavage, P = 0.409. COCs were not submitted to vitrification in fresh control group; In vitrified control group, COCs were selected only by morphological criteria and vitrified with same protocol that BCB(+) and BCB(−) groups.

Discussion
To our knowledge, this is the first study using BCB to test the feasibility of rat COCs undergoing vitrification, IVM, and in vitro embryo development. In an earlier publication by our research group, Alcoba et al. (Reference Alcoba, da Rosa Braga, Sandi-Monroy, Proença, Felix Lopes and de Oliveira2013) tested three concentrations of BCB in immature rat COCs, showing the applicability of BCB staining in this species. However, the ideal concentration for this technique was not elucidated and this would be a restriction for subsequent in vitro embryonic development of the COCs, as only the oocyte maturation capacity was tested (Alcoba et al., Reference Alcoba, da Rosa Braga, Sandi-Monroy, Proença, Felix Lopes and de Oliveira2013). The present work showed that BCB staining could be used to identify rat COCs that were suitable for use in in vitro manipulation techniques, and the best BCB concentration identified was 13 μM, which was superior even to the control group, when the development up to the morula stage was compared from the cleaved embryos.
Several concentrations of BCB have already been tested in different species (Alm et al., Reference Alm, Torner, Löhrke, Viergutz, Ghoneim and Kanitz2005; Wongsrikeao et al., Reference Wongsrikeao, Otoi, Yamasaki, Agung, Taniguchi, Naoi, Shimizu and Nagai2006; Wu et al., Reference Wu, Liu, Zhou, Lan, Han, Miao and Tan2007; Alcoba et al., Reference Alcoba, da Rosa Braga, Sandi-Monroy, Proença, Felix Lopes and de Oliveira2013; Fathi et al., Reference Fathi, Ashry, Salama and Badr2017). It was observed that higher concentrations of BCB caused poor results, as high concentrations of this stain could negatively affect cell viability (Alcoba et al., Reference Alcoba, da Rosa Braga, Sandi-Monroy, Proença, Felix Lopes and de Oliveira2013). This effect was also verified in the first experiment by the results obtained in the 20 μM group, in which the development to the morula stage by cleavage was the lowest compared with other groups. In the same way, Alcoba et al. (Reference Alcoba, da Rosa Braga, Sandi-Monroy, Proença, Felix Lopes and de Oliveira2013) showed that in IVM experiments using rat oocytes, among the tested concentrations, the one with the best accuracy and the highest rate of meiosis resumption was 13 μM, which was similar to our results.
In the second experiment, better developmental rates were observed up to the morula stage, considering the number of embryos cleaved in the BCB(+) group compared with the vitrified control group (only morphological evaluation), in agreement with Hadi et al. (Reference Hadi, Wahid, Rosnina, Daliri, Dashtizad, Karamishab, Faizah, Iswadi and Mazni2010) who exposed bovine oocytes to BCB prior to vitrification and IVM. In this work, the authors demonstrated that nuclear maturation rates of oocytes selected using BCB staining were statistically higher than the vitrified control group. In the present study, the CCOs of the control group, which did not undergo vitrification, presented similar embryonic development until morula from cleaved embryos. Conversely, Hadi et al. (Reference Hadi, Wahid, Rosnina, Daliri, Dashtizad, Karamishab, Faizah, Iswadi and Mazni2010) showed better nuclear maturation rates in their study. It is known that, for successful in vitro development of IVM/IVF to occur, it is necessary for the oocyte to complete nuclear maturation during IVM to undergo normal fertilization (Gandolfi et al., Reference Gandolfi, Brevini, Luciano, Modina, Passoni and Pocar1995). Based on these observations, we can assume that BCB(+) COCs present better quality than those of the control group.
One explanation for the better results of the BCB(+) group was the higher quality of blastocysts produced from COCs selected by BCB stain observed in bovine and goats. COCs selected by BCB stain formed blastocysts with the higher number of total cells, trophectoderm cells (TE), and inner cell mass (ICM) cells, and even the ratio of ICM:TE was significantly higher in BCB(+) blastocysts compared with BCB(−) blastocysts. The total number of blastomeres and the ICM:TE ratio were also significantly higher in the BCB(+) blastocysts than in control blastocysts (Catalá et al., Reference Catalá, Izquierdo, Uzbekova, Morató, Roura, Romaguera, Papillier and Paramio2011; Su et al., Reference Su, Wang, Li, Peng, Hua, Li, Quan, Guo and Zhang2012). Also, the number of apoptotic cells was lower in the BCB(+) blastocysts than in the BCB(−) and control blastocysts (Su et al., Reference Su, Wang, Li, Peng, Hua, Li, Quan, Guo and Zhang2012). Another reason that cannot be ruled out to explain the results of embryonic development up to blastocyst is the subjectivity of the morphological evaluation of COCs (Alcoba et al., Reference Alcoba, da Rosa Braga, Sandi-Monroy, Proença, Felix Lopes and de Oliveira2013).
No CCOs classified as BCB(−) were able to proceed with in vitro embryonic development. But, those classified as BCB(+) reached embryonic development up to the morula stage, considering cleaved embryos, at levels higher than the vitrified control. Low specific activity of the G6PDH enzyme is found in gametes, and gametes classified as BCB(+) express more genes related to protein translation, such as RPL24 (Ghanem et al., Reference Ghanem, Hölker, Rings, Jennen, Tholen, Sirard, Torner, Kanitz, Schellander and Tesfaye2007), as well as growth and follicular development (Tabandeh et al., Reference Tabandeh, Golestani, Kafi, Hosseini, Saeb and Sarkoohi2012) and the control of mitochondrial DNA copies (Opiela et al., Reference Opiela, Lipiński, Słomski and Kątska-Książkiewicz2010). Conversely, gametes classified as BCB(−) express more genes related to follicular atresia (PTTG1) with suppression of follicle growth (MSX1; Ghanem et al., Reference Ghanem, Hölker, Rings, Jennen, Tholen, Sirard, Torner, Kanitz, Schellander and Tesfaye2007), and apoptosis, when compared with their positive counterparts (Su et al., Reference Su, Wang, Li, Peng, Hua, Li, Quan, Guo and Zhang2012). In addition, some transcripts may alter their levels during the maturation process and be influenced by BCB staining (Opiela and Kątska-Książkiewicz, Reference Opiela and Kątska-Książkiewicz2013; Lopes et al., Reference Lopes, Marques, Duranti, de Oliveira, Lopes and Rodrigues2015). Also, blastocysts developed from BCB(+) COC were of better quality than BCB(−) and the control groups. Upregulated expression of SOX2 (a key regulator of pluripotency) and caudal-type homeodomain protein, CDX2 (a marker of the TE lineage) in the BCB(+) blastocysts may be associated with the higher quality of these embryos (Su et al., Reference Su, Wang, Li, Peng, Hua, Li, Quan, Guo and Zhang2012). Also, downregulation of Bax in the BCB(+) blastocysts compared with BCB(−) and control blastocysts can explain the lower apoptotic index and higher development of BCB(+) embryos (Su et al., Reference Su, Wang, Li, Peng, Hua, Li, Quan, Guo and Zhang2012).
Other researchers have already obtained embryonic development to blastocyst from parthenogenetically activated rat oocytes (Galat et al. Reference Galat, Zhou, Taborn, Garton and Iannaccone2007, Hayes et al. Reference Hayes, Galea, Verkuylen, Pera, Morrison, Lacham-Kaplan and Trounson2001, Mizutani et al. Reference Mizutani, Jiang, Mizuno, Tomioka, Shinozawa, Kobayashi, Sasada and Sato2004, Shinozawa et al. Reference Shinozawa, Mizutani, Tomioka, Kawahara, Sasada, Matsumoto and Sato2004, Krivokharchenko et al. Reference Krivokharchenko, Popova, Zaitseva, Vil’ianovich, Ganten and Bader2003, Ailia et al. Reference Ailia, Jin, Kim and Jang2021). However, all these reports were obtained with COCs collected from the oviduct of rat females after hCG application. In our experiments, COCs were used after eCG application and direct removal of the ovary. Taketsuru and Kaneko (Reference Taketsuru and Kaneko2016) collected COCs after eCG application and direct removal of the ovary and obtained early embryonic development results after parthenogenetic activation, similar to our experiments.
During our experiments, we observed that, after vitrification and warming, a subset of COCs lost the cumulus cells that surrounded them (observed in COCs of all vitrified groups) and this may have impaired their ability to resume meiosis and proceed with embryonic development. Communication between cumulus and oocyte cells occurs via a type of gap junction, which is very important for maturation, fertilization, and subsequent embryonic development (Tanghe et al., Reference Tanghe, Van Soom, Nauwynck, Coryn and de Kruif2002; Rienzi et al., Reference Rienzi, Balaban, Ebner and Mandelbaum2012). The lack of these cells may have resulted in low blastocyst development rates after vitrification in our experiments (Rienzi et al., Reference Rienzi, Balaban, Ebner and Mandelbaum2012; Fujiwara et al., Reference Fujiwara, Kamoshita, Kato, Ito and Kashiwazaki2017). Low levels of development up to the blastocyst stage may be related to the premature initiation of meiosis observed in vitrified COCs (Kim et al., Reference Kim, Olsen, Kim and Albertini2014).
The effects of vitrification may appear only after fertilization and embryonic development, and this has not been observed in studies on oocyte maturation after vitrification (Kim et al., Reference Kim, Olsen, Kim and Albertini2014; Paim et al., Reference Paim, Gal, Lopes and Oliveira2015). It has been suggested that the vitrification process, including exposure to cryoprotectants and low temperatures, may cause the loss of coordination between nuclear and cytoplasmic maturation (Van Blerkom, Reference Van Blerkom1989). Several changes observed in important components required for cytoplasmic and nuclear maturation have indicated that undesired effects occur during the vitrification process (Kim et al., Reference Kim, Olsen, Kim and Albertini2014).
The toxicity of BCB on COCs and embryos is a controversial theme (Opiela and Kątska-Książkiewicz, Reference Opiela and Kątska-Książkiewicz2013). Some researchers have reported that, apparently, BCB does not affect the viability of oocytes and embryos exposed (Alm et al., Reference Alm, Torner, Löhrke, Viergutz, Ghoneim and Kanitz2005; Torner et al., Reference Torner, Ghanem, Ambros, Hölker, Tomek, Phatsara, Alm, Sirard, Kanitz, Schellander and Tesfaye2008; Santos et al., Reference Santos, Pradieé, Madeira, Pereira, Mion, Mondadori, Vieira, Pegoraro and Lucia2017). The safety of the use of BCB staining can be inferred through the observation of normal morphology of blastocysts developed from exposed oocytes, as demonstrated in our study and by other authors indicating that, at some concentrations, BCB had no negative effect on embryonic development (Alm et al., Reference Alm, Torner, Löhrke, Viergutz, Ghoneim and Kanitz2005; Su et al., Reference Su, Wang, Li, Peng, Hua, Li, Quan, Guo and Zhang2012; Mirshamsi et al., Reference Mirshamsi, KaramiShabankareh, Ahmadi-Hamedani, Soltani, Hajarian and Abdolmohammadi2013). Conversely, harmful effects were detected depending on the BCB concentration used in human cumulus cells and porcine oocytes. One of these studies demonstrated that incubation for 1 h with 13 μM BCB did not affect cell viability, but higher concentrations (20 and 26 μM) could affect the viability of human cumulus cells cultivated in vitro (Alcoba et al., Reference Alcoba, Conzatti, Ferreira, Pimentel, Kussler, Capp, von Eye Corleta and Brum2016). In another study, BCB staining (13 μM and 1 h of incubation) did not cause any negative impact on important molecular pathways, and not change the protein content and membrane stability of human cumulus cells (Alcoba et al., Reference Alcoba, Schneider, Arruda, Martiny, Capp, von Eye Corleta and Brum2017). Experiments using porcine oocytes showed that double exposure to BCB dye (13 μM and 1 h of incubation) could significantly affect the levels of transcripts and proteins responsible for the fertilizing capacity of oocytes (Kempisty et al., Reference Kempisty, Jackowska, Piotrowska, Antosik, Woźna, Bukowska, Brüssow and Jaśkowski2011). It has also been observed that mitochondrial function and redox status can be affected in porcine oocytes subjected to BCB staining (Santos et al., Reference Santos, Sato, Lucia and Iwata2015). Furthermore, in experiments performed by our group, it was observed that higher BCB concentrations presented many false positives, perhaps because the G6PDH enzyme is unable to metabolize all of the BCB dye when used at high concentrations (20 and 26 μM; Alcoba et al., Reference Alcoba, da Rosa Braga, Sandi-Monroy, Proença, Felix Lopes and de Oliveira2013). Despite the knowledge of the interaction between the BCB and the G6PDH enzyme, the biochemical basis of this stain metabolism has not been fully established. It has been suggested that BCB exhibits an electron acceptor role during glucose oxidation in bovine oocytes (Alm et al., Reference Alm, Torner, Löhrke, Viergutz, Ghoneim and Kanitz2005). However, possible detrimental effects of BCB on rat oocytes have not been reported.
The results observed in the vitrified BCB(+) group were equal to the control not vitrified group and were superior to the control vitrified group regarding morula development from cleaved embryos. Among the BCB(+) oocytes, those that underwent cleavage were more successful at embryonic development. Some authors have already demonstrated that selection by morphological criteria in conjunction with BCB staining might be better than morphological selection only, as demonstrated by Silva et al. (Reference Silva, Rodriguez, Galuppo, Arruda and Rodrigues2013), wherein the development up to the blastocyst stage was higher in the BCB(+) group compared with the control and BCB(−) groups. Similar results were also found by Su et al. (Reference Su, Wang, Li, Peng, Hua, Li, Quan, Guo and Zhang2012), wherein in vitro development of cloned bovine embryos was superior in the BCB(+) group compared with the control group. Furthermore, Mirshamsi et al. (Reference Mirshamsi, KaramiShabankareh, Ahmadi-Hamedani, Soltani, Hajarian and Abdolmohammadi2013) compared the embryonic development of cattle oocytes and zygotes selected by BCB and reported a higher blastocyst development rate in the BCB(+) oocyte group compared with the other groups (Su et al., Reference Su, Wang, Li, Peng, Hua, Li, Quan, Guo and Zhang2012; Mirshamsi et al., Reference Mirshamsi, KaramiShabankareh, Ahmadi-Hamedani, Soltani, Hajarian and Abdolmohammadi2013; Silva et al., Reference Silva, Rodriguez, Galuppo, Arruda and Rodrigues2013).
The results of our experiment indicated that additional incubation of rat COCs in 1 h microdroplets in medium with 13 μM BCB maintains viability after in vitro maturation, vitrification, and parthenogenetic activation at levels similar to or even higher than morphological evaluation alone. The BCB(+) vitrified group demonstrated that development to the morula stage, taking into consideration cleaved embryos, was superior to the other vitrified groups including the vitrified control.
There have been few reports in the literature using BCB and vitrification of rat COC, demonstrating the importance of our study that provides data from these two poorly studied subjects. Further studies on the effect of the BCB test on rat embryos generated by IVF and their gene expression are suggested.
Financial support
This research did not receive any specific grant from funding agencies in the public, commercial, or not-for-profit sectors.
Competing interests
All authors declare that they have no conflicts of interest.
Ethical standards
All experimental protocols were approved by the Animal Care Committee of UFRGS, Porto Alegre, Brazil) through the approval 29.990/16. Furthermore, all animal experiments were conducted in strict accordance with the recommendations of the International Animal Guide for the Care and Use of Laboratory Animals, and according to Brazilian law no. 11794/2008 for animal experiments.