INTRODUCTION
Many neurodevelopmental disorders are associated with motor deficits (Dewey, Reference Dewey2004), which may involve impairments in motor execution, motor regulation, or both. For the most part, investigations of neurodevelopmental disorders have focused on describing the range and extent of motor execution deficits. Less attention has been paid to motor regulation processes, including short-duration timing and rhythm, which generate smooth, temporally regular, and well-coordinated movements.
Motor Regulation and the Cerebellum: Timing and Rhythm
Historically, the role of the cerebellum in movement concerned motor regulation rather than motor execution. For Gall and colleagues (Combe, trans. Reference Combe, Gall, Vimont and Broussais1804/1838), the cerebellum was “the balancer and regulator of locomotive movements” (p. 113), “an organ for the regularity of locomotive movements separate from the organ of these movements themselves” (p. 119). Holmes (Reference Holmes1939) described the motor deficits following cerebellar damage as involving disturbances of timing and rhythm: “a lack of synchronicity in the separate components of the movement” (p. 17); “a delay in the initiation of one component relative to another” (p. 18); and “in actions requiring reversal of direction there is the slower rate and the lack of rhythm” (p. 19).
Current views of the cerebellum specify that learned movement is regulated through timing and rhythm. As a result of experience, the cerebellum creates internal sensory motor representations that predict the consequences of motor plans or control the motor plans needed for a desired sensory outcome (Iacoboni, Reference Iacoboni2001). The cerebellum feeds forward sensory information prior to movement to improve movement accuracy, and also regulates the quality of movement through temporally specific motor learning (Mauk et al., Reference Mauk, Medina, Nores and Ohyama2000).
Analyses of music performance have highlighted the importance of timing and rhythm for the production of the precise hierarchically-organized movements involved in skilled performance (Zatorre et al., Reference Zatorre, Chen and Penhune2007). More generally in the motor domain, skillful performance of sequential movements is often rhythmic (Sakai et al., Reference Sakai, Hikosaka and Nakamura2004). As motor sequences are learned through temporally specific processes, a stereotyped pattern or rhythm emerges because the sequence is reorganized during learning as serial chunks of movement in both a sequence-specific and a subject-specific manner. This motor rhythm allows for the control of automatic movements within chunks and non-automatic movements between chunks, allowing motor execution to move smoothly between discontinuous and continuous performance (Sakai et al., Reference Sakai, Hikosaka and Nakamura2004).
Patients with cerebellar degeneration have difficulty performing rhythmic movements (Schlerf et al., Reference Schlerf, Spencer, Zelaznik and Ivry2007). Cerebellar lesions and their classical symptoms (ataxia and dysmetria) represent the execution of movements without the calibrating benefits of previous experience accumulated through learning and emergent rhythm patterns (Mauk et al., Reference Mauk, Medina, Nores and Ohyama2000).
Timing
Timing is an essential component of movement (Ivry & Richardson, Reference Ivry and Richardson2002). Braitenberg (Reference Braitenberg1967) suggested that the parallel fibers in the cerebellar cortex act as a delay system to provide timed signals. More recently, Ivry (Reference Ivry1996) proposed that the cerebellum includes a central timer. The cerebellum is important for the short-duration (~400 ms) timing that synchronizes sensation and movement and encodes the sensory consequences of motor acts. Timing deficits are evident in adults with acquired cerebellar lesions (Ivry & Keele, Reference Ivry and Keele1989; Ivry et al., Reference Ivry, Keele and Diener1988), in children with congenital disorders of the cerebellum such as ataxia-telangiectasia (Mostofsky et al., Reference Mostofsky, Kunze, Cutting, Lederman and Denckla2000), and in adult survivors of childhood acquired cerebellar tumors (Hetherington et al., Reference Hetherington, Dennis and Spiegler2000). The timing deficits are not a generalized perceptual impairment because individuals with cerebellar lesions are able to discriminate frequency (around 3000 Hz) even when they cannot discriminate duration (Hetherington et al., Reference Hetherington, Dennis and Spiegler2000). Timing deficits involve both motor and perceptual timing; that is, individuals with cerebellar lesions not only have poor temporal regulation of movement, but also show impaired perception of short-duration timing (Ivry, Reference Ivry, Tallal, Galaburda, Llinas and Von Euler1993, Reference Ivry1996).
Rhythm
Rhythm concerns the perception of subjective accents and their distribution in time, and is defined by temporal properties within a music phrase such as tone duration (Krumhansl, Reference Krumhansl2000) and durations between onsets of consecutive tones (Griffiths, Reference Griffiths2001), with the latter determining the perception of rhythm (Krumhansl, Reference Krumhansl2000). The perception of rhythm differs according to the type of rhythm and the strength of its metrical structure. A rhythm’s metrical structure is established by temporal information that creates the perception of strong (accented or stressed) and weak beats (unaccented or unstressed) (Zatorre et al., Reference Zatorre, Chen and Penhune2007) that occur at regularly spaced intervals (Handel, Reference Handel1989).
Rhythmic patterns are superimposed on this metrical structure, such that a rhythm whose strong accents coincide with the strong positions of the metrical structure is unsyncopated or “on the beat,” whereas a rhythm whose accented or strong events are placed at weak positions in the underlying metrical structure is syncopated or “off the beat” (Fitch & Rosenfeld, Reference Fitch and Rosenfeld2007). Mental representations of rhythm coincide with this formal description, and differ according to their metrical structure. Sequences organized around a beat are easier to perceive and reproduce (Essens & Povel, Reference Essens and Povel1985; Povel & Essens, Reference Povel and Essens1985). In short, the induction of a strong-meter depends on synchrony between beats and subjective accents, which are distributed regularly in time. The induction of a weak-meter depends on an asynchrony between beats and subjective accents, which are distributed irregularly in time.
Strong-meter rhythms are coded as structured forms, where each time interval is equal and metrically related to one another (Povel & Essens, Reference Povel and Essens1985). Weak-meter rhythms are encoded as a chain of independent, unrelated values and, because the rhythms remain unstructured, are cognitively demanding to maintain in working memory. Strong-meter rhythms have smaller integer ratios between event onsets, such as 1:2, 1:3, or 1:4. Weak-meter rhythms have larger or non-integer ratios, such as 1:2.5 or 1:3.5 (Essens, Reference Essens1986; Povel & Essens, Reference Povel and Essens1985). The duration of events in sequences reproduced from weak-meter rhythms are distorted toward strong-meter ratios of 1:2, 1:3, or 1:4 (Drake & Gérard, Reference Drake and Gérard1989): When instructed to recall a weak-meter or syncopated rhythm, normal individuals recode it toward a strong-meter or less syncopated form (Fitch & Rosenfeld, Reference Fitch and Rosenfeld2007), a process that seems to be automatic and obligatory (Sakai et al., Reference Sakai, Hikosaka and Nakamura2004).
Strong meters are easier than weak meters to discriminate, remember, and reproduce, which suggests that their mental representations are more stable. Rhythms with strong meters are perceived more accurately than those with weak meters (Essens, Reference Essens1986; Essens & Povel, Reference Essens and Povel1985; Sakai et al., Reference Sakai, Hikosaka, Miyauchi, Takino, Tamada, Iwatam and Nielsen1999), and it is easier to detect subtle temporal disruptions to strong-meter rhythms than it is to detect identical disruptions to weak-meter rhythms (Hébert & Cuddy, Reference Hébert and Cuddy2002). Both musicians and non-musicians show evidence of an advantage for strong meters over weak meters (Hébert & Cuddy, Reference Hébert and Cuddy2002).
The distinction between strong-meter and weak-meter rhythms has a neural basis as well as a behavioral one. Different neural substrates subserve the processing of structured and unstructured rhythms. Maintenance of a structured rhythm is associated with activity in the premotor area of the cerebellar anterior lobe, whereas maintenance of an unstructured rhythm is associated with activity in the prefrontal cortex and cerebellar posterior lobe (Sakai et al., Reference Sakai, Hikosaka, Miyauchi, Takino, Tamada, Iwatam and Nielsen1999).
Congenital Cerebellar Malformations in Spina Bifida Meningomyelocele
Cerebellar malformations and dysmorphology (Barkovich, Reference Barkovich1995) define the most common disabling neural tube defect, spina bifida meningomyelocele (SBM) (Martin et al., Reference Martin, Hamilton, Sutton, Ventura, Menacker and Kirmeyer2006). Incidence rates have been relatively stable since 1999, following a decline from 1995 to 1999 attributed to mandatory dietary fortification with folic acid (Williams et al., Reference Williams, Rasmussen, Flores, Kirby and Edmonds2005). SBM involves developmental failure of both ends of the neural tube, spinal cord, and brain.
The defining spinal lesion is evident from the first weeks of gestation, and requires neurosurgical repair shortly after birth, with subsequent major orthopedic and urologic impairments, including paraplegia of the lower limbs and neurogenic bladder and bowel function (Charney, Reference Charney, Batshaw and Perret1992). The most common congenital brain anomaly in SBM is the Chiari II malformation (Barkovich, Reference Barkovich2000), a deformity of the brain stem and cerebellum that occurs in virtually all births involving meningomyelocele. The result is a mechanical block to the flow of cerebrospinal fluid (CSF), which in turn leads to hydrocephalus that almost always requires diversionary shunting (Charney, Reference Charney, Batshaw and Perret1992). Many individuals with SBM have abnormalities of the brain stem, such as beaking of the tectum. Secondary central nervous system anomalies in the corpus callosum and posterior cortex occur in response to the primary abnormalities and hydrocephalus associated with the Chiari II malformation. Difficulties regulating CSF because of shunt malfunctions and infections, or other complications associated with SBM (e.g., seizures), produce secondary brain injury.
The Chiari II malformation includes a small posterior fossa, which results in distortion of the posterior fossa contents and their herniation through the tentorial incisure and foramen magnum. The cerebellar dysmorphology in SBM is selective. Although the cerebellum is smaller than that of controls, the volume reduction is seen mainly in the cerebellar hemispheres (Fletcher et al., Reference Fletcher, Copeland, Frederick, Blaser, Kramer, Northrup, Hannay, Brandt, Francis, Villarreal, Drake, Laurent, Townsend, Inwood, Boudousquie and Dennis2005). Posterior fossa size and cerebellar weight and volume are reduced, and the mean vermis area is significantly larger (Salman et al., Reference Salman, Blaser, Sharpe and Dennis2006a).
Motor Execution and Motor Regulation in SBM
Movement disorders represent a fundamental deficit in children with SBM. Infants with SBM have poorer upper and lower limb movement quality than normal peers, and they are slower than peers to learn to move their arm to activate a mobile (Fletcher et al., Reference Fletcher, Dennis, Northrup, Barnes, Hannay, Landry, Copeland, Blaser, Kramer, Brandt, Francis and Glidden2004). Fine motor execution deficits in childhood (Wills, Reference Wills1993) include difficulty drawing objects and shapes, putting beads on a rod, threading a nut and a bolt, and putting beads in a box (Fletcher et al., Reference Fletcher, Dennis, Northrup, Yeates, Ris and Taylor2000; Grimm, Reference Grimm1976; Hetherington & Dennis, Reference Hetherington and Dennis1999). Children with SBM have deficits in three effectors: upper and lower limbs (Dennis et al., Reference Dennis, Fletcher, Rogers, Hetherington and Francis2002; Hetherington & Dennis, Reference Hetherington and Dennis1999) and eyes (Biglan, Reference Biglan1995; Salman et al., Reference Salman, Sharpe, Lillakas, Steinbach and Dennis2007). Movement variability is related to the integrity of brain regions such as the cerebellum that controls truncal and axial movement (Miall & Reckess, Reference Miall and Reckess2002), and the cerebellum and midbrain that control eye movements (Leigh & Zee, Reference Leigh and Zee1999).
Motor learning in SBM
Children with SBM have intact motor learning. They adapt to weight biasing and to prismatic adaptation (Colvin et al., Reference Colvin, Yeates, Enrile and Coury2003). They learn new motor tasks by hand (mirror drawing; Edelstein et al., Reference Edelstein, Dennis, Copeland, Frederick, Francis, Hetherington, Brandt and Fletcher2004), arm (elbow goniometer adaptation to gain change; Dennis et al., Reference Dennis, Jewell, Edelstein, Brandt, Hetherington, Blaser and Fletcher2006), and eye (saccadic adaptation; Salman et al., Reference Salman, Sharpe, Eizenman, Lillakas, To, Westall, Steinbach and Dennis2005, Reference Salman, Sharpe, Eizenman, Lillakas, To, Westall, Steinbach and Dennis2006b).
Timing in SBM
Children with SBM have short-duration timing deficits, exhibiting higher psychophysical thresholds than controls on a task requiring them to discriminate intervals around 400 ms (Dennis et al., Reference Dennis, Edelstein, Hetherington, Copeland, Frederick, Blaser, Kramer, Drake, Brandt and Fletcher2004). The timing deficits do not represent a general auditory perceptual impairment because the same children who cannot discriminate duration are readily able to discriminate frequency (around 3000 Hz) in a similar psychophysical paradigm (Dennis et al., Reference Dennis, Edelstein, Hetherington, Copeland, Frederick, Blaser, Kramer, Drake, Brandt and Fletcher2004).
Rhythm in SBM
Individuals with SBM show impaired production of entrained rhythms. Although they can tap in synchrony with a rhythmic, computer-generated tone sequence, they are unable to maintain the isochronous tapping after the tone sequence stops (Dennis et al., Reference Dennis, Edelstein, Hetherington, Copeland, Frederick, Blaser, Kramer, Drake, Brandt and Fletcher2004). When the variance is decomposed into clock variance (associated with timing) and motor variance (associated with the movement implementation), what distinguishes the SBM group from controls is timing, not motor variance (Dennis et al., Reference Dennis, Edelstein, Hetherington, Copeland, Frederick, Blaser, Kramer, Drake, Brandt and Fletcher2004). Children and adults with SBM also show motor speech deficits that involve disordered speech rate and rhythm (Huber et al., Reference Huber, Dennis, Brettschneider and Spiegler2002).
The Present Study
Rhythm discrimination in the cerebellum involves both the basic processing of “new” or “novel” rhythms and the entrainment of rhythms so that they become automatized or familiar. Rhythm discrimination is easier for strong-meter rhythms and more difficult for weak-meter rhythms. Children with SBM: (1) have significant reductions in overall and lateral cerebellar volumes (Fletcher et al., Reference Fletcher, Copeland, Frederick, Blaser, Kramer, Northrup, Hannay, Brandt, Francis, Villarreal, Drake, Laurent, Townsend, Inwood, Boudousquie and Dennis2005; Salman et al., Reference Salman, Blaser, Sharpe and Dennis2006a), and the cerebellum is an important node in rhythm processing (Sakai et al., Reference Sakai, Hikosaka, Miyauchi, Takino, Tamada, Iwatam and Nielsen1999); (2) have difficulty with the perception of short-duration time intervals, although not with frequency discrimination (Dennis et al., Reference Dennis, Edelstein, Hetherington, Copeland, Frederick, Blaser, Kramer, Drake, Brandt and Fletcher2004); and (3) fail to entrain rhythms on motor tapping tasks, even though they can tap along with a computer-generated rhythmic pattern (Dennis et al., Reference Dennis, Edelstein, Hetherington, Copeland, Frederick, Blaser, Kramer, Drake, Brandt and Fletcher2004). In brief, children with SBM can perform fine auditory discrimination tasks and tap rhythmically to non-entrained rhythms, but have difficulty with temporal structure and the entrainment of motor rhythms. Here, we investigated perception of strong- and weak-meter rhythms in children with SBM and in typically developing age-matched controls. Based on the previous findings, we predicted an interaction between group and metric structure, such that differences between SBM and controls would be smaller on the weak-meter rhythms than on the strong-meter rhythms. We hypothesized that children with SBM would have greater difficulty in taking advantage of the strong-meter rhythms.
METHOD
Participants
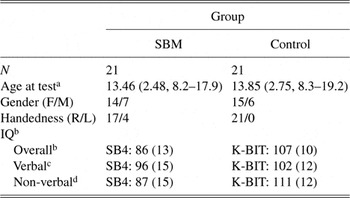
Participants were 42 children and adolescents 8–19 years of age. Twenty-one had been diagnosed at birth with SBM and were recruited from an ongoing National Institutes of Health (NIH) project on the neurobiological outcomes of spina bifida. Inclusion criteria for all participants included a minimum Full Scale Intelligence Quotient (IQ) score of 70. As evident in Table 1, the SBM group had a Full Scale IQ score within 1 standard deviation (SD) (15) of the population mean of 100, and a verbal IQ score within one-third of 1 SD of the population mean of 100 on a standard intelligence test (Stanford-Binet Intelligence Scale: Fourth Edition; Thorndike et al., Reference Thorndike, Hagen and Sattler1986). Nineteen of the children had a lower (lumbar) spinal cord lesion and 2 had an upper (thoracic) spinal cord lesion. Sixteen of the 21 participants had experienced a shunt revision. Twenty-one typically developing children served as pairwise controls matched on the basis of age (within 4 months). Controls had no previous or current neurological difficulties (e.g., no previous head injuries requiring hospitalization, no diagnosed psychiatric condition or developmental disorder), and were recruited from advertisements through the hospital. Audiometric screening confirmed that no child had a hearing impairment. Demographic information is provided in Table 1. This study was conducted in compliance with the Hospital for Sick Children’s Research Ethics Board guidelines and approval.
Demographic information

Note
SB4, Stanford-Binet Intelligence Scale: Fourth Edition; K-BIT, Kaufman Brief Intelligence Test.
a Years and decimal months. Values are means, SD, and range.
b For SBM group, IQ test = SB4 (Thorndike et al., Reference Thorndike, Hagen and Sattler1986); for control group, IQ test = K-BIT (Kaufman & Kaufman, Reference Kaufman and Kaufman1990). Values are means (SD).
c For SBM group, Vocabulary; for control group, Vocabulary.
d For SBM group, Pattern Analysis; for control group, Matrices.
Stimuli
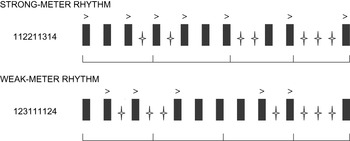
The strong- and weak-meter rhythms were the same as those used by Hébert and Cuddy (Reference Hébert and Cuddy2002), which in turn were based on Povel and Essens (Reference Povel and Essens1985) (see examples in Figure 1). They were created for this study using SoundEdit 16, version 2.0 software. An interval was defined as the onset-to-onset duration between successive events, all of which were identical (the sound of a snare drum). The intervals varied in a 1:2:3:4 ratio. Each unit of duration was 200 ms, as in Povel and Essens (Reference Povel and Essens1985). Thus, interval 1 was 200 ms, and intervals 2, 3, and 4 were 400, 600, and 800 ms, respectively. Each “standard” rhythm had a different permutation of the same set of nine different intervals (111112234). All tones had the same intensity without any physical accents (other than their subjective accents). For strong-meter rhythms, onsets of longer intervals occurred on the beat, such that the underlying meter was salient. For weak-meter rhythms, onsets of longer intervals occurred off the beat, making it difficult to generate the meter.
Examples of strong- and weak-meter rhythms. In total, 20 sequences of beat intervals were administered to participants with one example from each rhythmic sequence being represented here. The black vertical rectangular bars are the temporal pattern of beat intervals (with sounds of a snare drum). The duration of each bar is represented in the numbers on the left side (e.g., 1, 2, 3, and 4 = 200, 400, 600, and 800 ms, respectively). The stars in between the bars represent silent gaps between the intervals of 200 ms each. The arrows on top of the bars are the subjective accents. The lines with bars underneath the sequences represent the regular distribution of time (i.e., beat). Strong-meter rhythm sequences have accented tones that are regularly distributed in time and synchronized with subjective accents. Weak-meter rhythm sequences are temporally irregular and asynchronous with subjective accents. The subjective accents fall on the beat in the strong-meter sequence and off the beat in the weak-meter sequence.

Procedure
The strong-meter and weak-meter tasks both consisted of 10 practice trials (5 same and 5 different patterns) and 20 test trials (10 same and 10 different patterns). Both tasks were administered individually using a laptop computer with external speakers. The trials were presented randomly for each participant using a customized program created with PsyScope software (Cohen et al., Reference Cohen, MacWhinney, Flatt and Provost1993).
On each trial, participants heard two patterns, a standard pattern and a comparison pattern. On “same” trials, the standard and comparison patterns were identical. On “different” trials, the comparison differed from the standard because one inter-onset interval of 400 ms (interval 2) had been doubled in duration. On each trial, participants compared the two drum patterns and judged whether they were the “same” or “different”. They were instructed to respond by clicking on “same” or “different” response options illustrated on the computer screen. After the participant responded, feedback (“correct” or “incorrect”) appeared on the screen for 2 s. Trials were self-paced.
RESULTS
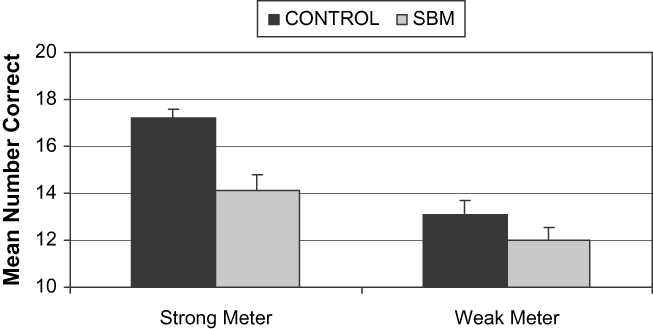
Mean number of correct items for strong-meter and weak-meter rhythms per group are presented in Figure 2. All analyses were conducted using matched pairs. One sample t test confirmed that performance for both groups was significantly better than chance in both rhythm conditions. Simple effects of the meter manipulation showed that both groups performed better on strong meters than on weak meters [SBM: t(1, 20) = 2.4, p = .02; control: t(1, 20) = 5.9, p = .01]. Scores on the strong-meter and weak-meter rhythms were analyzed with a two-way repeated measures analysis of variance, with group (SBM and controls) and rhythm (strong and weak) as repeated measures. The main effect of group was significant, F(1, 20) = 14.50, p = .01, as was the main effect of meter (strong vs. weak), F(1, 20) = 25.54, p = .01, and the interaction between group and meter, F(1, 20) = 5.55, p = .02. As predicted, the groups did not differ on the weak-meter rhythms, t(1, 20) = 1.53, p = .14, but there was a significant difference on the strong-meter rhythms, t(1, 20) = 4.24, p = .01, with the control group performing better than the SBM group. In brief, the advantage for strong meters was attenuated in the SBM group compared to controls. Performance on the strong-meter and weak-meter rhythms was not significantly correlated in either the SBM (r = .08, p = .74) or the control (r = .31, p = .12) group.
Mean number of correct items for strong-meter and weak-meter rhythms for control and SBM groups. Error bars represent 1 standard error (SE). Range of performance for strong-meter rhythms: for SBM = 8–20; controls = 9–20, and range of performance for weak-meter rhythms: for SBM = 7–18; controls = 9–19. Between-group analyses revealed that groups differed significantly on strong-meter rhythms (p = .01), but did not differ on weak-meter rhythms (p = .14). Within-group analyses showed that both SBM (p = .02) and control (p = .01) groups performed better on strong-meter rhythms than on weak-meter rhythms.

DISCUSSION
Children with SBM discriminated strong-meter rhythms less accurately than controls. The two groups performed similarly on weak-meter rhythms. The attenuated advantage for strong meters in children with SBM indicates that they were unable to exploit fully the implied beat in the strong-meter condition.
Healthy adults are able to reproduce entrained rhythms on tapping tasks (Repp, Reference Repp2005). Elementary school children 5–7 years of age can also reproduce rhythmic sequences with a regular beat and binary subdivisions of the beat (Drake, Reference Drake1993). At a perceptual level, adults show a strong-meter advantage, being better able to reproduce and perceive strong-meter compared to weak-meter rhythms (Essens & Povel, Reference Essens and Povel1985). The typically developing children in the present study also performed better on the strong-meter rhythms than on the weak-meter rhythms, confirming that the strong-meter advantage evident in adults extends to school-aged children. Although 2-month-olds are able to detect slight changes in the tempo of isochronous sequences (Drake & Bertrand, Reference Drake and Bertrand2001), it remains unclear whether children younger than our youngest participants (8-year-olds) would exhibit a similar advantage for strong meters on the present task.
Children with SBM are as accurate as controls in making auditory interval discriminations on a task requiring them to judge frequency (pitch) (Dennis et al., Reference Dennis, Edelstein, Hetherington, Copeland, Frederick, Blaser, Kramer, Drake, Brandt and Fletcher2004), and a general auditory perceptual deficit would not account for the Group × Meter interaction. The SBM group had verbal IQ scores close to the population mean; performed as well as controls on weak-meter rhythms; and performed at above-chance levels in both conditions. Although it is difficult to interpret the results in terms of a generalized cognitive impairment, further research is needed to determine the specificity of these deficits.
Cognitive factors such as working memory are likely to contribute to performance on the strong-meter and weak-meter rhythm tasks. The SBM and control groups are relatively similar on the weak-meter task. While the strong-meter condition should in theory reduce working memory demands, it may not do so in the same manner for the SBM and control groups. Alternatively, the SBM group’s failure to entrain rhythms at both a perceptual and a motor level (Dennis et al., Reference Dennis, Edelstein, Hetherington, Copeland, Frederick, Blaser, Kramer, Drake, Brandt and Fletcher2004) may be a cause, rather than an effect, of working memory challenges on the strong-meter task. The issue of causal relations between the working memory and the rhythm task remains to be understood.
The cerebellum exhibits little age-based functional plasticity for rhythm and timing. Rhythm deficits are associated with cerebellar anomalies, whether congenital, as in SBM, or degenerative (Schlerf et al., Reference Schlerf, Spencer, Zelaznik and Ivry2007). Timing deficits are evident in children with congenital cerebellar malformations like SBM or ataxia-telangiectasia (Mostofsky et al., Reference Mostofsky, Kunze, Cutting, Lederman and Denckla2000), in adult survivors of childhood acquired cerebellar tumors (Hetherington et al., Reference Hetherington, Dennis and Spiegler2000), and in adults with acquired cerebellar disorders (Ivry & Keele, Reference Ivry and Keele1989).
The association between cerebellar damage and rhythm perception is somewhat specific for both children and adults, in that cerebellar anomalies appear to affect the ability to capitalize on hierarchical structure inherent in strong-meter rhythms. The behavioral data are congruent with findings indicating that regional activation of the cerebellum is associated selectively with discrimination of strong- and weak-meter rhythms (Sakai et al., Reference Sakai, Hikosaka, Miyauchi, Takino, Tamada, Iwatam and Nielsen1999).
The role of within-group neurobiological variation in rhythm task performance remains to be explored. Spinal lesion level has been associated with poor motor and cognitive performance in a number of SBM studies (e.g., Fletcher et al., Reference Fletcher, Copeland, Frederick, Blaser, Kramer, Northrup, Hannay, Brandt, Francis, Villarreal, Drake, Laurent, Townsend, Inwood, Boudousquie and Dennis2005), but this source of variability could not be explored in the present study because of the relatively small sample size and paucity of upper spinal lesions. Upper spinal lesions in SBM are associated with poorer rhythmic tapping, although not with poorer time perception (Dennis et al., Reference Dennis, Edelstein, Hetherington, Copeland, Frederick, Blaser, Kramer, Drake, Brandt and Fletcher2004). Shunt revisions are unrelated to perceptual timing in individuals with SBM (Dennis et al., Reference Dennis, Edelstein, Hetherington, Copeland, Frederick, Blaser, Kramer, Drake, Brandt and Fletcher2004), but whether they are related to rhythm discrimination remains to be studied. We could not investigate variations in cerebellar dysmorphology, which have been associated with short-duration perceptual timing (Dennis et al., Reference Dennis, Edelstein, Hetherington, Copeland, Frederick, Blaser, Kramer, Drake, Brandt and Fletcher2004). The significance of spinal lesion level, shunt history, and variations in cerebellar dysmorphology are important areas for future investigation.
The impetus for the present study was the report of cerebellar involvement in strong-meter and weak-meter rhythm discrimination and the presence of cerebellar abnormalities in SBM. However, supratentorial brain structures are also important for rhythm (e.g., Penhune et al., Reference Penhune, Zatorre and Feindel1999; Zatorre et al., Reference Zatorre, Chen and Penhune2007). Future research should investigate the role of supratentorial brain regions in the rhythm performance of individuals with neurodevelopmental disorders, such as SBM.
Maintenance of an unstructured rhythm in working memory is associated not only with cerebellar posterior lobe activity but also with activity in the prefrontal cortex (Sakai et al., Reference Sakai, Hikosaka, Miyauchi, Takino, Tamada, Iwatam and Nielsen1999). When considered jointly with the behavioral data showing greater cognitive demands of weak rhythms, the data suggest that perceiving weak-meter rhythms might engage a top-down controlled neural system that includes the prefrontal cortex. When individuals are presented with an unstructured rhythm (or asked to perform a syncopated movement) but reproduce it as a structured rhythm (or a synchronized movement), brain activation shifts from cognitive- to motor-related areas and from controlled to automatic timing processes (Jantzen et al., Reference Jantzen, Steinberg and Kelso2004; Sakai et al., Reference Sakai, Hikosaka and Nakamura2004).
Everyday motor activities involve the perception and induction of strong-meter rhythm. Many smoothly executed movements are the result of rhythmic entrainment and the establishment of the relative timing of movements.
Children with SBM can move and learn motor skills, but their movements are dysrhythmic. In addition to having disorders of timing and rhythm production, the present results indicate that these disorders operate at the level of perception. Dennis et al. (Reference Dennis, Edelstein, Hetherington, Copeland, Frederick, Blaser, Kramer, Drake, Brandt and Fletcher2004) suggested that timing deficits in SBM produce a temporal disconnection between sensation and movement, and an asynchrony in feed-forward processes important for receiving the sensory consequences of motor acts. Failures of timing and rhythm may limit the modulation of motor learning, so that, while children with SBM will learn discrete motor acts, they will fail to automatize them into smooth and predictive motor acts. This hypothesis is consistent with the proposal that the organization of musical rhythm is associated with the accurate timing of movements (Zatorre et al., Reference Zatorre, Chen and Penhune2007).
Our data show that not only adult lesions of the cerebellum but also congenital cerebellar malformations are associated with disorders of rhythm. The fact that children with SBM exhibit perceptual as well as motor rhythm deficits suggests a central processing disruption of the brain mechanisms for rhythm, which may involve deficient timing and rhythm generators that produce problems in movement regulation.
ACKNOWLEDGMENTS
The research in this article was supported by grants from the U.S. NIH Program Project Grant P01 HD35946, and by the Natural Sciences and Engineering Research Council of Canada. The research was submitted to the University of Toronto in partial fulfillment of the degree of Master of Arts for the first author. Portions of these data were presented at the Meeting of the International Neuropsychological Society, 2003. The authors have disclosed any and all financial or other relationships that could be interpreted as a conflict of interest affecting this manuscript.