To what extent is income concentration affected by industrialization, globalization, regime change, or the expansion of the welfare state? Do we observe a more egalitarian income distribution in the aftermath of wars as destroyers of capital? Or is it the introduction of progressive income taxation, collective bargaining, and increased union power that radically reduces top capital incomes? German data provide the unique possibility to study the evolution and drivers of income concentration at the top between 1871 and 2014.
Germany’s turbulent history allows us to investigate factors that may explain up and downswings in top income shares over five distinct eras: (1) The period of the German economy’s evolution from a rural economy to one of the world’s most advanced industrial economies; (2) The era of the Weimar Republic from 1919 to 1932, when employers’ organizations met unions’ substantial wage demands, dampening social class struggles (Kocka Reference Kocka1978, p. 137); (3) The Nazi period, beginning in 1933, which saw an extraordinary rise in profits among business owners while wages stagnated; (4) The Golden Age of post-war Germany, when the economy expanded at high growth rates, unemployment was low, and governments introduced generous redistributive policies; and finally, (5) The post-reunification period, when the German wealth tax was abolished, top tax rates were reduced, trade unions weakened, and the country became the world champion in exports.
This article provides the first long-run top income share series for Germany covering 1871 to 2014. I revisit and substantially revise previous research by Siegfried Geisenberger and Heinz Müller (1971) for the pre-WWI period and Fabien Dell (Reference Dell2005, Reference Dell, Atkinson and Piketty2007) for the period of 1891 to 1998. My principal finding is that income concentration today is not substantially different from 1871, when Germany achieved political unification: The income share of the top 10 percent is about 40 percent. However, inequality at the very top (top 1 percent and 0.1 percent incomes) appears to be lower nowadays than it was in 1871. Nevertheless, since 1871, income inequality in Germany experienced violent swings. The first period, the industrialization period, was accompanied by a steady increase in the top percentile’s income share up to the start of WWI.Footnote 1 Top incomes dramatically declined during the hyperinflation years of the 1920s in the second period, but increased again rapidly throughout the Nazi period beginning in the 1930s in the third period. In the fourth period, after WWII, top income shares returned to the levels of the 1920s. During the fifth period after unification, Germany caught up to the United Kingdom’s and the United States’ elevated levels of inequality.
The dramatic increase of the top percentile’s income share in the United Kingdom and the United States has revived interest in the evolution of top incomes. Since the seminal contribution of Thomas Piketty (Reference Piketty2001, Reference Piketty2003), a succession of studies seek to construct top income share series over the twentieth century for countries around the world.Footnote 2 These studies use income tax statistics to measure the concentration of income within the uppermost part of the distribution. Since most countries introduced modern income tax systems at the beginning of the twentieth century, these series can be constructed for a time span of about 100 years for most countries. Following this literature, I estimate the share of total gross market income accruing to top groups, such as the top 1 percent, using income tax statistics and the Pareto interpolation technique.
My series improves on previous research in three ways. First, I obtain separate series from Prussia, Saxony, and six other German states, which are then merged to produce a German series that extends from unification in 1871 to the end of WWI in 1918. In contrast, Dell’s (Reference Dell2005, Reference Dell, Atkinson and Piketty2007) series for pre-WWI Germany is restricted to Prussia from 1891 to 1918, thus excluding about 40 percent of the German population and overestimating German top incomes, as many of the super-rich of that time lived in Prussia, which was, at the time, undergoing rapid industrialization.Footnote 3 Second, my new estimates show a larger drop in top income shares in the post-WWII period than the series by Dell (Reference Dell, Atkinson and Piketty2007). Third, I obtain results through 2014 that point to an increase in top income shares relative to 1998, when Dell’s (Reference Dell2005, Reference Dell, Atkinson and Piketty2007) dataset ends. Results appearing in Piketty (Reference Piketty and Zucman2014), which update Dell’s dataset to 2010, understate this increase, as they miss tax law changes that require additional adjustments. Together, my findings revise results in Dell (Reference Dell, Atkinson and Piketty2007) and Piketty (Reference Piketty and Zucman2014) that otherwise suggest a secular fall in German inequality. Undertaking the necessary corrections and extending the period of observation, this downward trend disappears.
Germany has had much economic and political turbulence. One might think turbulence would lead to lasting swings in inequality, but it has remained surprisingly stable over time. The top decile’s income share was 40 percent in 1913 and in 2013. The income share of the top 0.01 percent was about 2 percent of income throughout the entire period. Business income was the most important income source at the top of the distribution during the Nazi regime, in the post-war period, and in unified Germany. Only since the 1980s, increasing numbers of top wage earners have risen to the top. Christian Dustmann, Johannes Ludsteck, and Uta Schönberg (Reference Dustmann, Ludsteck and Schönberg2009) document the increase in wage inequality in Germany since the 1980s. However, wages still comprised less than a tenth of the top 0.01 percent income in the 2000s.Footnote 4 This stands in contrast to findings for the United States, where the working rich gradually replaced rentiers over the course of the twentieth century, with the top 0.01 percent generating half of their income from wages by the 2000s (Saez Reference Saez2005). However, the share of capital income in total income has increased since the 2000s (Piketty, Saez, and Zucman Reference Piketty, Saez and Zucman2018).
My analysis of explanatory factors reveals that the capital share in national income is strongly positively correlated with the top percentile’s income share throughout all periods. Economic growth reveals a negative correlation throughout all periods, but is pro-rich in recent decades. Technological change measured by patent applications is positively correlated with income concentration both in the period of industrialization and in recent decades. Whereas trade was negatively associated with the top percentile’s income share in the period of industrialization, during the post-reunification period it tended to enrich the German elite. The recent increase in top incomes has been accompanied by a decline of both average tax rates in the top percentile and union density.
One should note that top income share series based on income tax statistics suffer from crucial limitations. First, top income shares document income concentration at the top and do not capture changing inequality elsewhere in the distribution. Second, income tax data contain gross income before taxes, neglecting the redistributive role of the government. Frequent changes in the tax legislation modifying the definition of taxable income pose a challenge to creating homogenous series. The introduction of dual income taxation with a separate withholding tax on dividends and interest in Germany in 2009 is a recent example: since then, dividends and interest income are no longer systematically recorded in income tax data. I devote special effort to correcting for such changes, for example, by imputing dividend and interest income after 2009 as described in Charlotte Bartels and Katharina Jenderny (Reference Bartels and Jenderny2015). In addition, if tax avoidance and tax evasion change over time, we might obtain biased results. Finally, our top fiscal income shares by definition exclude the part of national income that is not captured by income taxation, which is approximately 10 percent of national income.
A new line of research aims to distribute the full national income, as documented by internationally standardized national accounts, in order to measure inequality before and after government intervention across the entire population. Piketty, Emmanuel Saez, and Gabriel Zucman (Reference Piketty, Saez and Zucman2018) and Bertrand Garbinti, Jonathan Goupille-Lebret, and Piketty (Reference Piketty, Saez and Zucman2018) are the first two attempts to construct such distributional national accounts (DINA) series for the United States and France, respectively. Individual tax records are the main building block of these DINA series. These data are then supplemented with low-income individuals from survey data. In a final step, national income, tax, and transfer components are distributed across the synthetic distribution in order to obtain the inequality of pre-and post-tax national income. Income tax micro-files became available in 1962 for the United States and in 1970 for France, but only in 1992 for Germany. The aim of this article is to provide a consistent long-run top income share series based on income tax data for Germany, which can serve as the central building block for DINA inequality measures for the entire distribution in Germany in future work.
The article is organized as follows: The first section briefly describes the method used to construct top income shares and provides details on the data employed. The next section discusses the new top income share series 1871–2014 followed by a section that discusses underlying forces behind the changing income concentration. The final section concludes.
DATA AND METHODOLOGY
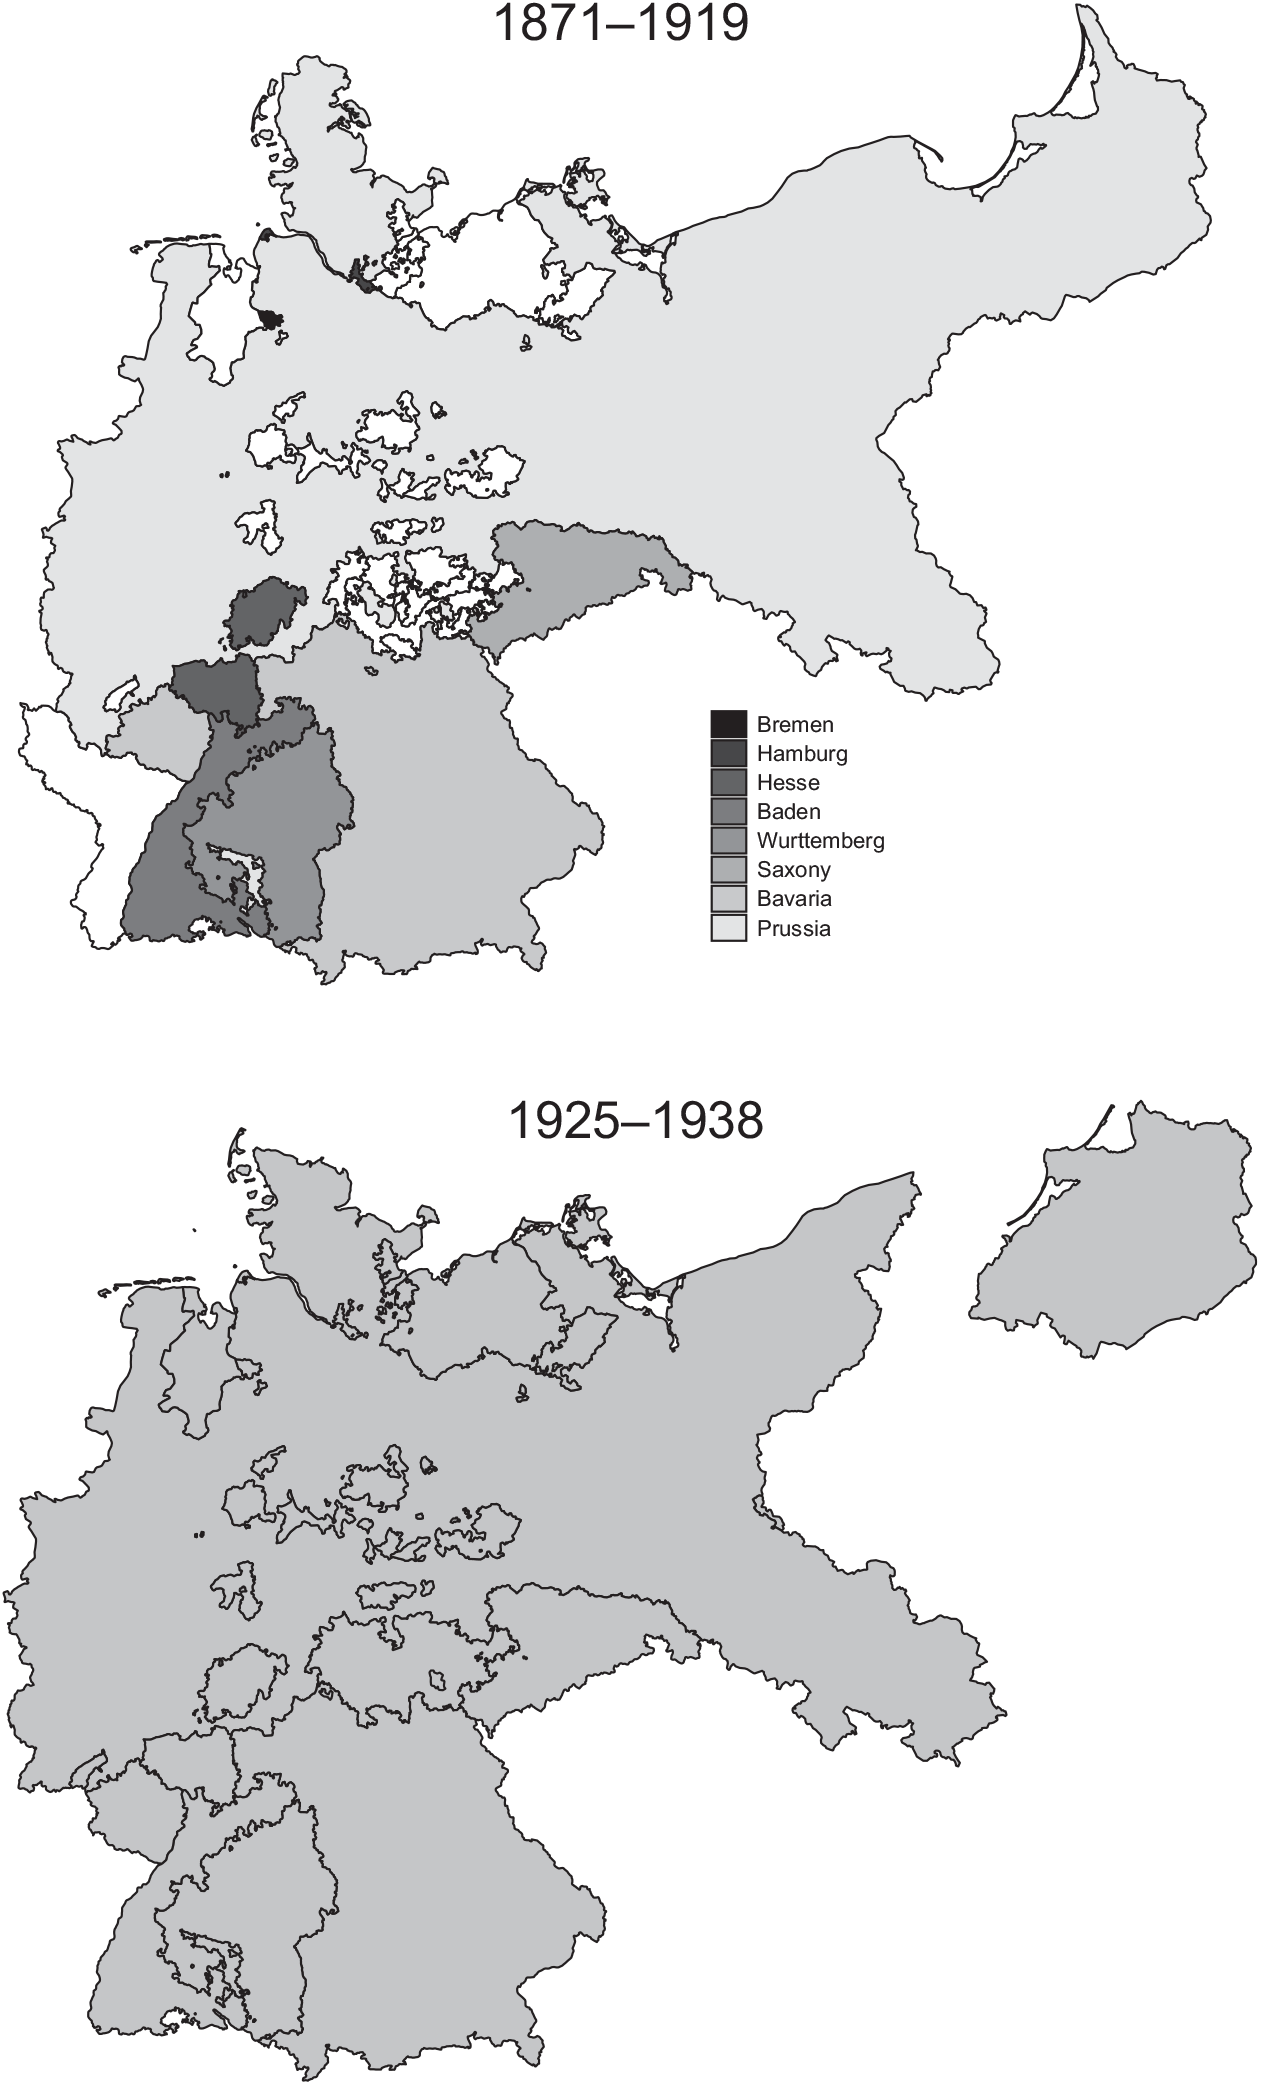
Income tax statistics are used as the main data source to estimate top income shares. Incomes recorded in tax statistics include wages, business income, and capital income, but exclude most sorts of capital gains.Footnote 5 The series covers Germany as defined by the prevailing borders of the respective period of time.Footnote 6 Over the course of the nineteenth century, German states successively introduced a modern income tax system, in which the level of taxation depended on the income of the household or individual: in 1869 in Hesse, in 1874 in Bremen, in 1874 in Saxony, in 1881 in Hamburg, in 1884 in Baden, in 1891 in Prussia, in 1905 in Württemberg, and in 1912 in Bavaria. At the same time, the statistical offices of these states began publishing tabulations showing the number of taxpayers per income bracket and aggregated taxable income per income bracket. In total, 27 income tax systems were introduced in the 39 German states, but only the aforementioned states regularly published tax statistics. In Prussia, income taxation for top income earners was introduced in 1851. However, the coexistence of income taxation for some and consumption taxation for all citizens in bigger cities makes it more difficult to estimate top income shares before 1874. In 1874, the consumption tax was abolished and income taxation was extended to the entire population (see Online Appendix Section A for details on Prussian income tax regimes). I use income tax statistics from eight German states that combined account for 90 percent of the German population in 1871 and cover almost the entire territory of the newly founded German Reich, as illustrated by Figure 1.Footnote 7 I merge these eight series into a single German series covering the period from 1871 to 1918. Online Appendix Table B.1 provides a list of the sources by state and year. Online Appendix Section E describes the merging procedure for the German series.
GERMAN TERRITORY COVERED BY THE SERIES, 1871–1938

Although a nationwide income tax was introduced in Germany in 1920, between 1919 and 1924, the statistical office did not compile income tax statistics. During the period of hyperinflation in 1923 and 1924, income tax legislation was temporarily suspended. From 1925 to 1938, income tax statistics cover a different territory than before WWI, excluding the provinces of Poznan (part of West Prussia), Katowice (part of Silesia), Alsace-Lorraine, and north of Flensburg (part of Schleswig-Holstein), which was lost following the war. From 1936 to 1938, income tax statistics again included Saarland, which was occupied and governed by the United Kingdom and France under a League of Nations’ mandate from 1920 to 1935. In 1938, income tax statistics included Austria after its annexation by Nazi Germany.
The sweeping tax reform of 1920 also introduced a payroll withholding tax. This payroll tax abolished the obligation to file a tax return for large fractions of the population for whom wages were the only income source. Consequently, the bottom half of the top decile (P90-95) was no longer covered by the income tax statistics. Thus, the top decile income share cannot be computed from income tax statistics from this period. Payroll tax and income tax statistics cannot be merged ex post for two reasons. First, the tax units are sorted according to different income concepts (wages versus overall income). Second, payroll tax statistics treat the individual as the tax unit and income tax statistics treat the household as the tax unit. However, the German statistical office published synthetic tabulations of both income and payroll tax statistics for 1926, 1928, 1932, 1934, 1936, and 1950, which I use to estimate top income shares in these years. I can estimate the top percentile’s share between 1925 and 1960, a period for which only income tax statistics are available. Online Appendix Figure A.2 shows that income tax tabulations produce almost identical results for the top percentile, but underestimate the share of the top decile. In 1961, the statistical office began publishing statistics that include both payroll tax and income tax in one table.
From 1949 to 1989, income tax statistics covered the territory of the Federal Republic of Germany (FRG). Hence, the approximately 18 million Germans living in the German Democratic Republic (GDR), comprising one-fifth of the German population in 1950, are excluded. On the other hand, about seven million people fled from the former eastern territories of the German Reich (Silesia, Pomerania, and East Prussia) to the FRG between the end of WWII and 1950. After 1960, the statistics include West Berlin and Saarland. Saarland joined the FRG in 1957. In 1990, Germany was unified, increasing the number of taxpayers by four million and the number of non-filers by five million.
Grouped income tax statistics provide the number of taxpayers between two income thresholds and their respective aggregate income. As the population share of the number of taxpayers above a threshold mostly does not coincide with the top income group that we are interested in, such as the top 1 percent, thresholds and average incomes are estimated using the Pareto interpolation method. This method is commonly used in the top income share literature since the seminal contributions of Piketty (Reference Piketty2001, Reference Piketty and Saez2003). It is assumed that top incomes above the Pareto threshold k follow the Pareto distribution:
 $$ F(y) = 1 - {(y/k)^{ - b/(b - 1)}}\quad \forall y \ge k $$
The Pareto parameter b is obtained by dividing the average income above a certain income threshold documented in the tax statistics by the respective income threshold. Different Pareto parameters are obtained for different fractiles. For instance, to compute the Pareto parameter for the top 1 percent, I first identify the income bracket in which the top 1 percent starts and then take the lowest income threshold of that income bracket. Empirically, b varies slightly across the top fractiles, which contradicts the basic property of the Pareto distribution that b is a constant. Empirically, however, the Pareto interpolation method provides an extremely good fit when comparing results to those obtained directly from individual tax records, where we can obtain the total income of a fractile by simply adding up individual incomes.Footnote 8 Rearranging Equation (1) and using the estimated b, I can compute the income threshold of the top x percent. The income share of the top x percent is then obtained by dividing the cumulative income above the income threshold by an external reference total income as follows.
 $$\matrix{
{{\rm{Income}}{\mkern 1mu} {\rm{share}}{\mkern 1mu} {\rm{of}}{\mkern 1mu} {\rm{top}}{\mkern 1mu} {\rm{x}}\% = {\rm{b}} \cdot {\rm{income}}{\mkern 1mu} {\rm{threshold}}{\mkern 1mu} {\rm{of}}{\mkern 1mu} {\rm{top}}{\mkern 1mu} {\rm{x}}\% } \hfill \cr
{\quad \quad \cdot {{{\rm{x}}\% {\mkern 1mu} {\rm{of}}{\mkern 1mu} {\rm{total}}{\mkern 1mu} {\rm{tax}}{\mkern 1mu} {\rm{units}}} \over {{\rm{total}}{\mkern 1mu} {\rm{income}}}}} \hfill \cr } $$]]
</tex-math>
</alternatives>
</disp-formula></p>
<p>Online Appendix Tables A.1 and A.2 show estimated average incomes and thresholds. As can be seen from Equation (2), the total number of tax units and the total income are crucial for determining the income share of a fractile. The total number of tax units is constructed according to the bottom-up approach for the period 1871–1918 and according to the top-down approach from 1925 onwards. The bottom-up approach adds the (estimated) number of tax-exempt to the number of taxpayers documented in the income tax statistics. The top-down approach draws on official population statistics and obtains total tax units as the sum of the number of married couples and singles minus the number of children. The sources and methods used to construct the reference total tax units are described in the Online Appendix, Section C. For the computation of reference total income, I also adopt a bottom-up approach for the 1871–1918 period and a top-down approach from 1925 onwards. The bottom-up approach adds (estimated) income of tax-exempt individuals to taxpayers’ income as documented in the income tax statistics. The top-down approach draws on national accounts and obtains the reference total income as a fixed share of private household income. Sources and the construction of the reference total income are described in the Online Appendix, Section D. Following Piketty and Saez (<xref ref-type="bibr" rid="r3">2007</xref>), incomes are Pareto-imputed where only the number of taxpayers per income bracket is available.</p>
</sec>
<sec id="s2">
<title>TRENDS IN TOP INCOME SHARES</title>
<sec id="s2-1">
<title>Top Income Shares in Germany, 1871–2014</title>
<p>We now turn to the top income share series for Germany from the foundation of the German Reich in 1871 until 2014. Figure <xref ref-type="fig" rid="f2">2</xref> shows how the top decile’s and top percentile’s shares developed over time. Five periods should be distinguished, over which the German territory, the population living in this territory, and the political system changed quite radically. The industrialization period of the German Reich (1), from 1871 to 1918, was characterized by high and increasing top income shares. During the Weimar Republic from 1925 to 1933 (2), inequality was low, but it increased sharply after the Nazis came to power in 1933 (3). Over the post-WWII period from 1949 to 1989 (4), the top decile’s income share increased relatively steadily after reaching a low point in 1950. The top percentile’s income share quickly recovered from the slump immediately after WWII. Over most of the post-war period, their income share was even higher than it was in the 1920s, which was very different from the situation in many other industrialized countries at that time. German reunification in 1990 (5) initially resulted in a decrease in top income shares, but by the mid-2000s, the top decile’s share surpassed pre-WWI levels, and the top percentile’s share surpassed post-WWII levels.</p>
<p><fig id="f2" position="float">
<label>Figure 2</label>
<caption><p>THE TOP 10 PERCENT AND 1 PERCENT INCOME SHARES IN GERMANY, 1871–2014</p></caption>
<graphic xlink:type="simple" mime-subtype="gif" xlink:href="S0022050719000378_fig2" mimetype="image"/>
<attrib><italic>Source</italic>: Own calculations based on income tax data (Bartels <xref ref-type="bibr" rid="r12">2019</xref>).</attrib>
</fig></p>
<p>As most types of capital gains were tax-exempt in Germany throughout our period of investigation, I focus on the series including capital gains. I can exclude capital gains in the years for which income tax microdata are available, such that capital gains can be separated from other sources of income. <xref ref-type="fig" rid="f2">Figure 2</xref> shows that excluding capital gains does not greatly reduce the top decile’s or the top percentile’s income share.</p>
<p>In order to shed light on the distribution of income within the top decile, <xref ref-type="fig" rid="f3">Figure 3</xref> displays the income share of the bottom half of the top decile (P90-95), the next 4 percent (P95-99), and the top 1 percent. Before 1918, most changes within the top decile were driven by changes in the top percentile. Although the top 1 percent makes up a small share of the population, it captures about a sixth of total income before WWI and a seventh throughout the second half of the twentieth century. In the following, each period is discussed separately.</p>
<p><fig id="f3" position="float">
<label>Figure 3</label>
<caption><p>The Income Shares of Fractiles P90-95, P95-99 and P99-100, 1871–2014</p></caption>
<graphic xlink:type="simple" mime-subtype="gif" xlink:href="S0022050719000378_fig3" mimetype="image"/>
<attrib>
<italic>Source</italic>: Own calculations based on income tax data (Bartels <xref ref-type="bibr" rid="r12">2019</xref>).</attrib>
</fig></p>
<p>The industrialization period from 1871 to 1918 marks a phase of moderately increasing income concentration at the top in Germany, which is discussed in the section on top income shares in German states, 1871–1918. The top percentile in Germany benefitted over-proportionately from the period of industrialization, whereas the bottom 9 percent of the top decile merely kept up with overall income growth. The top percentile’s income share increased from 16 percent in 1871 to 18 percent in 1913. In contrast, the income share of the bottom half (P90-95) stagnated at about 9 percent and the next 4 percent (P95-99) even lost out relative to the other fractiles.<xref ref-type="fn" rid="fn9"><sup>9</sup></xref></p>
<p>During WWI, the top percentile’s income share increased sharply from 18 percent in 1914 to 23 percent in 1917 and then dropped to 20 percent in 1918. High business profits in the armaments industry and, more generally, businesses benefitting from the particular demands of a war economy are behind the rise in income concentration during the war (Preussisches Statistisches Landesamt (ed.) <xref ref-type="bibr" rid="r67">1920</xref>, p. 71). Income shares of all top fractiles dropped in 1918 compared to the preceding years, as inflationary income growth disproportionately boosted middle incomes, but not below the pre-war levels of the industrialization period. World War I did not act as the great leveler in Germany, but rather exacerbated tensions between workers, business owners, and the government. The November Revolution of 1918 sought to reverse the inequality increase, that resulted from the large-scale redistribution from labor to capital during WWI according to Kocka (<xref ref-type="bibr" rid="r52">1978</xref>, p. 136). Albrecht Ritschl (<xref ref-type="bibr" rid="r72">2005</xref>, p. 55) challenges this view arguing that “there is no such thing as redistribution towards capital during WWI in Germany.” He computes the share of wages in industrial output and finds that the distributional position of labor deteriorated for war-related and intermediate industries, but not for civilian industries. However, this analysis of the functional income distribution of industrial output neglects the increasingly important role of war bonds earning high interest income, which rich private investors bought on a large scale (Hardach <xref ref-type="bibr" rid="r38">2017</xref>).</p>
<p>A comparison of the merged German series covering 90 percent of the German population with the Prussian series covering 60 percent (see Online Appendix Figure F.7) reveals that if one relies exclusively on Prussian data, as in Dell (<xref ref-type="bibr" rid="r18">2007</xref>), one would underestimate the income share of the top decile, but overestimate the share of the top 0.01 percent. Before WWI, most German top income earners were in Prussia.<xref ref-type="fn" rid="fn10"><sup>10</sup></xref></p>
<p>The second period covers the Weimar Republic years,<xref ref-type="fn" rid="fn11"><sup>11</sup></xref> from 1919 to 1933. The income share of the top percentile fell by almost half to 11 percent in the 1920s and remained virtually stable until 1933. Over this period, governing parties changed frequently, depending on the support of the elites, but also on the voting masses. This created a “laboratory of inequality-reducing policies” (Kaelble <xref ref-type="bibr" rid="r47">2017</xref>, p. 61). The top marginal tax rate was raised from 5 percent (in Prussia) to 60 percent and unemployment insurance was introduced along with employment legislation and employment protections. In the aftermath of the revolution of 1918, employers’ organizations accepted the unions as equal partners and met many of their sociopolitical demands, including substantial wage increases. In return, the unions cooperated with the employers’ organizations and renounced class war (Kocka <xref ref-type="bibr" rid="r52">1978</xref>, p. 137). Both wage increases curtailing business profit and hyperinflation likely contributed to reducing inequality.<xref ref-type="fn" rid="fn12"><sup>12</sup></xref> The share of capital in national income declined from 40 percent before the war to 35 percent in the second half of the 1920s (Bengtsson and Waldenström, <xref ref-type="bibr" rid="r14">2018</xref>). Other reasons for the decline in top incomes might include capital flight to Switzerland among individuals fearing confiscation of property as war reparations, as well as increased tax avoidance activities following the dramatic tax increases.<xref ref-type="fn" rid="fn13"><sup>13</sup></xref> However, according to the controversial <italic>Borchardt-hypothesis</italic> (Borchardt <xref ref-type="bibr" rid="r15">1982</xref>, p. 176), it was the intensifying distributional conflict between the organized interest groups of labor and capital along with the large-scale redistribution beyond the country’s means that made the economy of the Weimar Republic “sick.” “Excessive” wage raises in the second half of the 1920s far exceeded productivity growth, thus curtailing business profit and limiting the scope of new investments.<xref ref-type="fn" rid="fn14"><sup>14</sup></xref> Rapidly rising unemployment was another consequence. The political and economic system during this period of exceptionally low inequality ended with the Nazi seizure of power in 1933.</p>
<p>The third period stretches from the Nazi takeover in 1933 to the eve of WWII in 1938.<xref ref-type="fn" rid="fn15"><sup>15</sup></xref> The Nazi period is marked by an extraordinary increase in the top percentile’s income share from 11 percent in 1934 to 17 percent 1938.<xref ref-type="fn" rid="fn16"><sup>16</sup></xref> In contrast, P95-99 gained only moderately. In Germany, as in most industrialized countries, economic recovery from the Great Depression started in 1932. The boom that followed up to 1936 was driven by a rebound effect that could be predicted from late 1932 on according to Ritschl (<xref ref-type="bibr" rid="r70">2002a</xref>). The fiscal and monetary policy of the Nazis was immaterial to the upswing. Industrial firms saw their profits rise sharply between 1933 and 1939 with an average return on equity of 10.4 percent (Spoerer <xref ref-type="bibr" rid="r86">1996</xref>). Thomas Ferguson and Hans-Joachim Voth (<xref ref-type="bibr" rid="r25">2008</xref>) report that firms “betting on Hitler” outperformed unconnected firms in their stock market value by 5 percent to 8 percent. The effect of Nazi connections probably contributed to a further concentration of incomes at the top.<xref ref-type="fn" rid="fn17"><sup>17</sup></xref> Larger firms were more likely to have connections with the Nazi regime. They included firms in all sectors, for example, firms engaged in military activities.<xref ref-type="fn" rid="fn18"><sup>18</sup></xref> Some large family fortunes originated during this period, for example, that of the Quandt family, who bought BMW after the war. In 1933, unions were dissolved and wage controls enacted, such that average hourly wages in 1938 were lower than in 1928.</p>
<p>The fourth period, from 1949 to 1989, is that of the FRG, which omits a fifth of the German population, those who were living in the GDR. Income concentration in post-war Germany was high from a historical perspective, thus contrasting with the general view that the social market economy of the post-war period was characterized by comparably low inequality. Income shares of the bottom half of the top decile and the next 4 percent were not significantly below the levels of either the pre-war industrialization period or the interwar period. The post-war drop in the top 1 percent income share in Germany was nothing new, but a return to the low levels already seen in the 1920s. In the 1950s and 1960s, the top 1 percent share was even higher than in the interwar period. The situation was different in other countries involved in the war, such as the United States, France, and the United Kingdom, where the first great decline in top income shares occurred after WWII. Several studies show striking continuity in post-war Germany in many areas. The same people behind the war economy of the early 1940s were also at the helm of major German businesses and business associations in the 1950s, with the exception of a few of the most compromised Nazi collaborators (Grunenberg <xref ref-type="bibr" rid="r36">2006</xref>). Rather than embarking with radical reforms, German policymakers in this decade quickly resurrected institutions inherited from the Weimar Republic and the mid-1930s, thus creating a tightly regulated economy with a corporatist system of organization. Institutional changes were only adopted as needed to avoid a rupture with the Allies. Barry Eichengreen and Ritschl (<xref ref-type="bibr" rid="r22">2009</xref>) argue that the institutional continuity provided accountability and predictability in the 1950s, enabling the German economy to grow and return to its historical trend after the major disruptions in the aftermath of WWII.</p>
<p>Comparing this part of the series with Dell (<xref ref-type="bibr" rid="r18">2007</xref>), I find that the post-war drop in the latter study is less pronounced than mine. My top decile (top percentile) share estimates drop to 30 percent (10 percent) in 1950, whereas Dell (<xref ref-type="bibr" rid="r18">2007</xref>) estimates 34 percent (12 percent) (see Online Appendix, Figure F.7). This divergence is puzzling as I use the same data source and almost the same reference total population and total income from 1950. My estimate of the top percentile’s share in 1949 shows a similar magnitude to my 1950 estimate. In the same line, my top income share estimates in 1989 are higher than those from Dell (<xref ref-type="bibr" rid="r18">2007</xref>) (see Online Appendix, Figure F.7), particularly for the top 1 percent, which cannot be explained by data source of reference totals.</p>
<p>The fifth and last part of the series covers reunified Germany. Political reunification on 3 October 1990, brought the (former) East German states of Berlin, Brandenburg, Mecklenburg-Western Pomerania, Saxony, Saxony-Anhalt, and Thuringia into the FRG. The first few years after reunification were marked by exceptionally high GDP growth rates in the reunified German economy. Gross domestic product grew by about 8 percent per year from 1990 through 1992, although industrial production quickly collapsed in the East and unemployment skyrocketed. Those who kept their jobs benefited from an unprecedented hike in real wages achieved through negotiation by West German labor unions that aimed at reaching parity between East and West German wage levels by 1994 (Burda and Hunt <xref ref-type="bibr" rid="r16">2001</xref>). Accordingly, the inclusion of East Germans in the West German income tax system brought an over-proportional increase in the number of unemployed non-filers. At the same time, wages of East Germans, who were still employed, kept pace with those of West Germans up to the highest percentile. Taking these effects together, the income share of the top percentile fell sharply, whereas the share of the bottom 9 percent of the top decile remained almost unchanged between 1989 and 1992. In 1995, income in the top percentile fell even though the economy was still growing, albeit at a slower pace.19 Growth slowed even further after 1996. By 1998, the top percentile’s income share reached pre-reunification levels as business and capital income continued to grow, along with unemployment. From that point on, the top 5 percent (P95-99 and top 1 percent) experienced enormous growth in their income share, which was only briefly interrupted by the burst of the dot-com bubble in 2003. The income share accruing to the top percentile rose from about 12 percent in 2000 to a post-war high of more than 14 percent in 2008.</p>
<p>In 2009, in the wake of the Great Recession, Germany was hit by the largest output drop of the post-war era, with GDP declining by more than 5 percent. Unfortunately for researchers, the recession coincided with the introduction of dual income taxation in the form of a separate withholding tax on dividends and interest income (<italic>Abgeltungsteuer</italic>), after which income tax statistics no longer recorded these income forms systematically. The shares presented include an imputed capital income share after 2009.<xref ref-type="fn" rid="fn20"><sup>20</sup></xref> Hence, the remaining drop in the top percentile’s income share is largely attributable to the economic crisis.</p>
<p>All in all, as of today, the top percentile did not recover from the shocks that occurred between 1918 and 1945. Their income share was already high and increased to more than 20 percent during the period of industrialization, fell substantially to 11 percent during the years of the Weimar Republic, increased again sharply during the Nazi regime, reaching 16 percent in 1938, and then oscillated around levels of 10–11 percent throughout the post-war period. Since the turn of the millennium, the income share of the top percentile has been growing, with only a brief interruption from the burst of the dot-com bubble in 2003. It rose from about 12 percent in 2000 to a post-war high of more than 14 percent in 2008, and was about 13 percent in 2014.</p>
<p>Despite high volatility between adjacent years, the income share of the top 0.01 percent is at a remarkably stable level of about 2 percent for 140 years (see Online Appendix Figure H.1). This means that this group is receiving an income share that is 200 times their population share. In the years for which microdata exist, excluding capital gains shows that, even at the very top, taxable capital gains remain comparably small.</p>
<p>The bottom 50 percent lost out against the upper half of the distribution over the post-war period, as shown in <xref ref-type="fig" rid="f4">Figure 4</xref>. In the years of the German <italic>Wirtschaftswunder</italic> (economic miracle), strong labor demand and high GDP growth rates coincided with powerful unions, low unemployment, and a relatively compressed wage distribution. The bottom 50 percent received a third of total income. With the oil crises and the onset of mass unemployment, the share of the bottom 50 percent collapsed to less than a quarter. In the 1970s, the share of employees in the service sector surpassed the share employed in the industrial sector. The decline of the bottom half is mirrored by an increase of the middle 40 percent, who had been receiving slightly more than 40 percent of total income since the 1970s. The middle 40 percent’s share has remained relatively stable ever since, while the top decile has gained since the mid-1990s. With the growth of the low-income sector at the end of the 1990s, the share of the bottom half declined significantly from 22 percent in 2001 to 15 percent in 2014.</p>
<p><fig id="f4" position="float">
<label>Figure 4</label>
<caption><p>THE INCOME SHARE OF THE BOTTOM 50 PERCENT, MIDDLE 40 PERCENT, AND TOP 10 PERCENT IN GERMANY, 1961–2014</p></caption>
<graphic xlink:type="simple" mime-subtype="gif" xlink:href="S0022050719000378_fig4" mimetype="image"/>
<attrib>
<italic>Source</italic>: Own calculations based on income tax data (Bartels <xref ref-type="bibr" rid="r12">2019</xref>).</attrib>
</fig></p>
<p>In 2014, the bottom half of the population had a 15 percent share of total income, while the top decile’s share was 41 percent. The top decile’s income share in Germany today has again reached the high levels of the industrialization period. As the data used in Dell (<xref ref-type="bibr" rid="r18">2007</xref>) end in 1998, he did not capture this recent increase in income concentration in Germany. The increase was driven by the bottom 9 percent of the top decile, who have shown disproportionately high income gains during the second half of the twentieth century and in the first decade of the 2000s.</p>
</sec>
<sec id="s2-2">
<title>Top Income Shares in German States, 1871–1918</title>
<p>It is widely agreed that easy access to large coal deposits determined the regional pattern of industrialization in Germany and other industrialized countries (Sombart <xref ref-type="bibr" rid="r85">1919</xref>; Pollard <xref ref-type="bibr" rid="r66">1981</xref>; Holtfrerich <xref ref-type="bibr" rid="r42">1973</xref>; Fremdling <xref ref-type="bibr" rid="r26">1985</xref>; Tilly <xref ref-type="bibr" rid="r95">1991</xref>). According to Theresa Gutberlet (<xref ref-type="bibr" rid="r37">2012</xref>), access to coal in late nineteenth century Germany was decisive in determining where both metallurgy and cotton textile production were located. Consequently, high growth rates in Saxony and the Prussian Ruhr area generated top incomes in these areas, which could not be matched in agrarian areas. On the other hand, the growing importance of big cities for commercial trade (Hamburg, Bremen) and financial trade (Berlin) might have boosted top incomes disproportionately. According to Werner Sombart (<xref ref-type="bibr" rid="r85">1919</xref>), banks, most of which were also located in bigger cities such as Hamburg, Frankfurt, and Berlin, were a driving force in German industrial production and trade. Finally, higher enforcement of tax collection might be another reason for measuring higher income concentration in the sovereign city-states, as income tax was the main source of fiscal revenue in these cities (Ketterle <xref ref-type="bibr" rid="r50">1994</xref>, p. 144).</p>
<p><xref ref-type="fig" rid="f5">Figure 5</xref> shows how the top percentile’s income share evolved in eight German states. The sovereign city-states of Hamburg and Bremen exhibit the highest levels of income concentration,<xref ref-type="fn" rid="fn21"><sup>21</sup></xref> whereas largely agrarian states like Hesse and Baden appear more egalitarian. This pattern is also found by F. Grumbach (<xref ref-type="bibr" rid="r35">1957</xref>), who estimated Pareto coefficients for the period of 1822–1939 for various German states.<xref ref-type="fn" rid="fn22"><sup>22</sup></xref> The top percentile’s income share in the sovereign city-states is fluctuating around 30 percent, which is more than twice the share of the same group in Württemberg or Baden. It is worth noting that the magnitude of income concentration observed in the sovereign city-states as well as in Prussia and Saxony before WWI was also quite high from a long-term perspective over the twentieth century. As of 2014, about 13 percent of total income accrues to the top percentile in Germany.</p>
<p><fig id="f5" position="float">
<label>Figure 5</label>
<caption><p>THE TOP 1 PERCENT INCOME SHARE IN GERMAN STATES, 1871–1918</p></caption>
<graphic xlink:type="simple" mime-subtype="gif" xlink:href="S0022050719000378_fig5" mimetype="image"/>
<attrib>
<italic>Source</italic>: Own calculations based on income tax data (Bartels <xref ref-type="bibr" rid="r12">2019</xref>).</attrib>
</fig></p>
<p>Over the industrialization period, income concentration increased in German states. The top percentile’s income share increased from 13 percent to 17.5 percent between 1890 and 1913 in Baden, from 15.5 percent to 17.5 percent between 1873 and 1913 in Prussia, and from 15 percent to 17 percent between 1904 and 1912 in Württemberg. Soviet economist Sergei Procopovitch (<xref ref-type="bibr" rid="r68">1926</xref>, p. 73), whose results provide the empirical support for the inequality increasing part of the Kuznets curve (Kuznets <xref ref-type="bibr" rid="r55">1955</xref>), concludes that “tendencies toward plutocratic development are certainly in evidence in Germany” between 1875 and 1919. Economists of the time, including Gustav von Schmoller (<xref ref-type="bibr" rid="r80">1895</xref>), Sombart (<xref ref-type="bibr" rid="r85">1919</xref>), and Adolph Wagner (<xref ref-type="bibr" rid="r98">1907</xref>), share the view that income concentration was increasing, and discussed this issue extensively.<xref ref-type="fn" rid="fn23"><sup>23</sup></xref></p>
<p>In Saxony, entrepreneurs in industry and trade obtain most of the income gains in top incomes, whereas the more traditional professions such as large landowners, higher officials, doctors, lawyers, professors, and higher clerks experience only marginal gains. Hartmut Kaelble and Heinrich Volkmann (<xref ref-type="bibr" rid="r48">1986</xref>) show that this phenomenon also applies to Prussia. It likely reflects trends in other industrializing states as well.</p>
<p>During WWI, income concentration rose sharply in Prussia and Saxony, where top income earners experienced disproportionately high income gains, most likely caused by increasing business profits in the armament industry. In contrast, the evolution of the top 1 percent share in mostly agrarian Hesse during WWI was almost stable. The other states did not publish income tax statistics during the war (see the detailed discussion described earlier in the section on top income shares in Germany, 1871–2014, for the distributional changes during WWI). These differential developments across states are in contrast to a general convergence of per capita income levels in Germany as shown in Online Appendix Figure D.1.</p>
</sec>
<sec id="s2-3">
<title>International Comparison</title>
<p>Comparing income concentration in Germany to other countries reveals a strikingly stable income concentration in Germany over the twentieth century. Figure <xref ref-type="fig" rid="f6">6</xref> shows the evolution of the top 1 percent income share in Germany in comparison to the trends observed in France, Sweden, the United Kingdom, and the United States. Although the German top percentile also experienced a U-shape pattern over the twentieth century (Atkinson, Piketty, and Saez <xref ref-type="bibr" rid="r5">2011</xref>), the U-shape is rather flat and interrupted by the skyrocketing shares before and during the two world wars. The top percentile’s share in Germany was comparably low in the first half of the twentieth century. As in Sweden, the decline in income concentration in Germany occurred toward the end of WWI and in the 1920s. In France, the United Kingdom, and the United States, by contrast, the most pronounced drop occurred during WWII. These contrasting developments in the United Kingdom and Germany are also reported by María Gómez León and Herman de Jong (<xref ref-type="bibr" rid="r32">2018</xref>), although they use a different data source—social tables covering 78 income groups in the period 1900–1950. In the post-war period, the top percentile’s income share in Germany was relatively high.24 In the 1960s, the top percentile accrued 11 percent to 13 percent of total income in Germany, about 10 percent in France, about 8 percent in the United Kingdom, and about 10 percent in the United States. The United States surpassed Germany in the 1980s, when the top percentile’s income share in the United States started to increase sharply. This may come as a surprise, since this phase is viewed internationally as one of low inequality. One might speculate that the compressed wage distribution, which is well documented in a variety of survey and administrative data sources from this period, might have led to this view. However, neglecting the analysis of income tax data in the post-war period would leave the picture incomplete. Since the mid- 1990s, Germany is on a path of increasing income concentration, increasingly resembling that of Anglo-Saxon countries.</p>
<p><fig id="f6" position="float">
<label>Figure 6</label>
<caption><p>TOP 1 PERCENT INCOME SHARE IN INTERNATIONAL COMPARISON</p></caption>
<graphic xlink:type="simple" mime-subtype="gif" xlink:href="S0022050719000378_fig6" mimetype="image"/>
<attrib>
<italic>Source</italic>: World Inequality Database (WID) and own calculations based on income tax data (Bartels 2019).
</attrib>
</fig></p>
</sec>
<sec id="s2-4">
<title>Composition of Top Incomes</title>
<p>A first step toward explaining up and downswings in income concentration over time is to study the changing composition of top incomes. Figure <xref ref-type="fig" rid="f7">7</xref> displays the composition of top incomes within fractiles of the top decile moving toward the very top of the income distribution. Three basic conclusions apply to the four years presented for illustration. First, business income from unincorporated firms is always the most important income source of top income earners in the top percentile and among those at the top of the top. In contrast, P90-95 and P95-99 incomes are mostly composed of wages. Second, capital income—dividends, interest income, and rents—is of minor importance compared to other countries like France or the United States. Even for the top 0.01 percent, capital income never comprises more than 20 percent of total income. This is not surprising, as most German firms are unincorporated, often held by a few family members, and generate business income. Accordingly, Germany did not experience the dramatic decline in capital incomes from dividends and interest income after WWII that occurred in the United States. One should note, however, that business income includes both a labor and capital income component. It is unclear how much effort business owners invested in earning their business income or whether they worked for it at all. Third, the self-employed, such as lawyers, physicians, and auditors, earn top incomes but do not belong to the very top group.</p>
<p><fig id="f7" position="float">
<label>Figure 7</label>
<caption><p>INCOME COMPOSITION OF TOP GROUPS WITHIN THE TOP DECILE IN GERMANY</p></caption>
<graphic xlink:type="simple" mime-subtype="gif" xlink:href="S0022050719000378_fig7" mimetype="image"/>
<attrib><italic>Source</italic>: Own calculations based on income tax data (Bartels <xref ref-type="bibr" rid="r12">2019</xref>).</attrib>
</fig></p>
<p>Fluctuations in business incomes are indeed a major force behind the dynamics of top income shares in Germany. Peaks in the top 0.1 percent income share are associated with 60 percent business income (1938, 1961) or 50 percent business income (2001, 2008). This pattern is even more pronounced for the top 0.01 percent, for which I can compute the income composition after 1961. This group generated 80 percent of their income from business in 1961 and 1965 and roughly 70 percent in 1989, 1998, and 2007. The increase in income concentration during the period of rearmament leading up to WWII can be attributed to a rise in business incomes at the top. The fall in income concentration in the late 1960s and after reunification in the 1990s also coincides with falling business incomes at the top. The declining portion of business income at the very top is mirrored by an increase in the portion of capital income. While income from dividends, interest, and property income was 7 percent for the top 0.1 percent and top 0.01 percent in 1961, this portion increased steadily, reaching about a quarter for both top groups in the late 2000s.</p>
<p>Top managers and the highly qualified self-employed increasingly entered top income groups beginning in the 1980s. Whereas wages were less than a tenth of the top 0.1 percent’s income in the 1960s, the wage share increased to almost 30 percent in the first decade of the 2000s. The surge of top wage incomes in the second half of the twentieth century is a common phenomenon also found in Italy, the Netherlands, Spain, and the United States. This is in stark contrast to the rising importance of capital income at the top in Finland, Sweden, and the United Kingdom (Atkinson, Piketty, and Saez <xref ref-type="bibr" rid="r7">2011</xref>). It remains an open question to what extent these <italic>working rich</italic> were both CEOs and business owners at the same time, disbursing part of their business income as wage income. Enrico Rubolino and Daniel Waldenström (<xref ref-type="bibr" rid="r77">2019</xref>) find that income shifting between wage and capital income in response to tax differentials is substantial at the top of the income distribution.<xref ref-type="fn" rid="fn25"><sup>25</sup></xref> Top incomes from wages still present a relatively rare phenomenon in Germany. While the working rich replaced rentiers in Canada and the United States over the twentieth century, where the top 0.01 percent generated half of their income from wages in the early 2000s (Saez <xref ref-type="bibr" rid="r78">2005</xref>), the German top 0.01 percent only generated a tenth from wages.</p>
<p>If owning a business is the time-invariant key to earning top incomes in Germany, the question arises as to how business ownership is achieved and maintained, in some cases across generations. Even during the period of industrialization, aristocratic families played only a minor role as entrepreneurs in Germany. Kaelble (<xref ref-type="bibr" rid="r46">1990</xref>) studies the owners and top managers of large German companies both before WWI and in the Weimar Republic. He finds that intergenerational persistence of business ownership was high during both periods. Increasingly, sons were not working in the family business they had inherited but becoming top managers of other businesses. Inherited business wealth might continue, therefore, to play a central role in top incomes. Philipp Korom, Mark Lutter, and Jens Beckert (<xref ref-type="bibr" rid="r53">2017</xref>), investigating how likely the richest Americans were to remain on the Forbes list between 1982 and 2013, report that lasting fortunes are likely embedded in families, as they erode less easily, if professionally managed, than self-made fortunes. According to Michael Schröder and Peter Westerheide (<xref ref-type="bibr" rid="r82">2010</xref>), about 90 percent of all German companies are family-controlled companies that generate more than half of the cash flow of German companies.</p>
</sec>
</sec>
<sec id="s3">
<title>SEEKING EXPLANATIONS</title>
<p>Focusing on Germany for a period of 140 years enables us to investigate whether potential drivers of top income shares operate uniformly across periods. I argue that relationships are likely to change over time. In the following, I investigate the extent to which the functional income distribution, economic growth, technological change, globalization, the power of trade unions, and redistribution through progressive income taxation are associated with changes in top income shares, all of which are often suggested and investigated confounders of inequality. Online Appendix Figure G.1 shows the development of my main variables from 1871 to 2014. For the functional income distribution, I use the capital share figures of Erik Bengtsson and Waldenström (<xref ref-type="bibr" rid="r14">2018</xref>).<xref ref-type="fn" rid="fn26"><sup>26</sup></xref> The standard measure for technological knowledge is R&D stock, which is available for OECD countries from the 1960s. Jakob Madsen (<xref ref-type="bibr" rid="r56">2007</xref>) constructs a measure for OECD countries covering 135 years, which builds on patent applications per capita and that I use.27 I measure the degree of globalization by the share of exports in GDP. I construct my own time series of trade union density defined by the share of employees who are members of a trade union, as the longest available series from OECD begins in 1960. To create measures of income taxation at the top, I compute the marginal tax rate and the average tax rate that would apply to the top percentile’s average income according to the prevailing income tax legislation.</p>
<p>Table <xref ref-type="table" rid="tbl1">1</xref> shows that all of these variables strongly correlate with the income share of the top 1 percent. As developments of top income groups are largely driven by the top percentile, I restrict this analysis to the top percentile. While a higher capital share is associated with a higher 1 percent income share when considering all periods jointly, average tax rates, trade, union density, technological change, and economic growth are associated with lower income shares. However, the sign of the correlation changes for some factors across the periods. In the following, I discuss theoretical hypotheses on these correlations and my results by period in the light of other empirical evidence.</p>
<p><table-wrap position="float" id="tbl1">
<label>TABLE 1</label>
<caption><p>CORRELATIONS WITH TOP 1 PERCENT INCOME SHARE BY PERIOD</p></caption>
<alternatives>
<table frame="hsides">
<colgroup>
<col span="1"/>
<col span="1"/>
<col span="1"/>
<col span="1"/>
<col span="1"/>
<col span="1"/>
</colgroup>
<thead>
<tr>
<th/>
<th align="center">All</th>
<th align="center">1871–1919</th>
<th align="center">1925–1938</th>
<th align="center">1949–1989</th>
<th align="center">1992–2014</th>
</tr>
</thead>
<tbody>
<tr>
<td align="left">Cap. share</td>
<td align="center">0.219**</td>
<td align="center">0.817***</td>
<td align="center">0.836***</td>
<td align="center">0.528***</td>
<td align="center">0.893***</td>
</tr>
<tr>
<td align="left">Growth</td>
<td align="center">−0.256***</td>
<td align="center">−0.370***</td>
<td align="center">0.228</td>
<td align="center">−0.207</td>
<td align="center">0.152</td>
</tr>
<tr>
<td align="left">Patents</td>
<td align="center">−0.500***</td>
<td align="center">0.530***</td>
<td align="center">−0.449</td>
<td align="center">−0.154</td>
<td align="center">0.886***</td>
</tr>
<tr>
<td align="left">Trade</td>
<td align="center">−0.336***</td>
<td align="center">−0.384***</td>
<td align="center">−0.629**</td>
<td align="center">−0.148</td>
<td align="center">0.911***</td>
</tr>
<tr>
<td align="left">Unions</td>
<td align="center">−0.776***</td>
<td align="center">0.609***</td>
<td align="center">−0.587**</td>
<td align="center">−0.204</td>
<td align="center">−0.897***</td>
</tr>
<tr>
<td align="left">ATR</td>
<td align="center">−0.845***</td>
<td align="center">0.683***</td>
<td align="center">0.884***</td>
<td align="center">−0.0948</td>
<td align="center">−0.794***</td>
</tr>
</tbody>
</table>
<graphic mime-subtype="gif" mimetype="image" xlink:type="simple" xlink:href="S0022050719000378_tab1"/>
</alternatives>
<table-wrap-foot>
<fn-group>
<fn><p><italic>Note</italic>: * <italic>p</italic> < 0.1, ** <italic>p</italic> < 0.05, *** <italic>p</italic> < 0.01</p></fn>
<fn><p><italic>Source</italic>: See Note below Online Appendix G.1 for sources of explanatory variables.</p></fn>
</fn-group>
</table-wrap-foot>
</table-wrap>
</p>
<p>Theoretically, a rising capital share increases inequality, if the correlation between wage and capital income is sufficiently low and if the inequality of capital income is sufficiently high, as suggested by Anthony Atkinson (<xref ref-type="bibr" rid="r6">2009</xref>). As seen from Table <xref ref-type="table" rid="tbl1">1</xref>, the correlation of the functional and the personal income distributions is positive in all four periods. The correlation is higher than 0.8 in all but the post-war period, 1949–1989.</p>
<p>Bengtsson and Waldenström (<xref ref-type="bibr" rid="r14">2018</xref>) find that the correlation is 0.5 or higher and highly statistically significant in 13 out of 16 countries.</p>
<p>If economic growth is shared equally, then economic growth does not affect income inequality. According to the results presented in Table <xref ref-type="table" rid="tbl1">1</xref>, the correlation between growth of per capita national income and the top percentile’s income share is ambiguous. While correlation is positive during the interwar period and in reunified Germany, it is negative during the industrialization period and the post-war period. Thus, I confirm international evidence of pro-rich growth in recent decades (Alvaredo et al. <xref ref-type="bibr" rid="r3">2017</xref>).</p>
<p>Technological progress may favor inequality as higher heterogeneity of tasks increases demand for high-skilled labor (<italic>skill-biased technological change</italic>) (Acemoglu and Autor <xref ref-type="bibr" rid="r2">2011</xref>). Technological change, measured by the number of patent applications per capita, is associated with lower income concentration in the middle of the twentieth century and with higher top income shares in both the industrialization period and in unified Germany. This corroborates findings that recent technological change drives inequality, particularly in the upper part of the income distribution (IMF <xref ref-type="bibr" rid="r44">2007</xref>; OECD <xref ref-type="bibr" rid="r57">2011</xref>).</p>
<p>Trade increases relative wages of the highly-skilled in advanced economies following the predictions of the Heckscher-Ohlin (HO) model, as these economies will export goods that intensively utilize factors with which they are more highly endowed. However, increased competition may also reduce the monopoly power of <italic>national champion</italic> enterprises, thereby also reducing top income shares. As displayed by Table <xref ref-type="table" rid="tbl1">1</xref>, trade measured by the share of exports in GDP is associated with lower top income shares in three of the four periods. In other words, benefits from exporting to the global economy were shared more broadly from the industrialization phase through the post-war era, whereas in recent years, these benefits tend to accrue to the elite. Cross-country studies remain inconclusive about the long-run role of trade (e.g., Roine, Vlachos, and Waldenström <xref ref-type="bibr" rid="r74">2009</xref>).<xref ref-type="fn" rid="fn28"><sup>28</sup></xref></p>
<p>Trade unions are expected to have an equalizing effect, not only directly, by increasing the earnings of their members and others, but also indirectly, by promoting the idea of a fair income distribution and establishing pay norms for employers. Table <xref ref-type="table" rid="tbl1">1</xref> shows that trade union density is negatively correlated with top income shares in three of the four periods. During the industrialization era, trade union density was low, with less than 5 percent of employees being members of a trade union, but was increasing steadily. One might speculate about the extent to which increasing income concentration contributed to increasing trade union membership. Trade union membership and bargaining power substantially increased during the Weimar Republic, when top income shares fell dramatically. After the Nazi takeover, unions were banned and top income shares increased quickly. In the most recent period, declining union membership is strongly correlated with increasing top income shares. Most studies find that higher union density is associated with a more compressed wage distribution (Förster and Tóth <xref ref-type="bibr" rid="r29">2015</xref>).</p>
<p>Top tax rates are argued to reduce top income shares through three channels: reduced labor supply (real response) (Feldstein <xref ref-type="bibr" rid="r24">1995</xref>), increased tax avoidance and evasion (Auerbach and Poterba <xref ref-type="bibr" rid="r9">1988</xref>; Slemrod <xref ref-type="bibr" rid="r84">1995</xref>; Goolsbee <xref ref-type="bibr" rid="r33">2000</xref>; Saez <xref ref-type="bibr" rid="r79">2017</xref>), as well as less aggressive wage bargaining by top managers as the marginal return to a pay increase is lower (Piketty, Saez, and Stantcheva <xref ref-type="bibr" rid="r63">2014</xref>). Table <xref ref-type="table" rid="tbl1">1</xref> shows that average tax rates are strongly negatively correlated with the income share of the top 1 percent when all periods are considered jointly. However, splitting the periods reveals that this correlation was indeed positive until WWII and slightly negative in the post-war period. Only the most recent period shows a significantly negative correlation of −0.78. Income tax rates during the industrialization period were low and often increased in years when top income shares also increased (see Online Appendix Figure G.1). The same applies to the Nazi period, when rising top tax rates coincided with rising income concentration. Income taxation does not seem to play a predominant role for changing income concentration during this period, which is in line with the finding of Rubolino and Waldenström (<xref ref-type="bibr" rid="r77">2019</xref>) that top tax elasticities for 1900–1950 were very low in a set of 30 countries. In contrast, the top percentile’s share growth after the turn of the millennium coincides with decreasing marginal and average tax rates. According to Rubolino and Waldenström (<xref ref-type="bibr" rid="r77">2019</xref>), top incomes in Anglo-American countries became more responsive to taxation over the 1981–2014 period, with tax elasticities increasing to unprecedented levels of 0.92 among the top 0.1 percent. We now turn to the analysis of potential drivers of top income shares using a regression framework. I compute three-year averages of all variables and follow Jesper Roine, Jonas Vlachos, and Waldenström (<xref ref-type="bibr" rid="r74">2009</xref>) to estimate a first-difference Generalized Least Squares (GLS) regression.</p>
<p><disp-formula id="disp3">
<label>(3)</label>
<alternatives>
<graphic xlink:href="S0022050719000378_eqn3" mime-subtype="gif" mimetype="image" xlink:type="simple"/>
<tex-math><![CDATA[$$\Delta y_t = \Delta X'_t \beta + \mu _p + \varepsilon _t $$
Five period dummies, μ p, control for the numerous changes in borders as well as political and economic regimes, namely the German empire (1871–1918), the Weimar Republic (1925–1932), the Nazi regime (1933–1938), post-war Germany (1949–1989), and reunified Germany (1992–2014). Thereby, I can investigate whether certain variables are correlated with inequality after conditioning on period effects. X t is the vector of explanatory variables. The Dickey-Fuller test conducted for one to four lags does not reject the null hypothesis that the first-differenced top percentile’s income share follows a unit root process. By estimating GLS, I allow for serial correlation in the error term that remains after first-differencing.
The top percentile’s income share is the dependent variable in my main specification. Additionally, Online Appendix Table G.1 shows the results of the multivariate regression for six different dependent variables in order to capture different aspects of the income distribution, given that tax data only cover the upper part of the income distribution. As the top decile is very heterogeneous, I use the top decile, the top percentile, and the top decile excluding the top percentile (P90-99). The ratios 1/10 (0.1/1) measure the share of the top 1 percent (0.1 percent) within the share of the top 10 percent (1 percent) and have the advantage that they are not sensitive to the choice of total income.
The regression results, however, do not allow a causal interpretation, as I have not fully addressed potential endogeneity problems. First, the regressions might suffer from reverse causality. For instance, increasing income concentration might lead to less per capita income growth, to higher union membership, or to higher income tax rates. Second, if some omitted variable influences both top income shares and the explanatory variables, then the results are biased. Third, income concentration and capital share may be codetermined, because more income accruing to the top of the income distribution, where the capital owners are situated, may simultaneously create a higher capital share in national income.Footnote 29
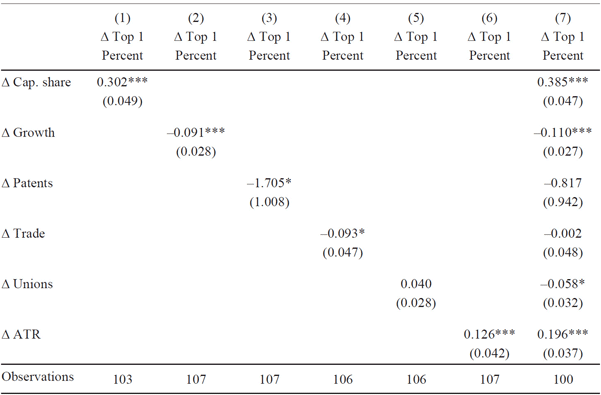
In order to address multicollinearity between the regressors, I estimate bi-variate regressions and one multivariate regression including the full set of controls. Regression results are presented in Table 2. The capital share and average tax rates are significantly positively associated with the top percentile income share. The positive association with tax rates is not a surprise: Taking a long-run perspective, income tax rates are often increased during periods with increasing income concentration: for instance, during the industrialization period and the Nazi period (see bottom panel of Online Appendix Figure G.1). It is only in the first half of the 2000s that income tax reductions coincide with increasing income concentration. However, I find both negative and positive relationships between average tax rates and inequality using different inequality measures as dependent variable (see Online Appendix Table G.1) or taking annual values instead of three-year averages (see Online Appendix Table G.2).
FIRST-DIFFERENCE GLS REGRESSION RESULTS SUBSEQUENTLY INTRODUCING CONTROLS

Note: First-difference Generalized Least Squares estimations including period dummies take account of serial correlation in the error term. * p < 0.1, ** p < 0.05, *** p < 0.01
Source: See Note below Online Appendix Figure G.1 for sources of explanatory variables.
Trade, unions, patents, and growth show a negative association with the top percentile income share, thus confirming the correlations shown in Table 1. However, while the effect of growth is significant in both the bi-variate and the multivariate specifications, the effect of trade, patents, and unions is only significant in either the bi-variate (trade, patents) or the multivariate (unions) specifications. In sum, correlations and regression results provide a similar picture: The capital share is consistently associated with higher top 1 percent shares even after including other co-determinants.Footnote 30
CONCLUSION
This article provides a new long-run top income share series for Germany from the early phase of industrialization through 2014. Income concentration today is not substantially different from the industrialization period. With a top 10 percent income share of about 40 percent in 2014, incomes are as concentrated as they were at the eve of WWI. The top percentile’s share, however, is lower today than in 1913 (18 percent versus 13 percent).
Nevertheless, top income shares in Germany experienced violent swings mirroring the turbulent political and economic developments between 1871 and 2014. Most prominently, top incomes skyrocketed before and during the two world wars. Against common belief, the two world wars did not act as the immediate great levelers. The dramatic decline of top incomes in the 1920s was accompanied by hyperinflation, the introduction of collective bargaining, high wage growth, small business profits, and a tenfold increase of top tax rates. After WWII, the top percentile’s income share returned to the level of the 1920s and then fluctuated around 10–12 percent. Throughout the post-war period, the bottom 9 percent of the top decile gained steadily at the expense of the bottom 50 percent. The middle 40 percent’s income share has remained quite stable. As a result, the top decile’s share surpassed 40 percent in 2014, while the bottom 50 percent is at 15 percent. Since the turn of the millennium, the top percentile’s income share has been on the rise, gradually catching up with the levels of the United Kingdom and the United States.
Throughout the twentieth century and up to the present, the top income earners in Germany have been business owners. Although the probability to encounter a highly qualified employee among the top has increased, their share is negligible at the very top, particularly when compared to the working rich in the United States. Consequently, growth in top income shares in Germany is closely related to increasing profits of business owners and higher capital shares in national income as opposed to wages. Generous exemptions from the inheritance tax for family-owned firms, as is the case for most firms in Germany, are likely to perpetuate high income and wealth concentration in the future. It is an open question for future research, to what extent income and wealth inequality in Germany is persistent across generations because of inherited family-owned firms.
Taking an international perspective, findings for Germany stand out compared to France, the United Kingdom, and the United States. First, the high income concentration of the industrialization period in Germany started declining in the 1920s, whereas in the other countries, WWII brought strong and lasting reductions in income concentration at the top. Second, the top percentile’s income share in Germany in the post-WWII period was high by international comparison. This finding collides with the general view that this was a period of low inequality.
A higher capital share is consistently associated with higher income concentration in all periods. If the relations observed for the past 140 years hold, a sustained increase of the capital share will favor greater income concentration in the future. Indeed, the capital share has increased in the large majorities of countries and industries since the early 1980s, which is often attributed to advances in information technology (Karabarbounis and Neiman Reference Karabarbounis and Neiman2014). Since reunification, declining average tax rates and falling union density combined with economic growth, rising exports, and technological progress have tended to enrich the German elite. However, during the industrialization period, economic growth, and international trade were associated with less income concentration. Future research could overcome the endogeneity concerns discussed earlier by exploiting a quasi-experimental setting to identify the causal effect of these factors. Further, this article’s consistent long-run top income share series can serve as the central building block for DINA inequality measures for the entire distribution in Germany, in order to study the distributive effects of GDP growth and the long-run redistributive role of the welfare state.