Introduction
The Sustainable Development Goals (SDGs) were launched in September 2015 at the UN General Assembly. The SDG are broad, comprehensive and ambitious compared with the Millennium Developmental Goals (MDGs) (Sachs et al., Reference Sachs2012; Lim et al., Reference Lim, Fullman and Murray2016). A total of 17 goals, 169 targets and 230 indicators have been recommended to measure and monitor the developmental progress of the UN member nations (United Nations, 2016). These goals focus on the overall improvement of human development – economic, social, environmental and political. While there have been efforts to integrate these goals, targets and indicators in the official statistical system across countries, there has been scepticism about the measurement, duplication, specification, clarity and practical utility of the long list of targets and indicators (Fehling et al., Reference Fehling, Nelson and Venkatapuram2013; Lim et al., Reference Lim, Fullman and Murray2016).
The health-related goals, targets and indicators are essential components of SDGs, which reflect the shift towards a more holistic vision of health and well-being (Buse & Hawkes, Reference Buse and Hawkes2015; Gostin & Friedman, Reference Gostin and Friedman2015). While the focus of the health-related MDGs was limited to maternal and child health, the SDGs have a broader target that includes health outcomes and health determinants across all ages. Goal 3 of the SDGs outlines the health-related goal, which aims at ensuring healthy lives and promotes well-being at all ages. A total of 13 targets and 26 indicators are listed in the health domain of the SDGs. Nearly 21 inter-related indicators from 9 other goals are included in the health domain (United Nations, 2016). The inclusion of health-related goals in the development agenda signifies the interlinkage between development and health.
Global progress in the health-related SDGs has been uneven. Variations in childhood mortality, longevity, disability-adjusted life years (DALYs) and maternal mortality ratio are large among countries. The global under-five mortality rate has fallen from 91 deaths per 1000 live births in 1990 to 43 deaths per 1000 live births in 2015 (You et al., Reference You, Hug, Ejdemyr and Idele2015). Though there has been significant improvement in child survival, the target of reducing under-five mortality as stipulated in the MDGs has not been achieved (Abou Zahra & Boerma, Reference AbouZahr and Boerma2010). The global maternal mortality ratio has declined from 385 deaths per 100,000 live births in 1990 to 216 in 2015, with an annual reduction of 2.3% and large variations among regions (Alkema et al., Reference Alkema, Chou and Hogan2016). On the other hand, the increase in non-communicable diseases (NCDs) is leading to rising premature mortality across developing and developed countries. Global deaths due to NCDs increased from 34 million in 2005 to 40 million in 2015, largely due to cardiovascular disease (17.8 million) and cancer (8.8 million) (Wang et al., Reference Wang, Naghavi, Allen, Barber, Carter, Casey and Dandona2016). The changing disease burden along with socioeconomic development has large implications for realizing the SDGs.
The global progress in SDGs is largely contingent on India’s progress, as India with its 1.3 billion population in 2016 accounts for 17% of the global population. India has large variations in socioeconomic development across states and socioeconomic groups. Over the last two decades, India has achieved sustained economic growth, reduced poverty by half and made commendable progress in improving reproductive and child health services in the country. On the economic front, the growth rate of GDP was over 6%, and the percentage of population living below the poverty line decreased from 37% in 2004–05 to 21% in 2011–12 (Planning Commission, 2014). The female literacy rate increased from 39% in 1991 to 66% in 2011 (censusindia.gov.in/2011-prov-results/data.../india/Final_PPT_2011_chapter6.pdf). On the demographic front, the country is nearing replacement level fertility, and life expectancy has been steadily increasing. Reduction in maternal mortality and child mortality has been significant (Ram et al., Reference Ram, Paswan and Singh2017). In the composite index of human development, the country moved from 0.428 in 1991 to 0.624 in 2015 (UNDP, 2015). Despite this progress, the country is still plagued by undernutrition, and economic inequality seems to have increased. In the Human Development Index (HDI), India ranks 130 (UNDP, 2015) and regional disparities seem to have increased over time. The MDGs have been integrated into the official statistical system in India, and their progress has shown mixed results. While the country has been successfully improving maternal health and child health, the progress has been uneven (Ministry of Statistics and Programme Implementation, 2015).
As a signatory of the SDG declaration, the official statistical system in India is integrating the SDG targets and indicators into its planning and programmes. In a recent paper, Saikia and Kulkarni (Reference Saikia and Kulkarni2017) highlighted the data gap on measuring SDGs in India. A recent study based on the SDGs found that India ranked 143 among 188 countries with an SDG index value of 42, while Iceland came top with an index value of 85 (Lim et al., Reference Lim, Fullman and Murray2016). The performance in SDGs of India is poor among BRICS countries and is lower than that of China and Sri Lanka. India’s low ranking has been attributed to poor child and maternal mortality, poor sanitation and the double burden of communicable and non-communicable disease (Lim et al., Reference Lim, Fullman and Murray2016; Singh, Reference Singh2012, Reference Singh2016). The National Health Policy 2017 aims at achieving many of the SDG indicators in a time-bound manner. In addition, state governments are planning to integrate SDG indicators into the measurement of developmental progress.
This study is a systematic effort to document the progress in selected SDGs across Indian states and social and economic groups in India. It uses existing data and outlines the prospects of these indicators by 2030. The health indicators include a set of health outcomes, nutritional indicators, level of health care utilization and determinants of health.
Methods
The Census of India, Sample Registration System (SRS), National Family Health Surveys (NFHSs) and National Sample Surveys (NSS) are the prime data sources for health-related indicators in India. Estimates from these sources are available at national and state levels. The Census of India is conducted once every 10 years and provides information on population size and distribution and socioeconomic conditions at national and sub-national levels. The SRS is a dual record system that involves continuous registration of samples from villages and urban blocks. The SRS has been providing fertility and mortality indices annually since 1970 at national and state levels. It also provides estimates of maternal mortality through a special survey. To bridge the data gap in health-related issues in India, the Demographic Health Survey, known as the National Family Health Survey (NFHS), was initiated in India in 1992–93. Until 2015–16, four rounds of the NFHS had been conducted in the country. The NFHSs provide comprehensive information on marriage patterns, fertility, mortality, family planning and important aspects of nutrition, health and health care in the population. The recently published NFHS-4 provides many population- and health-related indicators to monitor the progress of the SDGs in India. It is the largest ever population-based survey in India that covered more than six lakh households (International Institute for Population Sciences, 2017). As the reference years of the NFHS-4 and SDGs are the same, the importance of these data to monitor the SDGs in India cannot be undermined. The NSS began in 1950, and since then it has been collecting data on various aspects of human development through its various rounds, especially on social factors, consumption expenditure, health, migration and employment. The first health survey was conducted in its 28th round (October 1973–June 1974), and subsequent surveys took place in the 42nd round (July 1986–June 1987), 52nd round (July 1995–June 1996), 60th round of NSS (January–June 2004) and 71st round (January–June 2014), which provide information on morbidity, health care and health-related issues.
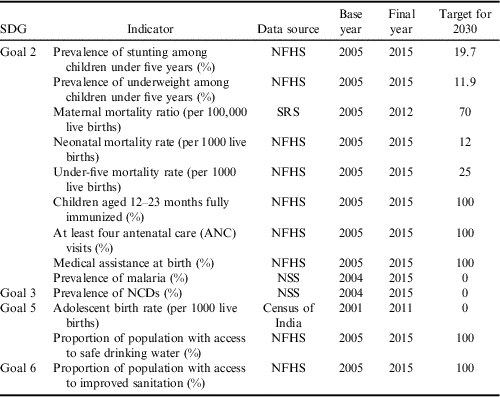
Table 1 presents a list of indicators with their data source, base and final years and minimum level or target values for India. The minimum value was fixed based on the lowest value observed among the states of India or based on the SDG minimum value or the defined target. Two nutrition indicators, such as prevalence of stunting and underweight among children under 5 years of age, were obtained from the NFHSs, and the minimum value fixed was that of Kerala (observed). The maternal mortality ratio targets were based on the SDG minimum value of 70. Similarly, under-five mortality rate and neonatal mortality rate were targeted at 25 and 12 per 1000 live births, respectively, based on the SDG minimum value. The targets for institutional delivery or delivery by health personnel, sanitation and hygiene, complete immunization of children aged 12–23 months and antenatal care (ANC) coverage were fixed at 100%. The minimum value for NCDs and malaria indicators was fixed at one (1) instead of zero (0) to facilitate computation.
Data sources and targets of selected health-related SDG indicators in India

NFHS, National Family Health Survey; SRS, Sample Registration System; NSS, National Sample Survey.
Analysis
Annual rate of progress (ARP) and required rate of progress (RRP) were computed by social group and wealth quintile (economic group) in a similar way as has been done for the MDGs (Ram et al., Reference Ram, Mohanty and Ram2009). A composite index of the SDG health indicators (CIH) was computed to understand their progress. A brief description of the method of computation is given here.
Computation of ARP and RRP
The indicators used to compute the progress of the SDGs are both positive and negative. For positive indicators such as immunization, safe drinking water and sanitation, ANC coverage and medical assistance at birth, a higher value indicates better progress and the desired value is 100. Indicators such as undernutrition, neonatal mortality rate, under-five mortality rate, maternal mortality ratio, prevalence of malaria and NCDs and adolescent birth rate are negative indicators relating to health, and the minimum values are presented in Table 1. For negative indicators, the ARP was computed by:
 $${\rm ARP}{\equals}{{X_{t} {\minus}X_{0} } \over {X_{0} (t_{1} {\minus}t_{0} )}}$$
where t 0 is the base year (or year closest to 2004, for which data were available), t 1 is the most recent year for which data were available, and X t and X 0 are the values of the indicator for the final year and base year, respectively.
For the positive indicators the following formula was used to calculate ARP:
 $${\rm ARP}{\equals}{{(X_{t} {\minus}X_{0} )} \over {(100{\minus}X_{0} )(t_{1} {\minus}t_{0} )}}$$
The RRP was computed as follows:
 $${\rm RRP}{\equals}{\alpha \over {t_{{\rm SDG}} {\minus}t_{1} }}$$
and
 $$\alpha {\equals}(t_{{{\rm SDG}}} {\minus}t_{1} )\,/\,t_{1} $$
where t SDG is the targeted SDG to be achieved and t 1 is the recent year for which data were available.
Construction of the Composite Index of Health (CIH)
To understand overall progress in achievement of the SDGs, a health-related index was constructed based on selected health-related indicators: the Composite Index of Health (CIH). Two approaches were used to develop the composite health measure. One was the normative approach, which assigned equal weight to each indicator in overall health. All the indicators were normalized to ‘0’ and ‘1’ scale. The composite index was then computed based on the geometric mean of all the indicators. The geometric mean was preferred to calculate the CIH as it reduces the level of substitutability between dimensions. As an alternative approach, the PCA was used to compute the composite index. The PCA is a data reduction statistical method used to explain the maximum amount of variance with the fewest principal components. The rank correlation coefficient of states based on two methods was calculated. Regression analysis was performed using HDI as a dependent variable and CIH as an independent variable to understand the linkage between development and health.
Results and Discussion
Table 2 presents the ARP and the RRP values of selected indicators of the SDGs in India. The base year for the analysis was 2005–06 and the recent year was 2015–16. The RRP was computed by fixing the time period at 2030. Figure 1 presents the ARP and RRP values for stunting, maternal mortality ratio (MMR), under-five mortality rate, immunization coverage, ANC care visits, medical assistance at birth and improved sanitation in India.
Annual rate of progress (ARP) and required rate of progress (RRP) of selected health indicators in India.
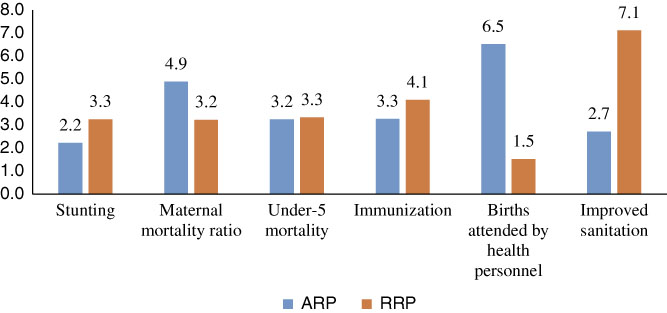
Annual rate of progress (ARP) and required rate progress (RRP) of selected indicators in India
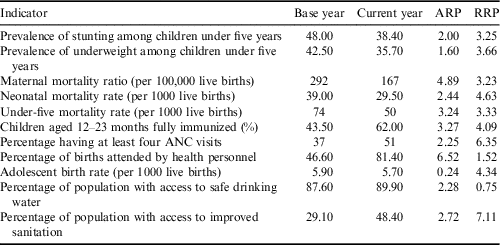
Hunger remains a major challenge in India. The prevalence of stunting among under-five children declined from 48% in 2005 to 38% in 2015, with an ARP of 2% and RRP of 3.2%. Similarly, the prevalence of underweight among under-five children declined from 42.5% to 35.7% between 2005 and 2015. The ARP for underweight was 1.6%, while the RRP was 3.6%. These results suggest that the improvement in undernutrition has been slow and needs an accelerated pace to achieve the hunger target by 2030. The reduction in maternal mortality remains a priority under the National Health Mission (NHM). The maternal mortality ratio decreased from 292 per 100,000 live births in 2004–06 to 167 per 100,000 live births in 2011–13. The ARP for this was 4.89%, while the RRP was 3.23%, showing that India is on track to achieve the maternal mortality target.
Increase in medical assistance at birth – used as a strategy to reduce maternal and child mortality – has assumed prominence in India’s health programme. Most obstetric complications could be prevented or managed if women had access to a skilled birth attendant (doctor, nurse or midwife) during childbirth. In India, the prevalence of medical assistance at birth increased from 47% in 2005 to 81% in 2015. The ARP for medical assistance at birth was 6.52%, while the RRP was 1.5% per annum. Antenatal care plays an important role in achieving a fruitful labour and delivery process and helps in the physical and mental preparation of women. Antenatal care ensures maternal–fetal health and well-being and prepares women physically for labour, delivery and the postpartum period. In India, ANC coverage of at least four visits increased from 37% in 2005–06 to 51% in 2014–15. The ARP was 2.25% per annum, while the required rate was 6.35% to achieve universal coverage. The progress in maternal health indicators shows marked improvement in India.
In the case of child health indicators, the under-five mortality rate showed significant progress from 2005 to 2015 and is likely to achieve the SDG target. India realized impressive gains in child survival and this can be attributed largely to the success of the National Health Mission (NHM). The under-five mortality rate in India has declined from 74 to 50 per 1000 live births with an annual pace of decline of 3.24% per annum. To achieve the target of estimated under-five mortality of 25 deaths per 1000 live births, the RRP is estimated at 3.33% per annum. But a similar pattern was not observed in the case of neonatal mortality. The neonatal mortality rate in India declined from 39 per 1000 live births in 2005 to 29 in 1000 live births in 2014 with an ARP of 2.44% per annum. But the RRP to achieve a minimum target of 9 was 4.63% per annum. Similarly, the immunization of children is one of the most cost-effective interventions to prevent the suffering that comes from preventable sickness, disability and death. Immunization not only leads to improvements in health and life expectancy but has a socioeconomic impact at both the community and national levels. However, India is lagging behind in its target of full immunization. About 43.5% of children aged 12–23 months were fully immunized in 2005–06, which improved to 62% in 2014–15, with an ARP of 3.27%. The required annual rate of progress to achieve universal immunization is 4.1%.
Improved sanitation facilities and access to safe drinking water have a direct impact on the health status of the population. India’s progress towards providing safe drinking water is satisfactory as 90% of the population now have access to safe drinking water. However, progress towards improved sanitation has been slow. Until 2014, only half of Indian households had access to an improved sanitation facility. The ARP was 2.7% per annum, while the RRP was 7.1%, showing that there should be more focus on improvement of sanitation.
Progress on the health-related SDGs by social and economic groups and place of residence
India is committed to bridging the coverage gap in the health-related target of the SDGs across religion and caste groups, among the poor and non-poor and in rural and urban areas. Despite this, the variation in health-related indicators in India is enormous across social groups, wealth quintiles (the economic well-being of households) and by place of residence. Table 3 presents the ARP and RRP values for different SDG indicators by these background characteristics. The results show a mixed pattern across these variables. It is quite impressive to see that the ARP was highest among Scheduled Castes (SCs) in the case of medical assistance at delivery and immunization coverage. In the case of under-five mortality, the reduction was highest among Scheduled Tribes (ST). For underweight, the ARP was highest among Other Backward Classes (OBC), while the reduction of stunting and neonatal mortality was highest among the General castes. The RRP for most of the indicators was highest among the STs. Similarly, large differentials in ARP and RRP by religion were found. The ARP for stunting was highest among Buddhists, while that for underweight was highest among Muslims. Reductions in under-five mortality and in neonatal mortality were also highest among Buddhists. The ARP for medical assistance at birth and immunization coverage was highest among Sikhs.
Annual rate of progress (ARP) and required rate of progress (RRP) of selected SDG indicators by social group, wealth quintile and place of residence in India
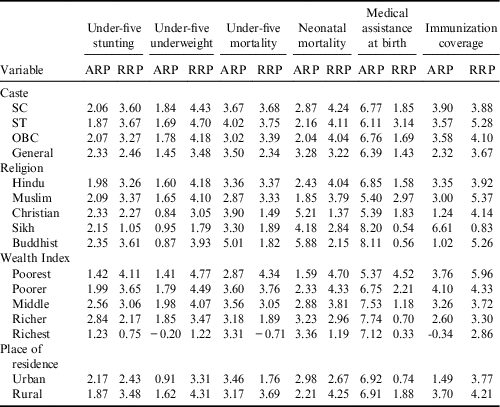
The ARP by wealth quintile suggests that progress was highest among the middle and richer wealth quintiles and lowest among the poorest for most of the indicators. For example, in the case of reduction in stunting, the ARP was highest among the richer followed by the middle, poorer, poorest and richest quintiles. The low ARP among the richest wealth quintile was due to high coverage of these groups in the base year. The poorest and poorer wealth quintile groups had a two-fold greater RRP compared with the richer group. Similarly, rural households had a higher ARP than their urban counterparts for most of the indicators. The higher ARP in under-five mortality among SCs, STs and the poorer wealth quintile is a positive indication of the development of the health system.
Interstate variation in progress towards the SDGs
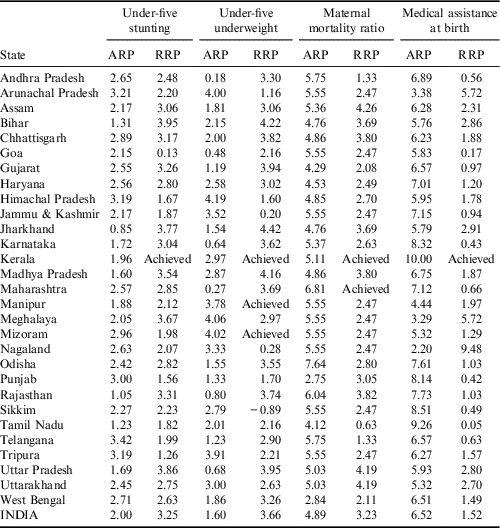
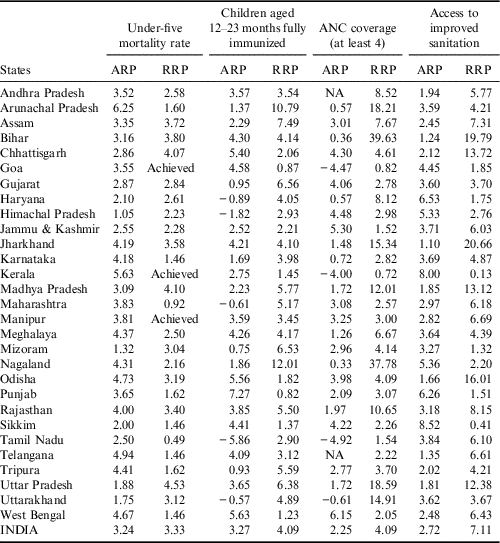
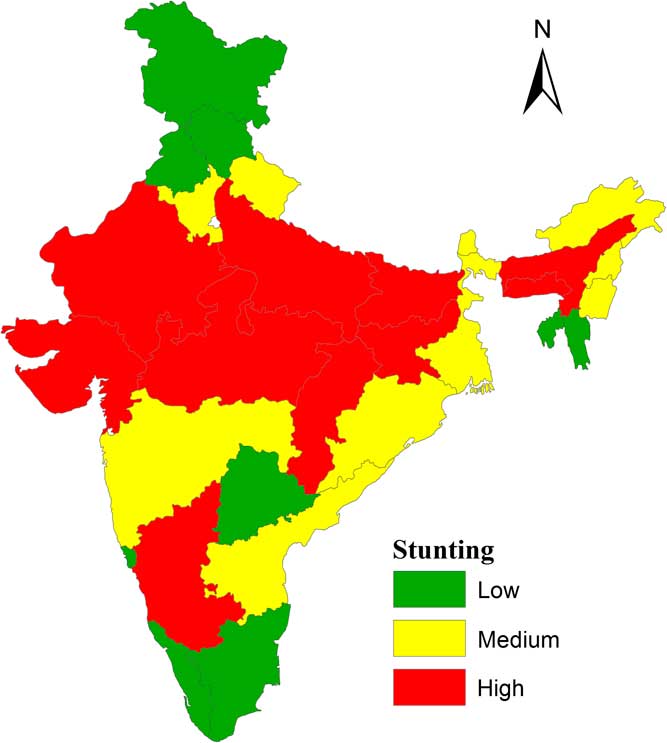
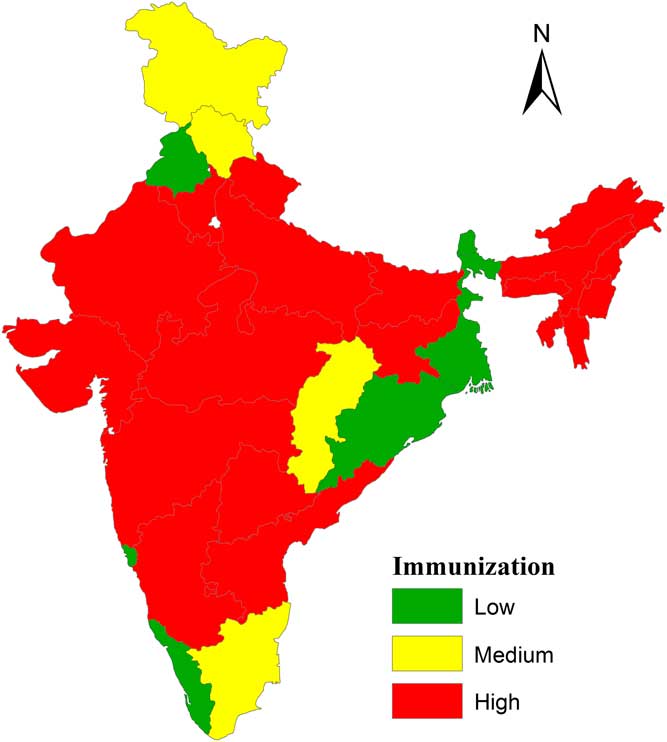
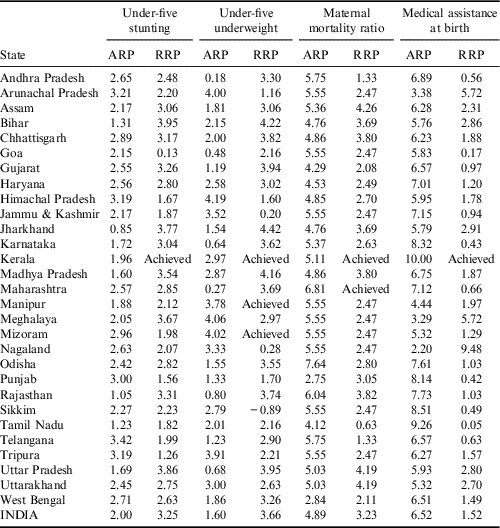
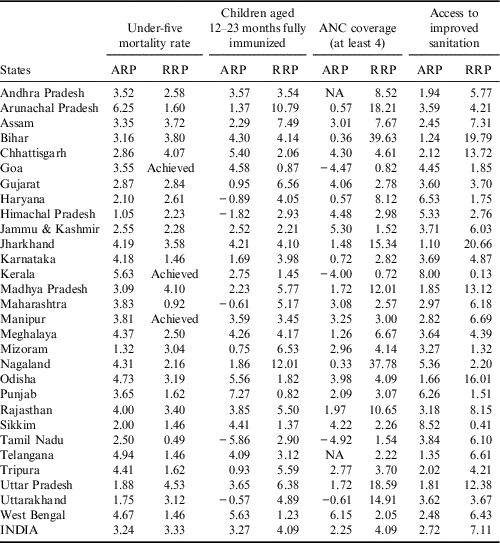
Though India has achieved significant progress in some of the SDG indicators, the pace of progress is largely uneven across states. Table 4 presents the ARP and RRP values for stunting and underweight of children under age five, the maternal mortality ratio and medical assistance at birth. Table 5 presents the ARP and RRP values for under-five mortality rate, immunization coverage, ANC visit coverage and percentage of households with an improved sanitation facility. The variation in each of the indicators among the states was large over time. The coefficient of variation increased for the nutritional indicators and under-five mortality rate and declined for the health service indicators between 2005 and 2015, suggesting a wide variation in nutrition and child mortality. The RRP values for selected indicators for the states of India are presented in Figs 2–5. Each of the maps classifies the RRP into three categories: low, medium and high.
Required rate of progress (RRP) of under-five stunting in states of India.
Required rate of progress (RRP) of immunization in states of India.
Required rate of progress (RRP) of maternal mortality ratio in states of India.

Required rate of progress (RRP) of sanitation coverage in states of India.

Annual rate of progress (ARP) and required rate of progress (RRP) for under-five stunting, under-five underweight, maternal mortality ratio and medical assistance at birth in selected states of India
Annual rate of progress (ARP) and required rate of progress (RRP) for under-five mortality rate, immunization coverage, ANC coverage and proportion of population with safe sanitation by selected states of India
Irrespective of economic and educational status, the RRP for stunting remains high for all states in India compared with the ARP. The states of Jharkhand and Madhya Pradesh showed slower progress in stunting between 2005 and 2015. The ARP was lower than the RRP in many states of India, and most of the states had the required reduction of more than 3.5% annually to achieve the SDG target. Figure 2 presents the RRP for under-five stunting across the states of India. Out of 29 states, the RRP was high in ten states, medium in ten states and low in nine states. The pattern of RRP was similar for underweight children. The rates of progress in reduction of underweight were very low for Karnataka and Maharashtra. Like stunting, most states need a more than 3.5% per annum reduction in underweight to reach the SDG target.
The reduction in child mortality is encouraging in many states. Some states, like Kerala and Goa, have already achieved the SDG target in the neonatal mortality rate and under-five mortality rate. The ARP for the under-five mortality rate was higher in Arunachal Pradesh followed by Andhra Pradesh, Kerala and Telangana and least in the states of Uttarakhand and Himachal Pradesh. Similarly, the neonatal mortality rate varied from 7 per 1000 live births in Kerala to 78 per 1000 live births in Uttar Pradesh. The RRP for both the indicators was higher among the Empowered Action Group (EAG) states and other poor economic states. Full immunization among children varied from 36% in Nagaland to 89% in Punjab. The ARP for full immunization among children aged 12–23 months was higher in the state of Punjab followed by Chhattisgarh and Odisha. The RRP was highest in Nagaland and Arunachal Pradesh and least in Goa, Kerala, Punjab, and Sikkim. Figure 3 presents the RRP of full immunization coverage across the states of India, showing that the RRP was higher in nineteen states and lower in six states. Many EAG states have lower improvement in immunization coverage.
The maternal mortality ratio in India has declined in many states, and Kerala and Maharashtra have achieved the SDG targets. The ARP for maternal mortality rate was high in Maharashtra followed by Odisha and Rajasthan. A total of fifteen states saw a more than 5% improvement from 2005 to 2015. Irrespective of progress, EAG states like Assam, Uttar Pradesh, Uttarakhand, and Chhattisgarh have a higher RRP in maternal mortality ratio. Figure 4 presents the RRP for maternal mortality ratio, which shows that nine states had a high RRP, and most were in the EAG states. The ARP for medical assistance at birth was higher in Tamil Nadu, Odisha, Andhra Pradesh and Punjab. In many states, the proportion of births attended by health professionals was over 80%. Nagaland has a high RRP followed by Meghalaya and Arunachal Pradesh. Antenatal care coverage among women of reproductive age varied from 14% in Bihar to 90% in Kerala. The ARP in antenatal coverage was higher for Jharkhand, Odisha and Sikkim, while the RRP was higher for many EAG states like Bihar, Nagaland and Jharkhand.
The percentage of people with access to an improved sanitation facility remains a great concern for India. In ten states, less than 50% of households have access to an improved sanitation facility, and most of these are EAG states. Figure 5 presents the RRP for improved sanitation coverage, which shows that fifteen states had a high RRP, and only two states classified as lower RRP.
Composite index
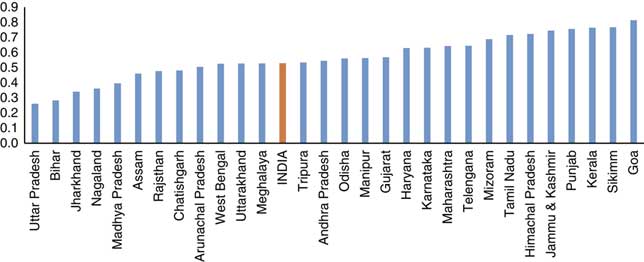
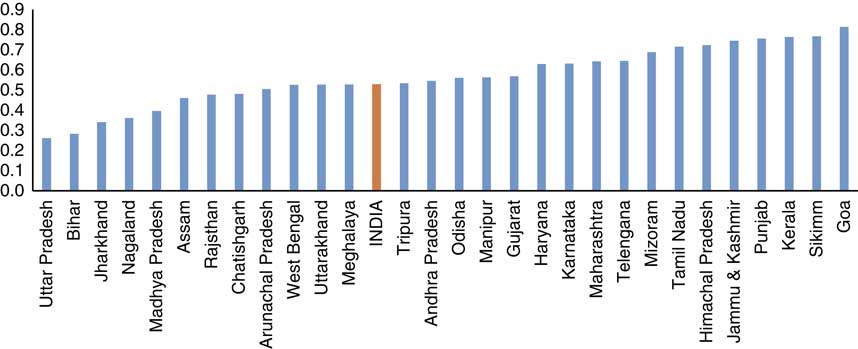
Figure 6 presents the ranked Composite Index of Health (CIH) values for the states of India. In 2015, the mean CIH of India was 0.53. The CIH was highest in Goa (0.81) and lowest in Uttar Pradesh (0.26). Twelve states, including the six EAG states Bihar, Uttar Pradesh, Jharkhand, Assam, Madhya Pradesh and Rajasthan, had a lower index value than the national average. As an alternative, the weighted index based on principal component analysis (PCA) using these indicators was also constructed. The ranking of most of the states remained the same for CIH based on unweighted mean and PCA. The rank correlation of both the indices was 0.95. The composite index based on the background characteristic was calculated. The CIH for a sub-group of the population excluded maternal mortality ratio and adolescent birth rate as these indicators were not available by background characteristics. The result suggests that the CIH for urban areas was three times higher than that for rural areas. The CIH value was highest among Sikhs and Buddhists, whereas the Muslims were at a disadvantage. Caste differentials were observed in the CIH. Similarly, a large differential in CIH was observed in wealth quintiles. The richer and richest quintiles had CIH values higher than 0.70, whereas the poorer and poorest had values less than 0.45. The richest wealth quintiles had a CIH five times higher than that of the poorest quintile. This pattern infers an inequality in health status among the poor and non-poor.
Composite Index of Health (CIH) of India and its states.
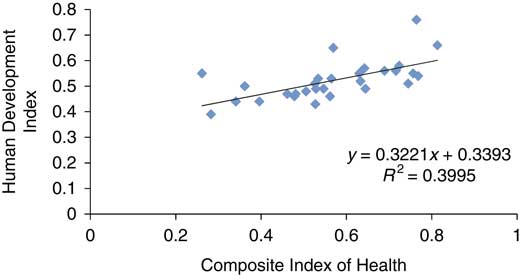
To understand the pattern of development and health linkage at the state level, the correlation and regression analysis was performed for the CIH and HDI values of the states. The correlation coefficient between the CIH and HDI of the states was found to be 0.72, which signifies that health indicators are better in the better-developed states of India. To understand the association, regression analysis was performed with HDI as the dependent variable and CIH as the independent variable. The regression line and equation are shown in Fig. 7. On regressing the HDI with CIH, it was found that the coefficient was significant, and that CIH explained 40% of the variation in the HDI. As the slope coefficient is positive, it infers improvement in CIH improves the HDI positively.
Regression line and equation of the Composite Index of Health (CIH) and Human Development Index (HDI) in India.

The study has its limitations. The thirteen indicators considered are indicative and do not cover all stated health-related SDG indicators. Despite the recent release of NFHS, SRS and NSS and other data sources, reliable estimates were only available for thirteen of the 47 indicators at the sub-national level. No information on cause-specific deaths such as communicable and non-communicable diseases suicides was available. Moreover, the study was limited to finding a disparity pattern among the various states and wealth quintiles due to data limitations.
Conclusions and policy implications
The study found that the annual rate of progress for maternal mortality ratio, under-five mortality rate, ANC coverage and medical assistance at birth is satisfactory in India. However, progress in immunization coverage, stunting and underweight among under-five children, sanitation and hygiene has been slow. In addition, it was found that the state patterns in progress in achievement of the SDGs has been diverse and differences between states are large. While states such as Goa and Kerala have a lower level of child mortality, this has remained high in many other states. The ARP for stunting and underweight is very low in Bihar, Jharkhand and Madhya Pradesh, and it remains high for many developed states. Less than 50% of children aged 12–23 months were fully immunized in many states in 2015. Variations in improved sanitation coverage remain large among states. The progress in health-related SDGs among social groups is mixed. The progress in medical assistance at birth and immunization was highest among SCs, while for under-five mortality it was highest for STs. Similarly, among religious groups, the highest progress in immunization coverage, skilled birth attendance and neonatal mortality was for Sikhs, while reduction in under-five mortality rate was highest for Buddhists. The highest progress in underweight was observed among OBCs and Muslims. Among the wealth quintiles, higher progress in under-five mortality rate and immunization coverage was observed for the poorer group, while for underweight and skilled birth attendance, it was highest for the middle group. The composite index of health (CIH) was high in the developed states of Kerala, Goa, Sikkim and Tamil Nadu, urban areas, in the richest wealth quintile and among Sikhs. Twelve states had CIH values less than the national level, including many EAG states. This pattern was also observed in social groups and wealth quintiles. The CIH value was found to be positively related to the wealth index. The association between CIH and HDI was high, highlighting the importance of income and education for health-related development.
The improvement in maternal care indicators may be attributed to the National Health Mission (NHM), the flagship programme of the Government of India that was initiated in 2005. Central government investment in the NHM has increased in recent years. With respect to nutritional outcome, stunting and underweight were concentrated in the states with the highest incidence of poverty. The improvement in child mortality may be attributed to the National Policy on Children (2013), ICDS service, NHM and other holistic child development policies.
This study is a step towards producing a more cohesive understanding of the progress in many health-related indicators in India. It has demonstrated a heterogeneity in progress among states and by background characteristics, which has many policy implications. To realize the health-related SDGs, there should be a particular focus on the poor-performing states of India. A state-specific plan should be implemented to advance the progress in improving indicators of health. The NHM, which has been instrumental in realizing some of the health-related goals, should continue. Efforts should be made to strengthen the database by collecting comprehensive information on non-communicable diseases. Increasing public health spending to 2.5% of GDP, as stipulated in the National Health Policy 2017, should be realized.
Acknowledgment
The authors express their gratitude to the reviewers and the editorial board of the Journal of Biosocial Science.
Ethical Approval. The study research was based on secondary data from open sources so no ethical clearance was required.
Conflict of Interests. The authors have no conflicts of interest to declare.
Funding. This research received no specific grant from any funding agency or institution.