1 Introduction
In this study we considered the local behaviour of the three-dimensional (3D) Navier–Stokes flow near a saddle point (with hyperbolic flow configuration) and no-slip flat boundary. The Navier–Stokes equations with no-slip flat boundary are expressed as
 $$\begin{eqnarray}\displaystyle \left.\begin{array}{@{}c@{}}\displaystyle \partial _{t}\boldsymbol{v}+(\boldsymbol{v}\boldsymbol{\cdot }\boldsymbol{{\rm\nabla}})\boldsymbol{v}-{\it\nu}{\rm\Delta}\boldsymbol{v}+\boldsymbol{{\rm\nabla}}p=0\quad \text{in}~\mathbb{R}_{+}^{3}\times [0,T),\\ \displaystyle \boldsymbol{v}_{\mathbf{0}}=\boldsymbol{v}|_{t=0},\quad \boldsymbol{v}|_{\partial \mathbb{R}_{+}^{3}}=0,\quad \boldsymbol{{\rm\nabla}}\boldsymbol{\cdot }\boldsymbol{v}=0\quad \text{in}~\mathbb{R}_{+}^{3}\times [0,T),\end{array}\right\} & & \displaystyle\end{eqnarray}$$
where
 $\boldsymbol{v}$
is a vector field representing the velocity of the fluid, and
 $p$
is the pressure. We will use bold to denote vector-valued functions throughout this paper. The term ‘hyperbolic flow configuration’ used hereafter can be defined in cylindrical polar coordinates as follows: there is
 ${\it\delta}>0$
(depending on
 $t$
) such that
 $v_{z}>0$
,
 $v_{r}<0$
, or
 $v_{z}<0$
,
 $v_{r}>0$
for
 $0<r<{\it\delta}$
and
 $0<z<{\it\delta}$
, where
 $v_{z}$
and
 $v_{r}$
represent the axial and radial components of velocity
 $\boldsymbol{v}$
. A simple modification is required for defining a two-dimensional (2D) hyperbolic flow configuration.
Recently, the Euler flow with a saddle point (with hyperbolic flow configuration) has been extensively studied. Bourgain & Li (Reference Bourgain and Li2015a
) obtained strong local ill-posedness results in the Sobolev spaces
 $W^{n/p+1,p}$
for any
 $1<p<\infty$
and in the Besov spaces
 $B_{p,q}^{n/p+1}$
with
 $1<p<\infty$
and
 $1<q\leqslant \infty$
and
 $n=2$
or
 $3$
by using a combination of Lagrangian and Eulerian techniques with a saddle point (with hyperbolic flow configuration) structure. In particular, they settled the borderline Sobolev case
 $H^{n/2+1}$
. After that Elgindi & Masmoudi (Reference Elgindi and Masmoudi2014) and Bourgain & Li (Reference Bourgain and Li2015b
) produced similar results for the
 $C^{1}$
case (also the
 $C^{m}$
case). On the other hand, Kiselev & Sverak (Reference Kiselev and Sverak2014) (also refer to Itoh, Miura & Yoneda (Reference Itoh, Miura and Yoneda2014), Kiselev & Zlatos (Reference Kiselev and Zlatos2015) and Xu (Reference Xu2014) for related topics) showed a 2D Euler flow with a saddle point (with hyperbolic flow configuration) in a disk for which the gradient of vorticity exhibited a double-exponential growth in time for all times. Their estimate is known to be sharp, namely, the double-exponential growth is the fastest possible growth rate. These results show that the saddle point (with hyperbolic flow configuration) causes some type of unstabilizing effects.
In the next part of § 1, for the convenience of readers belonging to different research fields, the related results are organized as follows. First, we introduce results obtained from mathematical analysis, and then discuss the research on tornado-like vortices. Finally, we provide several references of related literature in each research field (mathematical analysis, numerical analysis and research on tornadoes) for the convenience of readers.
In the following four paragraphs, we introduce classical regularity results and a new regularity criterion on the direction of vorticity for 3D Navier–Stokes flow, and then introduce recent results on the hyperbolic flow structure considered in the axisymmetric Navier–Stokes (or Euler) system.
Let us briefly look back at the history of the 3D Navier–Stokes equations. Modern regularity theory for solutions to the Navier–Stokes equations began with the works of Leray (Reference Leray1934) and Hopf (Reference Hopf1951). They showed the existence of a weak solution
 $\boldsymbol{v}:[0,\infty )\times \mathbb{R}^{3}\rightarrow \mathbb{R}^{3}$
lying in the class of
 $L^{\infty }(0,\infty ;L^{2}(\mathbb{R}^{3}))\cap L^{2}(0,\infty ;{\dot{H}}^{1}(\mathbb{R}^{3}))$
, which satisfies the global energy inequality, where
 ${\dot{H}}^{1}$
is a homogeneous Sobolev space with degree one.
After that, work by Prodi (Reference Prodi1959), Serrin (Reference Serrin1963) and Ladyzhenskaya (Reference Ladyzhenskaya1967), and their joint efforts, led to the following Prodi–Serrin–Ladyzhenskaya criterion for the Leray–Hopf weak solutions.
Theorem 1.1 (Prodi–Serrin–Ladyzhenskaya).
Let
 $\boldsymbol{v}\in L^{\infty }(0,\infty ;L^{2}(\mathbb{R}^{3}))\cap L^{2}(0,\infty ;{\dot{H}}^{1}(\mathbb{R}^{3}))$
be a Leray–Hopf weak solution to (1.1), which also satisfies
 $\boldsymbol{v}\in L^{p}(0,T;L^{q}(\mathbb{R}^{3}))$
, for some
 $p,q$
satisfying
 $2/p+3/q=1$
, with
 $q>3$
. Then, the solution
 $\boldsymbol{v}$
is smooth and unique on
 $(0,T]\times \mathbb{R}^{3}$
.
It is also worthwhile to mention that the exceptional case of
 $\boldsymbol{v}\in L^{\infty }(L^{3})$
was finally established in the work of Escauriaza, Seregin & Sverak (Reference Escauriaza, Seregin and Sverak2003). After the appearance of the Prodi–Serrin–Ladyzhenskaya criterion, many different regularity criteria for solutions to (1.1) were established by different researchers working on the regularity theory of (1.1). For example, a regularity criterion along streamlines (characteristic curves) was constructed (see Chan & Yoneda Reference Chan and Yoneda2012). Besides these, other important works have attracted much attention, such as Giga, Hsu & Maekawa (Reference Giga, Hsu and Maekawa2014) – in which type I blow-up was excluded for solutions to (1.1) under a regularity condition on the direction of vorticity in the half space with no-slip boundary condition (see also Constantin & Fefferman (Reference Constantin and Fefferman1993), which is the pioneering work in this field) – and Chen et al. (Reference Chen, Strain, Tsai and Yau2009) and Koch et al. (Reference Koch, Nadirashvili, Seregin and Sverak2009) for axisymmetric solutions to (1.1) – the equation for the axisymmetric case can be rewritten as (1.3) – in the whole space. We now recall that a singularity of a Navier–Stokes solution
 $\boldsymbol{v}$
at a time
 $T$
is called type I if
 $$\begin{eqnarray}\sup _{\boldsymbol{x}}|\boldsymbol{v}(\boldsymbol{x},t)|\leqslant \frac{C}{\sqrt{T-t}}\end{eqnarray}$$
for some
 $C>0$
, where
 $\boldsymbol{x}=(x_{1},x_{2},z)$
denotes a space variable in Cartesian coordinates. If the singularity of
 $\boldsymbol{v}$
does not satisfy condition (1.2), then the singularity is called a type II singularity (refer to Koch et al. (Reference Koch, Nadirashvili, Seregin and Sverak2009) for the type of singularity). The axisymmetric Navier–Stokes equations are expressed as
 $$\begin{eqnarray}\displaystyle \left.\begin{array}{@{}c@{}}\displaystyle \partial _{t}u_{r}+u_{r}\partial _{r}u_{r}+u_{z}\partial _{z}u_{r}-\frac{{u_{{\it\theta}}}^{2}}{r}+\partial _{r}p={\it\Delta}u_{r}-\frac{u_{r}}{r^{2}},\\ \displaystyle \partial _{t}u_{{\it\theta}}+u_{r}\partial _{r}u_{{\it\theta}}+u_{z}\partial _{z}u_{{\it\theta}}+\frac{u_{r}u_{{\it\theta}}}{r}={\it\Delta}u_{{\it\theta}}-\frac{u_{{\it\theta}}}{r^{2}},\\ \displaystyle \partial _{t}u_{z}+u_{r}\partial _{r}u_{z}+u_{z}\partial _{z}u_{z}+\partial _{z}\,p={\it\Delta}u_{z},\\ \displaystyle \frac{\partial _{r}(ru_{r})}{r}+\partial _{z}u_{z}=0,\end{array}\right\} & & \displaystyle\end{eqnarray}$$
where
 $u_{r}=u_{r}(r,z,t)$
,
 $u_{{\it\theta}}=u_{{\it\theta}}(r,z,t)$
,
 $u_{z}=u_{z}(r,z,t)$
and
 ${\it\Delta}=\partial _{r}^{2}+(1/r)\partial _{r}+\partial _{z}^{2}$
. The vector-valued function
 $\boldsymbol{v}:=u_{r}e_{r}+u_{{\it\theta}}e_{{\it\theta}}+u_{z}e_{z}$
with
 $e_{r}:=(1/\sqrt{x_{1}^{2}+x_{2}^{2}})(x_{1},x_{2},0)$
,
 $e_{{\it\theta}}:=(1/\sqrt{x_{1}^{2}+x_{2}^{2}})(-x_{2},x_{1},0)$
and
 $e_{z}=(0,0,1)$
represents the velocity of the fluid, and
 $p$
is the pressure.
It is known that axisymmetric solutions for flows with no swirl (namely,
 $u_{{\it\theta}}\equiv 0$
) have to be regular (see Ladyzhenskaya Reference Ladyzhenskaya1968; Ukhovskii & Iudovich Reference Ukhovskii and Iudovich1968; Koch et al.
Reference Koch, Nadirashvili, Seregin and Sverak2009). On the other hand, Caffarelli, Kohn & Nirenberg (Reference Caffarelli, Kohn and Nirenberg1982) showed that the axisymmetric Navier–Stokes solution could only blow up on the axis.
Choi et al. (Reference Choi, Hou, Kiselev, Luo, Sverak and Yao2014) considered a one-dimensional (1D) transport equation with an additional variable that comes from the square of the swirl component
 $u_{{\it\theta}}$
of the velocity field in the 3D axisymmetric Euler flow. They showed that the transport equation can exhibit finite-time blow-up from smooth initial data by using an argument by contradiction, and they concluded that, in a 3D axisymmetric Euler flow, the best chance for possible singularity formation seemed to be at the hyperbolic saddle (see also Luo & Hou Reference Luo and Hou2014). Indeed, the finite-time singularity numerically identified in Luo & Hou (Reference Luo and Hou2014) is located on the solid wall (lateral surface) of the cylinder, and the cylindrical domain considered by these authors is periodic in
 $z$
(the axial direction), which means that no ‘flat boundary’ has been used to truncate the domain. Nevertheless, the special symmetries imposed in Luo & Hou (Reference Luo and Hou2014) forced the normal velocity component (
 $u_{z}$
) of the flow to vanish on
 $z=0$
, effectively turning the plane into an ‘impermeable wall’ through which no fluid particle can pass. The 1D model considered in Choi et al. (Reference Choi, Hou, Kiselev, Luo, Sverak and Yao2014) can be viewed as a projection of the 3D Euler equations onto the solid wall. It tried to model the hyperbolic saddle lying at the intersection of the solid wall and the symmetry plane
 $z=0$
. On the other hand, Kang (Reference Kang2004) constructed a regularity theory. More precisely, suitable weak solutions of the 3D axisymmetric Navier–Stokes flow in a half space without swirl are Hölder-continuous up to the boundary except for the origin. His result suggests that, even in the case of the Navier–Stokes flow, the best possible position of singularity formation may be at the saddle point.
Although there are many fruitful results based on mathematical analysis, as mentioned above, it is not easy to locally analyse such fluid mechanics in order to go a step further mathematically. Thus, it would be effective to attempt a numerical approach.
Besides, from the above mathematical literature, the saddle point seems to be a key place and the hyperbolic flow with swirl might be a key structure. Actually, the swirl ratios are very significant in the research on tornadoes (see Wan & Ding Reference Wan and Ding2005; Ishihara, Oh & Tokuyama Reference Ishihara, Oh and Tokuyama2011; Nolan Reference Nolan2012; Ishihara & Liu Reference Ishihara and Liu2014). There are several methods for studying tornadoes. Although studies on real tornadoes that occur outdoors and simulated tornadoes in the laboratory are also important, numerical simulations provide a safe and cost-effective way to analyse the behaviour of tornadoes. We concentrate on numerical computation for the swirl case and the behaviour near the axis of symmetry (saddle point) at the boundary. From a mathematical point of view, the saddle point causes some type of unstabilizing effects. From the point of view of studies on tornadoes, the behaviour inside the core of a tornado (the centre region near the
 $z$
-axis) is significant and might be very different compared to the behaviour outside the core. The behaviour near the ground (lower boundary) is also very significant for preventing damage caused by tornadoes. Our numerical result can be compared with the mathematical literature (especially regularity results; see Constantin & Fefferman Reference Constantin and Fefferman1993; Giga et al.
Reference Giga, Hsu and Maekawa2014) and also with two-celled vortex structures in the research on tornadoes (especially numerical simulations). For more references, the reader should refer to Giga et al. (Reference Giga, Hsu and Maekawa2014) for regularity results, to Luo & Hou (Reference Luo and Hou2014) for numerical studies of the Navier–Stokes and Euler equations, and to Nolan (Reference Nolan2012) and Ishihara & Liu (Reference Ishihara and Liu2014) for studies on tornado-like vortices.
In the next section, we will describe the numerical computation used to observe the differences between the swirl case and the no-swirl case. We also show that the maximum value of
 $|\boldsymbol{v}|$
occurs at the place near the axis of symmetry (saddle point) and the boundary when the time approaches the critical turning point (
 $t=0.35$
and
 $t=1.0$
) (refer to figures 1–7, especially figure 7).
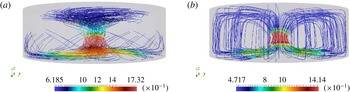
Initial data for
 $a=1/8$
: (a) swirl, and (b) no swirl.

2 Setting of the initial data and numerical results for the axisymmetric Navier–Stokes flow
In this section we set the initial data of the axisymmetric Navier–Stokes flow with a saddle point (with hyperbolic flow configuration). We compared two flows: the swirl (
 $u_{{\it\theta}}\not \equiv 0$
) and no-swirl (
 $u_{{\it\theta}}\equiv 0$
) cases. In our numerical computation, we used the cylindrical domain
 ${\it\Omega}$
,
 $$\begin{eqnarray}{\it\Omega}:=\left\{\boldsymbol{x}=(x_{1},x_{2},z)\in \mathbb{R}^{3}:-a<z<4a,\sqrt{x_{1}^{2}+x_{2}^{2}}<1\right\},\end{eqnarray}$$
and imposed the no-slip boundary condition,
 $$\begin{eqnarray}\boldsymbol{v}=0\quad \text{on}~\partial {\it\Omega}.\end{eqnarray}$$
We set the initial data in the following manner (see also figure 1 and Remark 2.2). We let
 ${\it\varphi}(a,{\it\epsilon},{\it\sigma})=(a^{2}+{\it\epsilon})^{{\it\sigma}}$
, and we set the initial velocity for the swirl case as follows:
 $$\begin{eqnarray}\displaystyle & \displaystyle u_{z}={\it\varphi}(r,{\it\epsilon}_{1},-{\it\beta}_{1}){\it\varphi}(z,{\it\epsilon}_{2},-{\it\beta}_{2}), & \displaystyle\end{eqnarray}$$
 $$\begin{eqnarray}\displaystyle & \displaystyle {\it\rho}={\it\varphi}(r,{\it\epsilon}_{3},-{\it\beta}_{3}){\it\varphi}(z,{\it\epsilon}_{4},{\it\beta}_{4}), & \displaystyle\end{eqnarray}$$
 $$\begin{eqnarray}\displaystyle & \displaystyle u_{r}=\text{sign}(z){\it\rho}u_{z}, & \displaystyle\end{eqnarray}$$
 $$\begin{eqnarray}\displaystyle & \displaystyle u_{{\it\theta}}={\it\varphi}(r,{\it\epsilon}_{5},-{\it\beta}_{5}){\it\varphi}(z,{\it\epsilon}_{6},-{\it\beta}_{6}), & \displaystyle\end{eqnarray}$$
where
 ${\it\epsilon}_{i}$
and
 ${\it\beta}_{i}$
(
 $i=1,2,\ldots ,6$
) are constants. In the following numerical calculation, we set all
 ${\it\epsilon}_{i}$
and
 ${\it\beta}_{i}$
equal to 1. As for the no-swirl case, we only changed the term
 $u_{{\it\theta}}$
to zero.
Remark 2.1. By our setting of the initial data, the initial magnitude of velocity
 $|\boldsymbol{v}|$
at
 $(x_{1},x_{2},z)=(0,0,0)$
(we call this point the centre of the initial velocity) was larger than those at other places. The phenomena observed in this study were more clear when the centre of the initial velocity is close to the lower boundary (but not on the boundary). This is the reason for our choice of the computational domain
 ${\it\Omega}$
like (2.1) instead of a symmetric one. Please refer to the Appendix for a comparison between the behaviours of the two different centres.
Let
 ${\it\tau}>0$
be a time increment of the computation and
 $h>0$
a (representative) mesh size. We performed the computation by using a stabilized Lagrange–Galerkin (finite element) scheme (Notsu Reference Notsu2008; Notsu & Tabata Reference Notsu and Tabata2008, Reference Notsu and Tabata2015a
,Reference Notsu and Tabata
b
) based on the idea
 $$\begin{eqnarray}\displaystyle & \displaystyle \frac{1}{{\it\tau}}\{\boldsymbol{v}^{k}(\boldsymbol{x})-\boldsymbol{v}^{k-1}(\boldsymbol{x}-\boldsymbol{v}^{k-1}(\boldsymbol{x}){\it\tau})\}-\frac{1}{Re}{\rm\Delta}\boldsymbol{v}^{k}+\boldsymbol{{\rm\nabla}}p^{k}=0, & \displaystyle\end{eqnarray}$$
 $$\begin{eqnarray}\displaystyle & \displaystyle \boldsymbol{{\rm\nabla}}\boldsymbol{\cdot }\boldsymbol{v}^{k}-{\it\delta}_{0}h^{2}{\rm\Delta}p^{k}=0, & \displaystyle\end{eqnarray}$$
 $k=1,2,\ldots$
, where
 $\boldsymbol{v}(\boldsymbol{x},k{\it\tau})$
is simply denoted by
 $\boldsymbol{v}^{k}(\boldsymbol{x})$
,
 $Re$
is the Reynolds number, and the stabilization parameter is set as
 ${\it\delta}_{0}=1$
. We note that, under some conditions, the scheme has mathematical convergence properties of order
 $O({\it\tau}+h)$
for the velocity in
 $H^{1}({\it\Omega})$
and for the pressure in
 $L^{2}({\it\Omega})$
and of order
 $O({\it\tau}+h^{2})$
for the velocity in
 $L^{2}({\it\Omega})$
. The maximum, minimum and average mesh sizes were
 $1.88\times 10^{-2}$
,
 $1.48\times 10^{-3}$
and
 $8.95\times 10^{-3}$
, respectively, where the mesh size around the
 $z$
-axis was smaller than that of the other part. The time increment was set as
 ${\it\tau}=1.25\times 10^{-2}$
. In the following sections, we show only the numerical results obtained using the mesh size and the time increment mentioned above, where the numerical results with a coarser mesh size and a larger time increment were qualitatively similar. Refer to the Appendix for the discussion on the dependence of the numerical results on the discretization parameters
 $h$
and
 ${\it\tau}$
.
Remark 2.2. The initial velocities for the swirl and no-swirl cases did not satisfy the divergence-free and no-slip boundary conditions. The computational velocities after the first time step, however, satisfied both the conditions numerically, where the former condition was satisfied in the sense that (2.7b ) held. The structure of the initial data is useful for observing the swirling flow. It is also reasonable to consider the initial data (2.3)–(2.6) as a pre-stage, and the velocities after the first time step as real initial velocity in the numerical computation. Although this construction of the initial data is useful for observing phenomena in numerical approaches before the construction of more smooth initial data, a more careful choice of the initial data is desirable for mathematical analysis.
Remark 2.3. The axial symmetry was not explicitly imposed in the 3D numerical computation by the stabilized Lagrange–Galerkin scheme, while the problem setting including the initial velocity had symmetry. We performed the computation in order to show the qualitative properties of the effect of swirl.
The figures show the numerical results obtained in our study for
 $a=1/8$
and
 $Re=1000$
, 5000, 10 000 and 50 000. Hereafter, we call the point at which the maximum value of
 $|\boldsymbol{v}|$
was attained as ‘the maximum point of
 $|\boldsymbol{v}|$
’ and the cross-section
 $\{\boldsymbol{x}\in {\it\Omega}:x_{1}=0\}$
as simply ‘the plane
 $x_{1}=0$
’.
Graphs of (a) the maximum value of
 $|\boldsymbol{v}|$
versus
 $t$
and (b) the distance from the maximum point of
 $|\boldsymbol{v}|$
to the
 $z$
-axis versus
 $t$
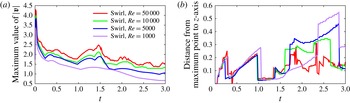
for the swirl case with Reynolds numbers 50 000 (red), 10 000 (green), 5000 (blue) and 1000 (purple).

Graphs of (a) the maximum value of
 $|\boldsymbol{v}|$
versus
 $t$
and (b) the distance from the maximum point of
 $|\boldsymbol{v}|$
to the
 $z$
-axis versus
 $t$
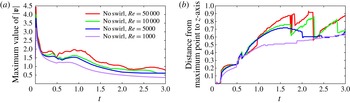
for the no-swirl case with Reynolds numbers 50 000 (red), 10 000 (green), 5000 (blue) and 1000 (purple).

Figure 2 shows the graphs of maximum values of
 $|\boldsymbol{v}|$
versus time
 $t$
and the distance from the maximum point of
 $|\boldsymbol{v}|$
to the
 $z$
-axis versus time
 $t$
for the swirl case, where four colours are used for the graphs of
 $Re=50\,000$
(red), 10 000 (green), 5000 (blue) and 1000 (purple). Figure 3 expresses the corresponding graphs for the no-swirl case. From figures 2 and 3 we can see that different phenomena occur in the swirl and no-swirl cases. The typical phenomenon observed in the swirl case is the drastic changes of the distance from the maximum point of
 $|\boldsymbol{v}|$
to the
 $z$
-axis at approximately
 $t=0.35$
and 1.0, which is not observed in the no-swirl case. The difference becomes clearer for a higher-Reynolds-number flow. In order to understand the difference, we display time evolutions of velocity on the plane
 $x_{1}=0$
for both cases with
 $Re=50\,000$
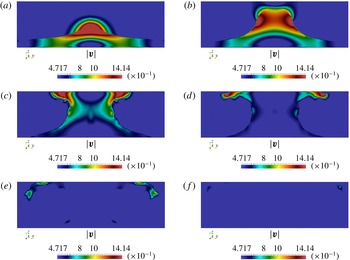
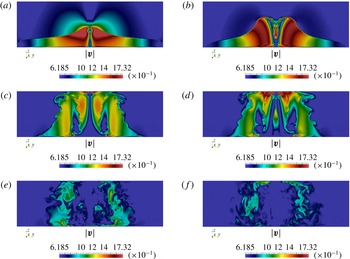
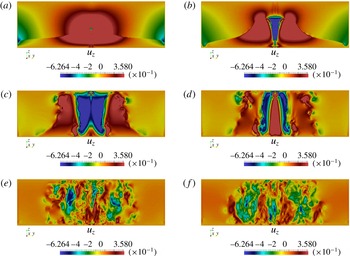
in figures 4–6. Figures 4 and 5 show the time evolutions of
 $|\boldsymbol{v}|$
on the plane for the no-swirl and swirl cases, respectively, and figure 6 exhibits the time evolution of the axial velocity
 $u_{z}$
(
 $z$
-component of
 $\boldsymbol{v}$
) for the swirl case. They imply that the flow dissipates in a straightforward manner as
 $t$
increases in the no-swirl case and that an interesting flow structure is observed near the
 $z$
-axis in the swirl case.
Time evolution of the velocity magnitude
 $|\boldsymbol{v}|$
on the plane
 $x_{1}=0$
for the no-swirl case with
 $Re=50\,000$
:
 $t=0.1$
(a), 0.3 (b), 0.7 (c), 1.1 (d), 1.7 (e) and 3.0 (f).

Time evolution of the velocity magnitude
 $|\boldsymbol{v}|$
on the plane
 $x_{1}=0$
for the swirl case with
 $Re=50\,000$
:
 $t=0.1$
(a), 0.3 (b), 1.0 (c), 1.3 (d), 2.3 (e) and 3.0 (f).

Time evolution of the axial velocity
 $u_{z}$
on the plane
 $x_{1}=0$
in the swirl case with
 $Re=50\,000$
:
 $t=0.1$
(a), 0.3 (b), 1.0 (c), 1.3 (d), 2.3 (e) and 3.0 (f). Note that the red and blue colours represent positive and negative values in this figure.

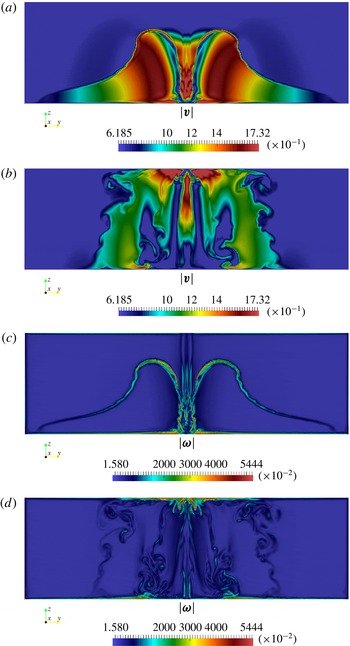
Contours on the plane
 $x_{1}=0$
of the velocity magnitude
 $|\boldsymbol{v}|$
at
 $t=0.4$
(a) and
 $t=1.4$
(b); and the vorticity magnitude
 $|{\bf\omega}|$
at
 $t=0.4$
(c) and
 $t=1.4$
(d) in the swirl case with
 $Re=50\,000$
.

From figures 2, 5 and 6 it can be observed that a downward flow arises near the
 $z$
-axis at approximately
 $t=0.3$
, and the maximum value of
 $|\boldsymbol{v}|$
is attained near the
 $z$
-axis and the lower boundary at approximately the same time
 $(t=0.3)$
. In addition, a new upward flow arises near the
 $z$
-axis at approximately
 $t=1.3$
, and the velocity attains its maximum value near the
 $z$
-axis and the upper boundary at approximately the same time
 $(t=1.3)$
.
Remark 2.4. The scale may be different in each figure. The red region represents a region of high magnitude.
3 Mathematical support for ‘increasing velocity near the axis of symmetry and the lower boundary’
When unstabilizing effects are observed (such as increasing velocity in the time evolution), it is better to compare with stabilizing effects (such as regularity results mentioned in the introduction). The Giga–Hsu–Maekawa criterion (Giga et al.
Reference Giga, Hsu and Maekawa2014, hereafter GHM criterion) was considered for the numerical computation described in the previous section. According to the GHM criterion (refer to (3.1) and also Giga et al. (Reference Giga, Hsu and Maekawa2014, theorem 1.3)), type I blow-up solutions to (1.1) do not exist under a continuous alignment condition on the vorticity direction in the half space with no-slip boundary condition. More precisely, if the direction of vorticity can be controlled at places where the absolute value of the vorticity is large, the flow is regular. Conversely, if we can construct solutions that do not satisfy such continuous conditions at those places, there is a better possibility to determine the clue for possible blow-up solutions. As even in this study we could not construct a blow-up solution, this kind of thought might help us in explaining or predicting some phenomena with unstabilizing effects (such as the increasing velocity phenomena in this study). It should be noted that in our numerical computation, even if the cylindrical domain was used instead of the half space, the behaviour near the centre of the lower (and upper) boundary is expected to be similar to the boundary of the half space under the same boundary condition. Now we provide mathematical support for why the maximum value is increasing near the saddle point on the boundary. Let
 $\bar{\boldsymbol{u}}=u_{{\it\theta}}e_{{\it\theta}}+u_{r}e_{r}$
and
 $\bar{\boldsymbol{u}}^{\bot }=u_{r}e_{{\it\theta}}-u_{{\it\theta}}e_{r}$
. We can calculate the vorticity on the boundary as
 ${\bf\omega}=\partial _{z}\bar{\boldsymbol{u}}^{\bot }$
. Note that
 $\partial _{z}u_{r}(r,0)\rightarrow 0$
as
 $r\rightarrow 0$
because of the symmetry. We can show that the direction of the vorticity
 ${\bf\omega}/|{\bf\omega}|$
is not continuous at the saddle point. In this case we need to assume
 $\partial _{z}u_{{\it\theta}}\neq 0$
(on the boundary) and
 $\partial _{r}u_{{\it\theta}}\neq 0$
(on the axis) near the saddle point. These non-zero conditions may express a ‘shear flow effect by the swirl’. The vorticity along the axis is expressed as
 ${\bf\omega}=2\partial _{r}u_{{\it\theta}}e_{z}$
. Thus
 ${\bf\omega}/|{\bf\omega}|$
along the
 $z$
-axis and on the boundary is not continuous. It breaks the following continuous alignment condition in the GHM criterion:
 $$\begin{eqnarray}\left|\frac{{\bf\omega}}{|{\bf\omega}|}(t,\boldsymbol{x})-\frac{{\bf\omega}}{|{\bf\omega}|}(t,\boldsymbol{y})\right|\leqslant {\it\rho}(|\boldsymbol{x}-\boldsymbol{y}|),\end{eqnarray}$$
where
 ${\it\rho}(|\boldsymbol{x}-\boldsymbol{y}|)$
is any modulus continuous function. However, this jump discontinuity in vorticity direction is irrelevant as far as phenomena with unstabilizing effects are concerned, since it takes place at a point where the vorticity
 ${\bf\omega}$
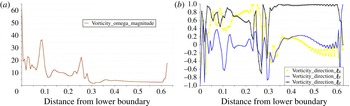
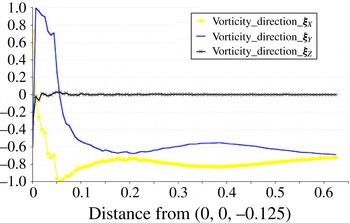
vanishes completely. Nevertheless, through numerical computations, we observe that there are high-vorticity regions near the saddle point and the boundary. We observe
 $|{\bf\omega}|$
and three components of
 ${\bf\xi}={\bf\omega}/|{\bf\omega}|$
under a line that contains a point
 $(0,0.05,-0.125)$
on the boundary and parallel to the
 $z$
-axis at
 $t=0.4$
, as shown in figure 8 (figure 9 shows the case where the line is parallel to the
 $x_{2}$
-axis). The bottom axis in figure 8 represents the distance from the lower boundary, while the bottom axis in figure 9 represents the distance from the saddle point. It should be noted that the coordinate of the saddle point is
 $(0,0,-0.125)$
and the axial velocity
 $u_{z}=0$
on the boundary. At the point
 $(0,0.05,-0.125)$
on the boundary, the magnitude of the vorticity
 $|{\bf\omega}|$
is 60, and it clearly attains the maximum value along the line in figure 8. Moreover
 ${\bf\omega}/|{\bf\omega}|$
also changes drastically (highly oscillating) near the boundary (see figures 8 and 9). It shows some type of instability of
 ${\bf\xi}$
at the location where the magnitude of the vorticity is large.
Graphs of
 $|{\bf\omega}|$
(a) and three components of
 ${\bf\xi}$
(b) at
 $t=0.4$
on the line parallel to the
 $z$
-axis through the point
 $(0,0.05,-0.125)$
.

Graph of three components of
 ${\bf\xi}$
at
 $t=0.4$
on the line parallel to the
 $x_{2}$
-axis through the point
 $(0,0.05,-0.125)$
.

4 Conclusion
From the literature, it is natural to consider that hyperbolic flow with swirl might be the key structure of flow and that a saddle point at the boundary might be the probable place for instability effects to occur near the no-slip flat boundary. We showed a clear structure of axisymmetric hyperbolic flow with swirl and observed the following phenomena that are distinctly different from those without swirl. (1) The distance between the maximum point of the velocity and the
 $z$
-axis changed drastically at a specific time; we called it the turning point. (2) The velocity increased and attained its maximum value near the axis of symmetry and the boundary when the time was close to the turning point. The comparison of these results with studies on tornadoes might help in understanding the behaviour of the velocity of wind near the ground, which is very significant in research on tornadoes for reducing the damage caused by tornadoes or similar phenomena. (3) The downward flow near the
 $z$
-axis was observed (refer to figure 6, the time evolution diagram). The downward wind inside the core of a real tornado was also observed in a two-celled vortex structure in the studies of numerical simulations for time-averaged velocity, as shown in Ishihara et al. (Reference Ishihara, Oh and Tokuyama2011, figure 4b). By comparing our observation with studies on tornadoes, we might enhance our understanding about the behaviour inside the core of a tornado for a high swirl ratio. Furthermore, we also observed the properties of vorticity and its directions (refer to § 3), on which there are only a few studies in the literature of the numerical simulations of tornadoes. Those phenomena might be clues for helping us understand the behaviour near the saddle point and near the boundary. Moreover, our numerical approach might be helpful for other boundary shapes and other equations related to fluid mechanics in future work. It might be useful for studies on tornadoes that arise or pass by different landforms instead of a flat plane.
Acknowledgements
First, we would like to thank the anonymous referees for carefully reading our manuscript and providing valuable comments especially on the literature (Luo & Hou Reference Luo and Hou2014). We would like to extend our great gratitude to Professor N. Saito for giving us valuable suggestions on the construction of the initial data. We are also grateful to Professor V. Sverak for letting us know about interesting literature (Kang Reference Kang2004; Choi et al. Reference Choi, Hou, Kiselev, Luo, Sverak and Yao2014). P.-Y.H. and T.Y. are supported by the ‘Program to Promote the Tenure Track System’ of the Ministry of Education, Culture, Sports, Science and Technology. Moreover, P.-Y.H. gratefully acknowledges the support of the Iwanami Fujukai Foundation. H.N. is supported by JSPS KAKENHI grant nos 26800091 and 24224004, by JSPS the Japanese–German Graduate Externship (Mathematical Fluid Dynamics) and by Waseda University Project research of Research Institute for Science and Engineering. T.Y. is partially supported by JSPS KAKENHI grant no. 25870004. The numerical computation is based on the Master’s thesis of Mr H. Ishida at Hokkaido University in March 2014. This paper was developed during P.-Y.H.’s stay at Tokyo Institute of Technology. This research was supported by JST, CREST.
Appendix
Here, we present additional numerical results in order to show two observations: the first is that the dependence of the numerical results described in § 2 on the discretization parameters
 $h$
and
 ${\it\tau}$
is qualitatively small; and the second observation describes the reason behind the choice of the range of
 $z$
in
 ${\it\Omega}$
, i.e.
 $-a<z<4a$
.
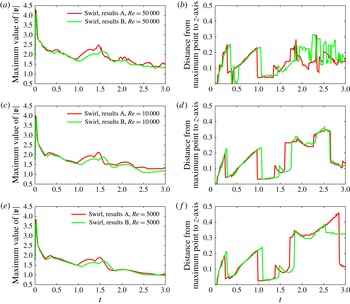
Graphs of (a,c,e) the maximum values of
 $|\boldsymbol{v}|$
versus
 $t$
and (b,d,f) the distance from the maximum point of
 $|\boldsymbol{v}|$
to the
 $z$
-axis versus
 $t$
in the swirl case for
 $Re=50\,000$
(a,b), 10 000 (c,d) and 5000 (e,f), where the red and green colours are employed for results A and results B, respectively.

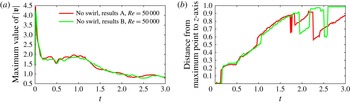
Graphs of (a) the maximum values of
 $|\boldsymbol{v}|$
versus
 $t$
and (b) the distance from the maximum point of
 $|\boldsymbol{v}|$
to the
 $z$
-axis versus
 $t$
in the no-swirl case for
 $Re=50\,000$
, where the red and green colours are employed for results A and results B, respectively.

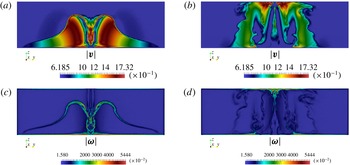
Contours on the plane
 $x_{1}=0$
of the velocity magnitude
 $|\boldsymbol{v}|$
(a,b) and the vorticity magnitude
 $|{\bf\omega}|$
(c,d) for the swirl case with
 $Re=50\,000$
for results B, at
 $t=0.4$
(a,c) and 1.4 (b,d).

Graphs of (a) the maximum values of
 $|\boldsymbol{v}|$
versus
 $t$
and (b) the distance from the maximum point of
 $|v|$
to the
 $z$
-axis versus
 $t$
in the swirl case for
 $Re=50\,000$
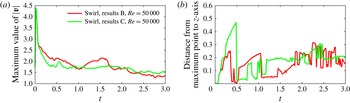
, where the red and green colours are employed for results B and results C, respectively.

First, we consider the former observation. We computed the no-swirl and swirl cases for
 $Re=50\,000$
, 10 000 and 5000 by using the stabilized Lagrange–Galerkin scheme with a coarse mesh and a large time increment. The maximum, minimum and average mesh sizes of the coarse mesh were
 $2.48\times 10^{-2}$
,
 $1.93\times 10^{-3}$
and
 $1.20\times 10^{-2}$
, respectively, where the strategy of the mesh generation was the same, i.e. the mesh size around the
 $z$
-axis was smaller than that of the other part. The time increment was set as
 ${\it\tau}=1.66\times 10^{-2}$
. Hereafter, we denote the numerical results described in § 2 as ‘results A’ and the numerical results obtained using the coarse mesh and the large time increment as ‘results B’. We compared results B with results A for
 $Re=50\,000$
, 10 000 and 5000. Figure 10 shows graphs of maximum values of
 $|\boldsymbol{v}|$
versus
 $t$
and the distance from the maximum point of
 $|\boldsymbol{v}|$
to the
 $z$
-axis versus
 $t$
in the swirl case for
 $Re=50\,000$
(a,b), 10 000 (c,d) and 5000 (e,f), where the red and green colours are employed for results A and results B, respectively. Figure 11 displays the corresponding graphs for the no-swirl case for
 $Re=50\,000$
. From figures 10 and 11, we can see that the two graphs in each figure are qualitatively similar, while there is a quantitative difference. Here, the graphs for
 $Re=10\,000$
and 5000 for the no-swirl case are omitted, since they are also qualitatively similar. We display additional information of results B in figure 12, which shows the contours of
 $|\boldsymbol{v}|$
(a,b) and
 $|{\bf\omega}|$
(c,d) on the plane
 $x_{1}=0$
at
 $t=0.4$
(a,c) and 1.4 (b,d), for
 $Re=50\,000$
in the swirl case. By comparing figure 7 (results A) with figure 12 (results B) we can see that the behaviour of the two graphs is almost similar, although the magnitudes are slightly different. These results imply the former observation, i.e. the dependence of the numerical results in § 2 on the discretization parameters
 $h$
and
 ${\it\tau}$
is qualitatively small.
Now we consider the latter observation. Let
 ${\it\Omega}^{\prime }$
be a domain defined by
 ${\it\Omega}^{\prime }:=\{(x_{1},x_{2},z)\in \mathbb{R}^{3}:-5a/2<z<5a/2,\sqrt{x_{1}^{2}+x_{2}^{2}}<1\}$
. We note that the centres of
 ${\it\Omega}$
and
 ${\it\Omega}^{\prime }$
are
 $(0,0,3a/2)$
and the origin, respectively. We computed the swirl case in the domain
 ${\it\Omega}^{\prime }$
for
 $Re=50\,000$
by using the stabilized Lagrange–Galerkin scheme with a coarse mesh and a large time increment, where the initial data were set by the same functions in (2.3)–(2.6). The mesh sizes and the time increment were the same as those used in results B. (The mesh was generated by a translation of the mesh for results B.) We denote the numerical results as ‘results C’. We compare results C with results B in figure 13, which shows the graphs of the maximum values of
 $|\boldsymbol{v}|$
versus
 $t$
and the distance from the maximum point of
 $|\boldsymbol{v}|$
to the
 $z$
-axis versus
 $t$
in the swirl case for
 $Re=50\,000$
, where the red and green colours are employed for results B and results C, respectively. It is observed that the ‘increasing velocity phenomenon’ in results B is clearer than that in results C, and that drastic changes of the distance from the maximum point of
 $|\boldsymbol{v}|$
to the
 $z$
-axis are observed in both the results. Hence,
 ${\it\Omega}$
is better than
 ${\it\Omega}^{\prime }$
in order to observe both the ‘increasing velocity phenomenon’ and ‘drastic changes’. These results explain the reason behind the choice of the range of
 $z$
in
 ${\it\Omega}$
,
 $-a<z<4a$
.