Introduction
There is a wealth of evidence indicating that aging involves brain changes such as reduced gray matter density and disturbance of structural and functional connectivity (e.g. Raz, Reference Raz, Dixon, Bäckman and Nilsson2004). These changes associated with aging are responsible for the cognitive decline observed in several cognitive domains (Dixon et al., Reference Dixon, Bäckman and Nilsson2004). More specifically, aging has a salient effect on fluid cognitive abilities (e.g. speed, reasoning, short-term memory) and episodic memory. However, there is a considerable inter-individual variability in age-related cognitive decline. While some people experience a steeper cognitive decline, others maintain good cognitive abilities even at an advanced age (Berkman et al., Reference Berkman1993). Similarly, some older adults who showed no signs of cognitive decline prior to death had neuropathological features of advanced Alzheimer's disease in post-mortem brain examinations (Katzman et al., Reference Katzman1988).
These observations suggest the existence of factors that modulate the clinical impact of brain changes. It is within this context that the concept of “cognitive reserve” (CR; Stern, Reference Stern2002; Reference Stern2003) has been put forward to account for brain plasticity in older adults that may underlie the resilience to the effects of aging or pathology (e.g. Alzheimer's disease) on cognitive abilities. The notion of CR suggests that the central nervous system can maintain its optimal performance over a longer period of time in individuals with certain lifestyle characteristics (e.g. high educational level, active lifestyle, complex work).
Two main models have been put forward to explain the discrepancy between severity of brain damage and clinical manifestations (Stern, Reference Stern2002): The passive and active hypotheses. The passive hypothesis postulates that differences in brain reserve capacity (i.e. the brain's ability to cope with damage) depend on quantitative anatomical features (e.g. the number of neurons and synaptic density). Therefore, individuals with a larger brain reserve (i.e. larger brain, more neurons, and synapses) could sustain more brain damage before clinical impairments arise. On the other hand, the active hypothesis is based on differences in how individuals process tasks rather than on their physiological differences. In this regard, CR could take the form of brain networks or cognitive paradigms that are more efficient or flexible. Thus, once normal aging or a pathological process occurs, individuals with a larger CR could tolerate more brain lesions by using alternative brain networks in order to successfully perform a cognitive task (Stern, Reference Stern2003).
As CR cannot be directly measured, it is commonly represented by indices related to life experience factors that are known to increase CR, and hence that might act as buffers against the effect of brain damage or pathology. Thus, the most commonly used proxies of CR include measures linked to environmental exposures, such as educational attainment, occupation, and participation in stimulating leisure activities. Numerous studies found that educational attainment is associated with cognitive functioning in older adults (for a review, see Anstey and Christensen, Reference Anstey and Christensen2000) and with a lower risk of developing dementia (for a review, see Meng and D'Arcy, Reference Meng and D'Arcy2012). In parallel, other factors such as intellectual ability in early life (e.g. Richards et al., Reference Richards, Shipley, Fuhrer and Wadsworth2004) and occupational attainment (e.g. Andel et al., Reference Andel, Kåreholt, Parker, Thorslund and Gatz2007) are also known to increase CR. Moreover, engagement in leisure activities during late adulthood (i.e. social, mental, physical engagement) may have beneficial effects on age-related cognitive decline (e.g. Small et al., Reference Small, Dixon, McArdle and Grimm2012) and on diminishing the risk of dementia (e.g. Akbaraly et al., Reference Akbaraly2009).
However, although CR has been the subject of extensive empirical studies, its conceptual bases remain relatively abstract and under-explored, as few tools (e.g. Nucci et al., Reference Nucci, Mapelli and Mondini2012; Leon et al., Reference Leon, García-García and Roldan-Tapia2014) have been developed to quantify the influence of multiple proxies of CR. To date, the vast majority of studies assessing CR have solely focused on a single CR proxy measure. Yet, CR is a dynamic construct resulting from a combination of environmental exposures over the lifespan (Stern, Reference Stern2002; Contador et al., Reference Contador, Bermejo-Pareja, Puertas-Martin and Benito-León2015b). Therefore, the use of only one factor to assess CR seems questionable, as it may reduce the accuracy of associated results (Jones et al., Reference Jones, Manly, Glymour, Rentz, Jefferson and Stern2011). Furthermore, one recent study (Foubert-Samier et al., Reference Foubert-Samier2012) suggested that multiple proxies of CR (education, occupation, and leisure activities) independently contribute to the development of CR, thus emphasizing the need to assess the different dimensions of CR. While a few studies have attempted to measure CR through the combination of some of its factors (Valenzuela and Sachdev, Reference Valenzuela and Sachdev2007; Nucci et al., Reference Nucci, Mapelli and Mondini2012; Leon et al., Reference Leon, García-García and Roldan-Tapia2014), none of them has assessed the most appropriate way to take into account these proxy measures of CR or the relative importance of each factor. For instance, the Cognitive Reserve Index questionnaire (CRIq) developed by Nucci et al. (Reference Nucci, Mapelli and Mondini2012) provides an estimation of CR that is based on experiences. This study divided a sample in three age groups (18–44, 45–69, 70–102 years old) and measured education by the number of years of schooling, combined with the number of training courses; the influence of occupation was represented by the number of working years multiplied by the cognitive level of the work, while leisure activities were quantified by the number of years and frequency (i.e. often/always) of practice of 16 activities. These three subscores were then averaged to obtain an overall score of CR. The researchers then attempted to validate this tool by using correlations and analyses of variance. Their main results were that two tests of intelligence (vocabulary test from the WAIS and reading test) were moderately correlated with the level of CR and that differences in CR could be observed between age groups (with the highest CRI in the adult group) and genders (higher level of CR among men). They finally concluded that their tool seemed to be a reliable for the estimation of CR.
Moreover, a recent meta-analysis involving 135 cross-sectional studies assessing the association between factors of CR and cognitive functioning (Opdebeeck et al., Reference Opdebeeck, Martyr and Clare2016) highlighted that different methods had been used to take into account CR proxies, which made comparisons between studies difficult. Their results showed that education was the most common proxy of CR, as it was reported in 109 studies (the most widely used indicator was the number of schooling years); occupational status was considered in 19 studies (among which 15 used the primary occupation), while 31 studies measured CR by the engagement in cognitively stimulating activities (the most common measure being the activities undertaken currently or during the last year) and only six studies combined proxy measures (four studies used education, leisure activities, and occupation, and two other studies used education and occupation).
Yet, as previously mentioned, a question that has largely remained unanswered in previous studies is whether it is more relevant to use a standard measure of CR, derived from the most common proxies (e.g. years of schooling), or a more detailed index taking into account a weighted combination of factors underlying CR. In this respect, for example, it has not been investigated whether it is more adequate to estimate educational level by the number of years of education or according to categories related to the diploma obtained. Furthermore, one could wonder whether educational level itself has an equivalent effect on the development of CR as occupational status.
It is within this perspective that we have developed the Index of Cognitive Reserve (ICR; inspired by the questionnaire of Nucci et al., Reference Nucci, Mapelli and Mondini2012), a retrospective self-report tool designed to comprehensively assess experiences and activities across the lifespan. The aim of the present study was to evaluate which method was the most appropriate for the estimation of CR, on the basis of a combination of its proxy measures (i.e. education, occupation, leisure activities). To do so, we developed two measures of CR: The standard index of CR (ICRs), derived from a traditional measurement method used in studies addressing CR (e.g. educational level determined by the number of years of education). Of note, here, is that the standard index stemmed from the observations reported in the meta-analysis of Opdebeeck et al. (Reference Opdebeeck, Martyr and Clare2016). A detailed index of CR (ICRd) was also created by considering all the relevant parameters for each proxy measure of CR and their relative importance in the equation (e.g. years of education should have a bigger weight than training courses for the calculation of the education proxy measure). These two indices of CR were then compared in order to determine which index best reflect one's CR in our sample of participants. Given that cognitive performances tend to decrease with advancing age, we postulated that the index that best reflected the level of reserve should be more strongly associated with the attenuations of the effect of age on cognition.
Method
Participants and data collection
The sample consisted of 204 French-speaking retired people (between 55 and 90 years of age) living in Belgium. Participants were recruited between 2013 and 2015 among various social groups and organizations for retired seniors in Belgium (e.g. University of the Third Age, social clubs, sports clubs) and by word of mouth. People who lived in institutions or with a history of any condition independently associated with impairments to a cognitive function (e.g. dementia, head injury requiring hospitalization, blindness, deafness, psychiatric disorder, depressive symptomatology, cerebrovascular disease) were excluded from the study. All participants received information regarding the study and informed consent was obtained. Research procedures had been reviewed and approved by the Ethics Committee of the University of Liège. A neuropsychological battery and the ICR questionnaire were administered by trained assessors at the participants’ home or at the Psychology of Aging Unit to establish the cognitive and CR profiles of participants. The list of medications taken by participants and sociodemographic information were also collected. Participants did not receive any compensation for participating in the study. The assessment process took approximately 2 hours to complete and was undertaken in a quiet room.
Index of cognitive reserve
The ICR tool was developed in order to comprehensively assess the levels and types of activities performed by participants throughout their life, and notably their educational and professional experiences. The tool includes questions about the demographic profile (date and place of birth, gender, place of residence, marital status, nationality, age of retirement), medical history (e.g. history of diabetes, cancer, medication, depressive symptomatology, anxiety), household income, educational and professional experiences, as well as leisure activities.
Educational attainment: Participants were asked to report their educational training path (e.g. title of each diploma, years of education, highest degree obtained) and training courses lasting at least six months. The following variables were taken into consideration in the analyses: number of years of education, number of training courses (> 6 months), and the educational degrees obtained. It should be noted that in the Belgian educational system, each educational level has to be validated by a diploma that gives access to the next level. Thus, we categorized education using a five-level variable: no diploma or primary diploma (equivalent to 0–6 years of schooling), lower secondary diploma (equivalent to 7–9 years of schooling), higher secondary certificate (equivalent to 10–12 years of schooling), short- and long-cycle higher education diploma (equivalent to 13–16 years of schooling), university education and PhD degree (over 17 years of schooling). The level “no diploma/primary school diplomaˮ was aggregated together since the “no diploma” category included only three participants. This category was then used as a reference class for comparison with the other educational levels.
Occupational path: Participants were asked to indicate on a timeline (chronological order) their professional career milestones and their working time regimes for each occupation. The following example was provided to the participants: Between 20 and 26 years old, I worked as a sales clerk (full-time job); then between 27 and 32 years old, I was the store manager (full-time job). I took a four-year career break when I was 32 to take care of my child, etc. Each occupational status was coded using the nine major group codes provided by the International Standard Classification of Occupations 2008 (ISCO-08). The categorization is as follows: 1–Managers; 2– Professionals; 3–Technicians and Associate Professionals; 4–Clerical Support Workers; 5–Service and Sales Workers; 6–Skilled Agricultural, Forestry, and Fishery Workers; 7–Craft and Related Trades Workers; 8–Plant and Machine Operators, and Assemblers; 9–Elementary Occupations; 0–Armed Forces Occupations. The definitions of groups and the index of occupational titles can be found elsewhere (International Labour and Office, 2012). Since our sample of participants was too small to be representative of all major groups, we narrowed down the ISCO-O8 coding to a four-level variable and a dichotomous variable. Specifically, the ISCO skill levels were used to classify participants’ professional activity according to the tasks and duties they performed, the nature of their work, their level of formal education, and their amount of informal training. Occupations in Major Group 1 (managers) correspond to skill levels 3 or 4 depending on the occupation. Major Group 2 (professionals) only includes occupations at skill level 4. Occupations in the Major Group 3 (technicians and associate professionals) are categorized at the skill 3, while Major Groups 4 to 8 (clerical support workers, service, and sales workers; skilled agricultural, forestry, and fishery workers; craft and related trades workers; plant and machine operators, and assemblers) are included in skill 2. Finally, within the Major Group 0 (military occupations), sub-major groups have been established at different skill levels (1, 2, or 4). In our sample, the skill level 1 included only seven participants, so we combined these participants with those that corresponded to level 2 in order to create a reference class for comparison with the other occupational classes. We also used a dichotomous classification: white (occupations coded 1–5) and blue-collar occupations (occupation coded 6–9). The total number of working years, the level of the last occupation (coded 1–4 and blue or white collar), and the level of the lifetime occupation (coded 1–4 and blue or white collar) were taken into account in the analyses.
Leisure activities: A list of 17 leisure activities was presented to the participants. For each activity, they were instructed to describe the frequency at which they performed it at each life stage. The following example was provided to the participants: Between 6 and 26 years old, I played sports such as tennis once a week, then I played once a month until I was 30 years. I stopped during 10 years then I started to play twice a month until the age of 50 years. From the age of 51 years onwards, I played five times a year. The 17 leisure activities were then grouped in four categories: social activities (e.g. dinner with friends, participation in charitable activities, volunteering), intellectual activities (e.g. reading newspapers, books, doing crosswords or puzzles, playing poker or chess, using new technologies such as iPad), physical activities (e.g. sports, walking, dancing), and cultural activities (e.g. theater, going to a museum, travel, artistic activities such as painting). We considered in the analyses the number of days spent in the practice of social, intellectual, physical, and cultural activities, currently and across the lifespan. Specifically, all data were first reported on a common unit, the frequency of practice per year: The number is multiplied by 365.25 when the frequency is reported per day; by 52 when it is reported per week; and by 12 when it is reported per month. Then, the frequency was multiplied by the number of years of practice in each life stage. A total score was calculated for each activity by adding the number of days of practice of the activity provided by the individual in the different life stages. For instance, using the above example, we would calculate the score of physical activity across the lifespan as follows: 1/week during 20 years = (52 × 20); 1/month during three years = (12 × 3); 2/month during nine years (24 × 9); 5/year during four years (5 × 4). The total equals 1,312. In order to compare the different leisure categories, the total score was divided by the number of activities included in the category (physical, cultural, intellectual, and social). In the present case, 1,312 was divided by 2 (number of physical activities) to arrive at a total of 656, which refers to the number of days of physical stimulation throughout life.
Neuropsychological assessments
The neuropsychological battery was composed of six neuropsychological tests:
Executive functioning
-
1. The verbal fluency test (Godefroy, Reference Godefroy2008) assessed semantic and phonemic verbal fluency. Participants had 120 seconds to generate as many words as possible that started with the letter “P” (phonemic fluency). Then, they were asked to list as many words as possible belonging to the “animal” semantic category (semantic fluency), also within 120 seconds. The total score consisted in the total number of words generated in both tasks.
-
2. The Trail Making Test (TMT) (Reitan, Reference Reitan1958) was used to assess cognitive flexibility and processing speed. This test is composed of two parts. Part A (TMT-A) consists in connecting circles numbered from 1 to 25 as fast as possible and without errors, in ascending order. In Part B (TMT-B), which is used to examine selective attention and shifting ability, participants are asked to connect circles by alternating numbers (1–13) and letters (A–L) in sequence, as fast as possible. Before each part of the test, a pretest composed of only six items was administered to ensure that participants understood the instructions. The total score was calculated by subtracting the time needed to complete the part B from the time spent in the performance of part A.
-
3. The Alphabet task assessed flexibility and inhibition. Participants have to recite the alphabet as fast as possible and without making any errors (part 1). Then, participants have to say every second letter out loud as fast as possible (part 2). This second task is performed twice. For each part, the time needed to perform part 1 was divided by the number of letters produced by the participant, which gave an index of the rhythm by letter. Afterwards, the score obtained in part 1 (rhythm by letter) was subtracted from the score obtained in part 2. The validation of this task is under process.
Memory functioning
The Free-recall learning task (RLS-15) (Rectem et al., Reference Rectem, Poitrenaud, Coyette, Kalafat, Van der Linden, Van der Linden, Adam, Agniel and Baisset Mouly2004) was used to assess episodic memory. This task comprises 15 unrelated words that are verbally presented ten times (learning trials). After the first presentation, participants are asked to recall as many words as possible in 120 seconds. Then, only the words that have not been recalled during the first attempt are repeated. Participants have to recall as many words as possible including those that were not repeated by the assessor. After 30 minutes, a delayed free recall and a recognition task are performed. In the present study, three recall trials were administered as well as a delayed recall. The total score consisted in the sum of scores obtained in the three recall trials and in the delayed recall (maximum score = 60).
Fluid and crystallized abilities
-
1. Matrix Reasoning (Subtest of the WAIS-IV; Wechsler, Reference Wechsler2011) was used to assess fluid abilities (in particular, non-verbal reasoning). Participants had to choose, among several images, the one that complemented a logical sequence of images. A pretest was first administered to ensure that participants understood instructions. The difficulty of the task was gradual and each correct answer corresponded to a point. The task was stopped after three consecutive errors. The total score consisted in the sum of correct answers provided by participants (maximum score = 28).
-
2. The Mill Hill Vocabulary scale (Deltour, Reference Deltour1993) assesses verbal abilities by measuring the ability to select a word (among five distractors) that semantically match a target word. Before the beginning of the test, an example was provided to ensure that participants understood instructions. Then, participants were asked to complete 33 items. Total score represents the number of correct answers provided (maximum score = 33).
Statistical analyses
The scores of the neuropsychological tests were standardized in a z-score (score centered on the mean of the distribution and divided by the standard deviation). In order to attribute the same weight to each cognitive domain in the final global z-score, the three z-scores of the executive tests (Verbal fluency, TMT, and Alphabet) were first averaged. A global cognitive score was then calculated based on the scores obtained in the standardized tests. In addition, we conducted analyses on the vocabulary Mill Hill scale (measurement of crystallized abilities) and the Matrix Reasoning (measurement of fluid abilities). These measures were used to evaluate the interest of ICR on other cognitive functions that were not included in the calculation of the two indices of CR. It should be noted that the Matrix Reasoning was only administered to a subsample of participants (n = 95 participants).
To calculate the ICRs, linear regression analyses were performed to assess the relationship between each of the three most commonly used measures for each factors of CR and the global cognitive score. Thus, educational level was assessed by the number of schooling years; occupation was represented by the complexity of the primary occupation, while leisure activities were quantified by the current engagement in leisure activities. The results from univariate regressions were used to create a score for each proxy (i.e. education, occupation, and leisure activities), as follows:
 $$\begin{equation*}
Y = a + {b_1}{x_1} + {b_2}{x_2} + \ldots + {b_p}{X_p},
\end{equation*}$$
where Y is the z score of global cognition and X are the explanatory variables of each proxy of CR. Each proxy of CR (i.e. education, occupation, and leisure activities) was obtained by summing the product of the estimated regression coefficient and the value of the explanatory variable. Then, the ICRs was calculated by adding the subscores of the three CR proxies:
 $$\begin{eqnarray*}
{\rm{ICRs}} &=& {\rm{ICRs}} - {\rm{Education}} + {\rm{ICRs}} - {\rm{Occupation}} \nonumber\\
&&+\, {\rm{ICRs}} - {\rm{Leisure}}\;{\rm{activities}}{\rm{.}}
\end{eqnarray*}$$
To calculate the ICRd, linear regression analyses were conducted to assess the effect of various measures in the estimation of each factor influencing CR (e.g. occupation categorized according to the complexity of the last occupation or white/blue collar) and global cognitive functioning. Then, we considered the best measure for each proxy (based on several indicators obtained from the regression analyses, such as p value, R 2, and b) to calculate the ICRd score. Additional parameters that were significantly associated with cognition were added to refine the index. For instance, the best indicator for education could be the highest diploma combined with the number of training courses. In the formula, the weight assigned to the training courses would be lower than that of the highest diploma. After conducting univariate analyses, all relevant variable(s) were then reintroduced into the regression model. The results were used to create a formula for each proxy of CR (i.e. education, occupation, and leisure activities). The score of ICRd was calculated by summing the subscores for education, occupation, and leisure activities.
 $$\begin{eqnarray*}
{\rm{ICRd}} &=& {\rm{ICRd}} - {\rm{Education}} + {\rm{ICRd}} - {\rm{Occupation}} \nonumber\\
&&+\, {\rm{ICRd}} - {\rm{Leisure}}\;{\rm{activities}}{\rm{.}}
\end{eqnarray*}$$
To determine which of the two indices (ICRs, ICRd) more accurately reflected the overall CR, we assessed whether the minimization of the effects of age on cognitive functioning were better represented by IRCs or IRCd. First, univariate analyses were carried out to examine the association between age and cognitive performances: global cognitive score and two others tests that reflected fluid and crystallized abilities (i.e. Mill Hill and Matrix Reasoning). Then, the ICRs and the ICRd were introduced as independent variables in the two separate regression analyses.
All statistical data analyses were performed using SPSS version 21.0 and p < 0.05 was used as a criterion for statistical significance. The assumptions of normality and homoscedasticity were evaluated by graphical inspection of the residuals.
Results
Sample characteristics
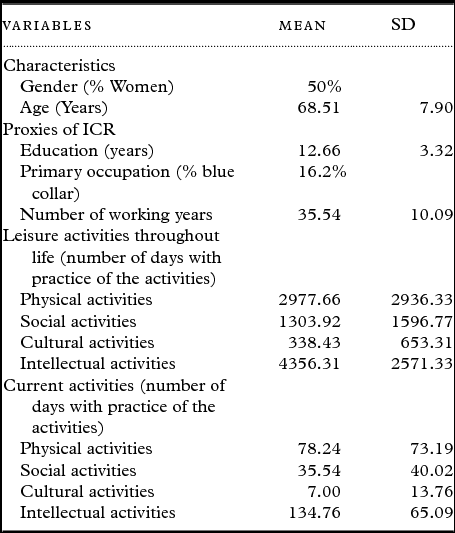
Participants’ mean age was 68.51 (SD = 7.90) and the mean score of the global cognitive performance was −0.006 (SD = 0.80). The proportion of men and women in the sample was equivalent (50%). The demographics and characteristics of participants are displayed in Table 1.
Characteristics of the study sample (n = 204)

Calculation of the ICRs subscores:
ICRs subscore for educational attainment
In the literature, the most common variable used to assess educational attainment is the number of years of schooling. Results showed that higher numbers for years of education were associated with better global cognitive performance (b = 0.09, R 2 = 14.90%, p < 0.001). In other words, each additional year of schooling increased global cognitive performance (adjusted mean score) by 0.09 points. The formula used to calculate the ICRs’ subscore for education is the following:
 $$\begin{eqnarray*}
&&{\rm{Global}}\;{\rm{cognition}}\;\left( {z\ {\rm{ score}}} \right) = - 1.1736 \nonumber\\
&&\quad+\, \left( {0.092*{\rm{years}}\;{\rm{of}}\;{\rm{schooling}}} \right)
\end{eqnarray*}$$
ICRs subscore for occupational status
The ICRs related to occupation was calculated using the complexity of the main occupation, as it is most frequently coded in these terms in the literature. Therefore, we used the four-level classification provided ISCO-08 (level 1–2 is the reference variable). A positive association was found between occupation skill levels and the z-score for global cognitive performance (R 2 = 9.90%, p < 0.001). Thus, the adjusted mean score increased by 0.51 points (p = 0.001) in participants who held an occupation at level 3 and by 0.53 points (p < 0.001) in those at level 4, compared to participants who held the lowest occupation level. The ICRs’ subscore for primary occupation was calculated as follows:
 $$\begin{eqnarray*}
&&{\rm{Global}}\;{\rm{cognition}}\;\left( {z\;{\rm{score}}} \right) = - 0.354 \nonumber\\
&&\quad + \left( {0.510*\;0\;{\rm{or}}\;1\;{\rm{for}}\;{\rm{skill}}\;{\rm{level}}\;3} \right) \nonumber\\
&&\quad+\, \left( {0.533*\;0\;{\rm{or}}\;1\;{\rm{for}}\;{\rm{skill}}\;{\rm{level}}\;4} \right)
\end{eqnarray*}$$
Note. The first bracket corresponds to skill level 3 while the second is for skill level 4. Participants obtained a score of 1 if they belonged to the category and 0 otherwise.
ICRs subscore for leisure activities
The usual way of assessing leisure activities in the literature is by an indicator related to participation in activities undertaken currently or within the last year. The univariate analysis revealed a significant association between this variable and global cognitive performance (b = 0.0003, R 2 = 5.57%, p < 0.001), which suggests that the higher the rate of participation, the better the cognitive performance. The following formula was used to calculate the ICRs-current leisure activities (social, intellectual, physical, and cultural):
 $$\begin{eqnarray*}
&&{\rm{Global}}\;{\rm{cognition}}\;\left( {z\;{\rm{score}}} \right) = - 0.409\\
&&\quad + \left( {0.0003*\;{\rm{number}}\;{\rm{of}}\;{\rm{days}}\;{\rm{of}}\;{\rm{participation}}} \right)
\end{eqnarray*}$$
The ICRs index refers to the sum of three subscores: ICRs-education (years of formal education), ICRs-occupation (typology of the primary occupation), and ICRs-current leisure activities (number of days with practice of the activities). The score of the ICRs ranged from −1.229 to 1.463 (mean = −0.017; SD = 0.59).
Calculation of the ICRd subscores
ICRd subscore for education
Results showed that higher numbers for years of education were associated with better global cognitive performance (b = 0.09, R 2 = 14.90%, p < 0.001). However, education did not have a linear effect on global cognitive performance (z-score). Thus, considering education as a continuous variable is an oversimplification in the present case. Another way of categorizing education is by using the highest diploma obtained (five different levels). The results showed a positive and significant association between the educational level and the z-score of cognitive performance (R 2 = 15.67%, p < 0.001). More specifically, the adjusted mean score increased by 0.58 points (p = 0.002) in participants who completed a lower secondary diploma and by 0.84 points (p < 0.001) in those who obtained a higher secondary diploma, compared to participants with no diploma or primary diploma. The mean score for individuals who reached higher education diploma and those who had a university diploma increased by 0.98 points (p < 0.001) and by 1.13 points (p < 0.001) as compared to the reference group (no diploma or primary diploma). Given that the differences observed between each coefficient of the five educational levels are not similar, the effect of education on global cognitive performance cannot be considered as linear.
We also had at our disposal the number of training courses undertaken by individuals. The univariate analysis revealed an association between the number of training courses and global cognitive performance (b = 0.16, R 2 = 7.66%, p < 0.001).
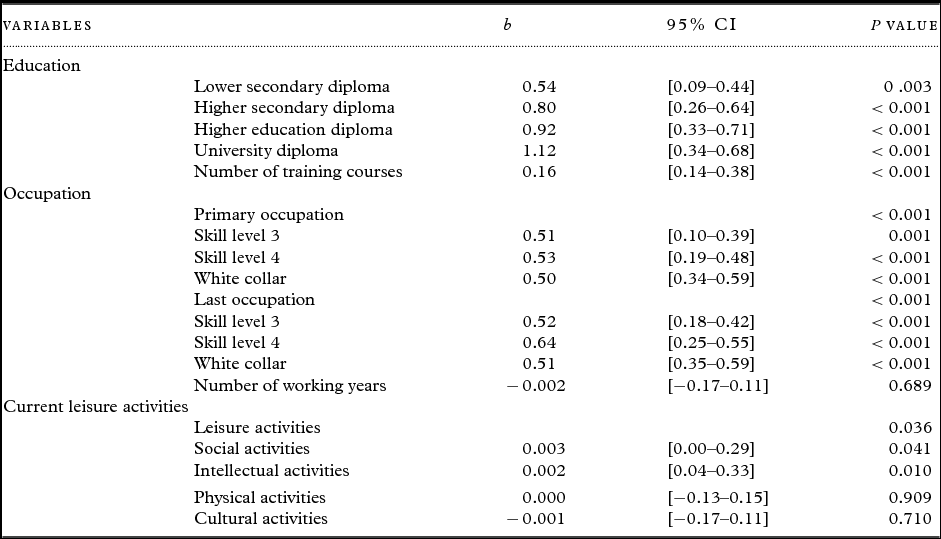
Although the number of years of education and highest diploma were both associated with cognitive performance, they could not be integrated within the same model since these parameters were highly correlated (p < 0.001, r = 0.91). In addition, the relationship between education and cognition is not linear and the part of variance explained by the diploma obtained is also slightly higher than that of the number of schooling years (diploma: R 2 = 15.67% vs. years of education: R 2 = 14.90%). Therefore, to calculate the ICRd subscore, we chose to categorize educational attainments with five levels, rather than using the years of education. Moreover, given that the diploma and the number of training courses were both associated with global cognitive functioning, a multivariate regression analysis was performed (R 2 = 22.20%, p < 0.001, see Table 2). The results obtained from this analysis were used to create the ICRd-education subscore:
 $$\begin{eqnarray*}
\begin{array}{@{}l@{}} {\rm{Global}}\;{\rm{cognition}}\;\left( {z\;{\rm{score}}} \right)\ = - 0.891\\
\quad+ \left( {0.543*\;0\;{\rm{or}}\;1\;{\rm{for}}\;{\rm{lower}}\;{\rm{secondary}}\;{\rm{diploma}}} \right)\\
\quad + \left( {0.800*\;0\;{\rm{or}}\;1\;{\rm{for}}\;{\rm{higher}}\;{\rm{secondary}}\;{\rm{diploma}}} \right)\\
\quad + \left( {0.923*\;0\;{\rm{or}}\;1\;{\rm{for}}\;{\rm{higher}}\;{\rm{education}}\;{\rm{diploma}}} \right)\\
\quad + \left( {1.121*\;0\;{\rm{or}}\;1\;{\rm{for}}\;{\rm{university}}\;{\rm{diploma}}} \right)\\
\quad + \left( {0.163*\;{\rm{number}}\;{\rm{of}}\;{\rm{training}}\;{\rm{courses}}} \right) \end{array}
\end{eqnarray*}$$
Multivariate linear regression analyses of the effects of educational level, the current number of participation in different types of activities and occupation categories (dichotomous classification, four-level variable) on the standardized z-scores for global cognitive functioning

Notes. Education: No diploma or primary diploma was the reference category. Occupation: Skill level 1–2 and blue collar were the references categories.
Note. A score of 1 was chosen for the parenthesis referring to the highest diploma; a score of 0 was put in the remaining parentheses.
ICRd subscore for occupational status
In addition to the level of the primary occupation (i.e. four skill levels proposed in the ISCO-08), other classifications related to occupation were also considered in the analyses. For example, the primary occupation could be classified using a dichotomous variable: blue or white collars (i.e. manual and intellectual occupations). Considering the larger number of participants in these categories, the latter classification could increase the statistical power of our results. In addition, the primary and the last occupation held by individuals could have different impacts on cognition (ISCO classification or blue vs. white collars). Finally, the number of working years was also investigated in the analyses. All of these measures could be combined with the work time and thereby provide a better measurement for occupational status. However, given that 90% of the participants had held full-time jobs, this variable was not introduced in the analyses.
With the exception of the number of working years (b = −0.002, p = 0.689), all occupational parameters: primary occupation coded as blue versus white collars (b = 0.50, p < 0.001), last occupation coded in four categories (R 2 = 12.49%, p < 0.001), and blue versus white collars (b = 0.51, p < 0.001) were associated with cognitive performance (see Table 2).
The strong correlation between the primary occupation and the last occupation does not allow an integration of both variables in the same model (p < 0.001, r = 0.96). Therefore, we chose to keep the last occupation (coded as blue or white collar), since it explained a greater part of the variance of global cognitive performance. It should also be noted that the smaller number of participants in each of the four-level skill categories may have reduced the statistical power, which could explain why the dichotomous variable is more relevant in the present case. The results obtained from this analysis were used to create the ICRd-occupation subscore:
 $$\begin{eqnarray*}
&&\hbox{Global cognition} (z\;{\rm{score}} ) = - 0.354\\
&&\quad+\, (0.511* 1 {\rm or} - 1)
\end{eqnarray*}$$
Note. The number 1 refers to intellectual occupation (white collar) and −1 refers to manual occupation (blue collar).
ICRd subscore for leisure activities
To go one step further than the participation in activities undertaken currently or within the last year, we also examined in separate analyses the effect of different types of activities undertaken currently or previously by participants. The results showed that engaging currently in social (b = 0.004, R 2 = 3.22%, p = 0.005) and intellectual (b = 0.003, R 2 = 5.00%, p = 0.001) activities was associated with better cognitive functioning. In contrast, no significant associations were found for cultural (b = 0.001, p = 0.727) and physical (b = 0.0008, p = 0.313) activities. Similar results were found when all leisure activities were integrated in a multivariate analysis (R 2 = 7.98%, p = 0.036). Results are provided in Table 2.
It is also interesting to note that with the exception of social activities performed during the entire lifespan (b = 0.00008, p = 0.015), the level of participation in intellectual (b = 0.00003, p = 0.106), physical (b = 0.00003, p = 0.085), and cultural (b = 0.0000, p = 0.998) activities across the lifespan were not associated with cognitive performance. The results from the multivariate model also showed that engagement across the lifespan (intellectual, physical, social, and cultural taken together) was not significantly associated with cognition (R 2 = 4.1%, p = 0.077).
Therefore, to calculate the ICRd-leisure, we used the number of participation in current activities (within the last year). Then, we conducted a multivariate model (Table 2), including all the categories of leisure activities currently undertaken by individuals, revealed that only social and intellectual activities were associated with global cognitive performance. An analysis conducted using those significant variables showed that the global model is also associated with cognitive performance (R 2 = 7.03%, p = 0.005). Therefore, the more participants were currently engaged in social (b = 0.003, p = 0.040) and intellectual (b = 0.002, p = 0.008) activities, the better was their cognitive performance.
 $$\begin{eqnarray*}
&&{\rm{Global}}\;{\rm{cognition}}\;\left( {z\;{\rm{score}}} \right) = - 0.413\\
&&\quad + \left( {0.003*\;{\rm{number}}\;{\rm{of}}\;{\rm{current}}\;{\rm{participation}}}\right.\\
&&\quad\left.{{\rm{in}}\;{\rm{social}}\;{\rm{activities}}} \right) + (0.002*{\rm{rate}}\;{\rm{of}}\\
&&\quad{\rm{currentintellectual}}\;{\rm{activities}})
\end{eqnarray*}$$
The ICRd index was calculated by summing three subscores:
ICRd-education (highest level of education combined with the number of training courses), ICRd-occupation (last occupation categorized as blue or white collar), and ICRd-leisure activities (rate of currently performed social and intellectual activities). The score of the ICRd ranged from −2.161 to 1.663 (mean = 0.007; SD = 0.77).
Associations between age, indices of CR, and cognition
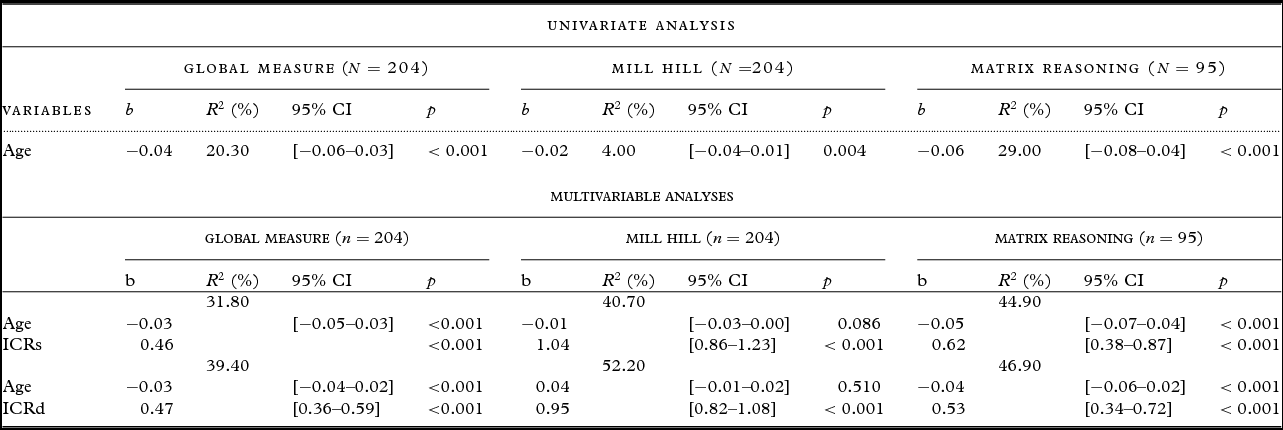
Age was negatively associated with all performances: standardized z-scores for the global cognitive functioning (b = −0.04, R 2 = 20.30%, p < 0.001), Mill Hill (b = −0.02, R 2 = 4.00%, p = 0.004), and Matrix Reasoning (b = −0.06, R 2 = 29.00%, p < 0.001). In other words, cognitive performances decreased with advancing age. Then, both multivariate regression analyses − including age and ICRs or ICRd − showed that the higher ICRs and ICRd were associated with better cognitive performances, respectively, global cognitive score (b = 0.46, p < 0.001; b = 0.47, p < 0.001), Mill Hill (b = 1.04, p < 0.001; b = 0.95, p < 0.001), and Matrix Reasoning (b = 0.62, p <0.001; b = 0.53, p < 0.001). Although the negative effects of age on cognition is reduced when both indices of CR are introduced in the model, it appears that the ICRd is a better indicator of CR than ICRs, since it is associated with smaller age-related effects than ICRd. Indeed, the part of variance explained by the ICRd model was greater for all the cognitive tests, compared to that of the ICRs (see Table 3). However, it should be noted that only slight differences in variances between IRCs and IRCd were observed for Matrix Reasoning.
Univariate and multivariate regression analyses

Discussion
The present study aimed to develop two indices of CR (ICR-standard and ICR-detailed) in order to determine which of these indicators could more accurately represent the level of one's CR, based on data collected from a sample of 204 retirees. The level of ICRs was assessed using a combination of traditional estimates of reserve (i.e. the most common measures used in the literature): years of formal education, level of main occupation, and the amount of current engagement in stimulating activities. The assessment of ICRd was based on most significant parameters (established in initial analyses) used in the estimation of CR and on their relative importance. For example, we considered the educational degree, as well as the number of training courses to measure the effect of education on the development of CR; the last occupation, classified as blue or white collar, and the number of days with current social and intellectual activities were also taken into account. Given that cognitive performance tended to decrease with age and that CR should act as a buffer, we postulated that the measure of CR that was more strongly associated to the minimization of age-related effect on cognition should be used to estimate CR.
Overall, the results obtained in regression analyses indicated that higher indices of CR (ICRs and ICRd) were associated with a greater minimization of negative age-related effect on cognitive functioning. However, the ICRd model explains a greater part of the variance of global cognitive functioning, thus suggesting that this index best reflects one's CR. The z-score for global cognitive functioning was used to calculate the representativeness of each subscore of CR estimates. Therefore, in order to evaluate the interest of using both indices of CR on other cognitive functions, we also conducted analyses on two other cognitive tests measuring fluid (Matrix Reasoning) and crystallized abilities (Mill Hill). These analyses are in accordance with prior results on global cognition and further suggested that ICRd may more accurately reflect the level of CR. Nevertheless, although the ICRd explained a greater part of variance of both cognitive measures (Mill Hill and Matrix Reasoning), only slight differences in variance were appreciated for Matrix Reasoning. Two main explanations can be put forward for such result. First, it is well-known that aging has a salient effect on fluid cognitive abilities (assessed by the Matrix Reasoning) (Dixon et al., Reference Dixon, Bäckman and Nilsson2004). In this respect, our results showed that age explained 29% of the variance of fluid abilities which is largely superior to that of crystallized abilities (4%). Therefore, it seems that age already played a crucial role. Since ICRs and ICRd showed similar performance, additional information provided by the ICRd model did not seem to be decisive to explain fluid cognitive abilities. Another possible explanation could result from the difference in the sample size. The Matrix Reasoning was administered to 95 participants while 204 participants completed the Mill Hill and global cognitive functioning.
Although CR is a dynamic construct resulting from a combination of life experiences accumulated across the lifespan, studies addressing CR mostly relied upon only one variable related to CR. This estimation approach has been questioned, as it might not provide a full picture of one's reserve (Jones et al., Reference Jones, Manly, Glymour, Rentz, Jefferson and Stern2011). Our findings are in accordance with previous research showing that using multiple indicators of CR results in a more comprehensive estimate of individuals’ CR (Valenzuela and Sachdev, Reference Valenzuela and Sachdev2007; Nucci et al., Reference Nucci, Mapelli and Mondini2012; Leon et al., Reference Leon, García-García and Roldan-Tapia2014, Ward et al., Reference Ward, Summers, Saunders and Vickers2015). For instance, the Lifetime of Experiences Questionnaire (LEQ developed by Valenzuela and Sachdev, Reference Valenzuela and Sachdev2007) gives equal importance to subscores related to education, occupational status, and engagement in stimulating activities in the calculation of CR index. The final score thus combines the potential impact of these life experiences in different life stages (i.e. young adulthood, midlife, and late life). Nucci et al. (Reference Nucci, Mapelli and Mondini2012) also provides an estimation of CR that is based on experiences (years of schooling, combined with the number of training courses; number of working years multiplied by the cognitive level of the work, the number of years and frequency of practice of 16 activities). All of these studies concluded that their index of CR is an adequate measure to estimate CR. Nevertheless, a shortcoming of the study of Nucci et al. (Reference Nucci, Mapelli and Mondini2012) and previous research is that the relevance of the method used to evaluate CR proxy indicators, as well as their relative importance in a composite CR index, has not been raised. Indeed, although the present study highlights that CR can be estimated by combining its common proxy measures and that this estimation is associated with the minimization of age-related effects on cognition, we showed that this method is not the best for measuring one's CR in our sample. In particular, although using education as a continuous variable (i.e. years of formal education) may lead to a greater statistical power, the effect of this factor was not linear in our sample. It is therefore an oversimplification to consider education as a continuous variable. The present study revealed that using a weighted combination of the highest obtained diploma and the number of training courses provided estimations of the impacts of education on cognitive functioning that were statistically more relevant.
In the same vein, despite that the common method for assessing occupation in the literature is the complexity of the primary occupation (e.g. Andel et al., Reference Andel, Kåreholt, Parker, Thorslund and Gatz2007), our results showed that the last occupation (coded as blue or white collar) was more significantly related to cognitive functioning and explained a greater part of its variance. Nevertheless, it is important to note that the last occupation, classified using the four skill levels of the CITP, could also be a good indicator in larger sample since it is significantly associated with cognitive functioning. Finally, our results showed that the number of participation in current (within the last year) leisure activities was the variable that mattered the most. At first glance, this may appear to be inconsistent with the CR hypothesis, which postulates that CR continues to develop through new life experiences and activities over the lifespan (Richards and Sacker, Reference Richards and Sacker2003). One possible explanation could be that leisure activities may become a central tenet of retirees’ lives (Hendricks and Cutler, Reference Hendricks and Cutler1990), whereas it is considered to be of secondary importance during the active life. Another possible explanation for such result could stem from the lack of accuracy of the information collected due to the retrospective nature of the data. Nevertheless, our present findings add to the literature since it suggested that in a population of older adults, current activities, and last occupation are more important than former activities.
This study has several limitations. One limitation comes from the lack of generalizability of the findings. Indeed, our sample consisted of retired individuals and although we paid attention to have a similar proportion of men and women (50%) and different educational level (range from 5–24 years of education), the sample mainly included people with intellectual occupations, which may influence the results. Second, the majority of the information was retrospectively gathered. Thus, the accuracy of the answers could not be verified. Third, we calculated both indices of CR using a measure of global cognitive functioning. This global cognitive measure was also used in the final analyses to determine which of the two indices of CR more accurately reflect the overall CR. Thus, in order to assess the relevance of using the two ICR on other cognitive functions, we also conducted the final analyses on two others cognitive tests (Mill Hill and Matrix Reasoning) that were not used to calculate both indices of CR. These analyses confirmed our prior results. However, this method may not be optimal. Thus, these indices should be used on a new sample and with other neuropsychological measures to replicate the results. In addition, further studies, with larger and more representative independent samples, are needed to ensure the generalizability of the present results. It would also be of great interest to use this questionnaire across different age groups. Indeed, while younger people present comparatively fewer differences in terms of physical and cognitive abilities, the variability tends to increase with advancing age. Studies comparing cognitive performances in young and elderly participants showed a greater disparity in cognitive performance (observed by the standard deviation) in the elderly population (Carlesimo et al., Reference Carlesimo1998). Thus, although hereditary factors influence cognitive abilities, life choices, and environmental factors become increasingly important with age and may strongly contribute to the inter-individual variability in older people. Therefore, the use of age-group comparisons will help (1) to determine whether there is an increase in the variability of the CR score with age and (2) to observe whether there are differences in the importance of each CR factor across age groups. For instance, education may be more important in early life as compared to late life. The way to estimate CR can therefore vary according to the different life stages. Finally, the development and validation of CR tools represent a clinical challenge and is of great importance, especially in the context of cognitive aging. Indeed, aside from refining existing norms by considering simultaneously several factors of CR, it will help (1) to avoid underestimating cognitive deficits in people with high CR and (2) to avoid over-pathologizing people with low CR. Regarding the first point (i.e. underestimation of cognitive deficits of people with high CR), the use of norms that solely take into account the level of education of an individual with a low level of education but who has been engaged in various professional and leisure activities over his lifespan would lead to underestimate the deficits related to the brain lesion. Indeed, this person would be considered to have a low level of reserve based on its level of schooling while in fact his life course and activities would normally place it in a higher level of CR. In contrast, looking at highly educated individuals who have never engaged in a professional activity and with low rates of participation in cognitively or socially stimulating leisure activities will lead to overestimation of cognitive deficits. Indeed, clinicians will be inclined to use norms for people of higher CR level while in fact, the magnitude of their reserve is not as high given their low level of engagement in activity after graduation. Moreover, the use of valid measures for CR could have implications for the specificity of cognitive rehabilitation programs. Indeed, intervention strategies and the benefits obtained from cognitive intervention programs could be different according the level of one's CR (e.g. for the effects of education on cognitive interventions, see Contador et al., Reference Contador, Fernández-Calvo, Ramos and Olazarán2016).
Future research on larger samples is needed to validate the present results and to develop an operational clinical tool for the measurement of CR. Additional proxies contributing to CR will be included in the questionnaire, such as bilingualism (Schweizer et al., Reference Schweizer, Ware, Fischer, Craik and Bialystok2012) and level of literacy (Manly et al., Reference Manly, Schupf, Tang and Stern2005). The later may be a better predictor of cognitive functioning as compared to years of education (Manly et al., Reference Manly, Schupf, Tang and Stern2005, Contador et al., Reference Contador, Bermejo-Pareja, Del Ser and Benito-León2015a). Furthermore, factors such as the use of psychotropic substances (e.g. Vermeeren and Coenen, Reference Vermeeren, Coenen, Van Dongen and Kerkhof2011), health problems (i.e. diabetes, hypertension, cardiovascular disease) (e.g. Knopman et al., Reference Knopman2001), and body mass index (e.g. Fergenbaum et al., Reference Fergenbaum, Bruce, Lou, Hanley, Greenwood and Young2009) could be incorporated in a negative load index (i.e. factors that could affect negatively the level of CR).
In conclusion, our study highlights that it is important to validate the methods used to measure CR proxy factors. Although the standard method used to estimate CR in the literature (i.e. number of schooling years) is associated with cognitive functioning, we found that the detailed CR score, which takes into account all relevant indicators for each proxy and their weight is a better predictor of cognitive functioning. Further studies should be conducted with larger samples in order to create an operational tool that could be used in scientific and clinical settings.
Conflict of interest
None.
Description of authors’ roles
C. Grotz designed the study, supervised the data collection, contributed to the data analysis, interpretation, and drafted the paper. M. Van Wissen contributed to the data collection and critically revised the paper for important intellectual content. S. Adam and X. Seron contributed to the study concept and design, and critically revised the paper for important intellectual content. All authors approved the final version of the paper. Authors had full access to all of the data in the study and C. Grotz and S. Adam take responsibility for the integrity of the data and the accuracy of the data analysis.
Acknowledgments
Catherine Grotz is supported by the Fund for Scientific Research (F. R. S. – FNRS), Belgium (www.frs-fnrs.be).