I. INTRODUCTION
We reported previously the formation of cones with micrometer or below in their sizes prevailing over the sp 3-bonded boron nitride (BN) films prepared by laser-activated plasma chemical vapor deposition (CVD). Reference Komatsu1–Reference Komatsu, Kazami, Tanaka, Moriyoshi, Shiratani and Okada4 Utilizing some of the BN films with semiconducting properties, we successfully fabricated heterojunctions of p-type BN on n-type silicon wafers and which proved to work as photovoltaic cells. Reference Komatsu, Sato, Hirano, Nakamura, Koga, Yamamoto, Nagata, Chikyo, Watanabe, Takizawa, Nakamura, Hashimoto and Shiratani5 In that case, the surface morphology occupied by the microcones was considered as effective as anti-reflection, which should contribute to improving the efficiency of the solar cell.
On the other hand, these BN films proved to show electron field emission with very excellent achievements. Reference Komatsu, Ohta, Tanaka, Moriyoshi, Nakajima, Chikyo and Shiratani2,Reference Komatsu, Okudo, Kazami, Golberg, Li, Moriyoshi, Shiratani and Okada6 The surface morphology covered with cones plays an essential role as a geometrical enhancement factor. Reference Fursey7 However, many unknown things about the cones remain to be studied, including their growth mechanism. It is at least known that an (ArF at 193 nm) excimer laser irradiation upon the film surface renders the sp 2-bonded structure of BN films prepared by mere plasma CVD into those with sp 3-bonded structure. Reference Komatsu, Kobayashi, Sato, Hirano, Nakamura, Nagata, Chikyo, Watanabe, Takizawa, Nakamura and Hashimoto8 This laser-induced phase transition is considered to proceed during the growth of the sp 3-bonded BN in our plasma CVD activated with the excimer laser irradiation, which was pulsated at 2 to 40 Hz with a pulse duration of about 20 ns.
As for the effects induced by the laser irradiation in our plasma-CVD, we also previously mentioned photochemical effects Reference Komatsu, Kazami, Tanaka, Moriyoshi, Shiratani and Okada4 to activate surface chemical (growth and/or etching) reactions and migration of precursor species on the surface, Reference Komatsu and Moriyoshi9 in addition to the laser-induced phase (structural) transformation cited above. This reaction-diffusion scheme Reference Walgraef10 was formulated as a master equation to spatio-temporally govern the surface density of precursor radicals, previously. Reference Komatsu, Kazami, Tanaka, Moriyoshi, Shiratani and Okada4 This analytical approach was useful to understand the appearance of fractal patterning consisting of the microcones. Reference Komatsu, Kazami, Tanaka, Moriyoshi, Shiratani and Okada3,Reference Komatsu, Kazami, Tanaka, Moriyoshi, Shiratani and Okada4
Accordingly we may expect the nature of laser as a coherent light (or wave) to have profound effects on the growth of BN films prepared by this method. Here we report that such an effect is observed in their morphologies by a scanning electron microscope (SEM). They were ripple patterns formed around the cones in submicron orders and that was interpreted as a result of the interference among direct laser beams and those reflected from the cones. This is the other experimental evidence to support the crucial role of the laser in our method.
II. METHODS
The experimental setup for the laser-assisted plasma CVD of BN films was described in our previous review paper. Reference Komatsu1 5% diborane (B2H6) gas diluted in Ar and ammonia (NH3) gas was introduced into the plasma torch separately to avoid reactions prior to their decomposition in the plasma. The majority of the plasma gas was Ar and that was introduced at the flow rate of 3 SLM (liter per minute at standard condition) into the plasma torch, which was set at the top of the reaction chamber. The purity of these gasses was in the semiconductor-industry level, about 99.9999%. An inductively coupled plasma was generated in the plasma torch through a three-turned copper coil by applying alternating power (15 MH) of 200 W. The power was modulated with a square-wave signal (50% duty) at the same frequency of the excimer laser. As a result, plasma packets containing a lot of fragments or radicals originating from diborane and ammonia struck and went over the substrate surface periodically so as to deposit BN films. At the same time, the pulsated excimer laser, which was synchronized with the modulation signal of the plasma, irradiated the growing film surface. The experimental conditions are summarized in Table I. It should be noted that durations for the deposition were 15, 30, and 60 min, for the samples A, B, and C, respectively. The laser frequency for samples A and C was 20 Hz, while it was 10 Hz for sample B. They had the same experimental conditions except for these.
Experimental conditions for the preparation of the samples A, B, and C.

The films were deposited on single crystalline silicon wafers with (100) orientation as the substrates. They were disks of 2.5 mm in diameter and 0.5 mm in thickness.
The prepared film samples were studied with a SEM, an optical microscope, energy-dispersive x-ray spectroscopy (EDX), and two dimensional-mapping of x-ray diffraction method (2D-XRD) using a collimated x-ray.
With the EDX, which was mounted onto the SEM system (Keyence, VE-7800, Osaka, Japan), chemical analyses of the BN films grown on the substrates were done and mapped along with SEM images. The acceleration voltage of electrons in the SEM/EDX was 3 kV.
The x-ray (Cu Kα1) for the XRD was excited at the acceleration voltage of 45 kV and current of 200 mA in the RIGAKU Smart Lab system (Tokyo, Japan). The x-ray optics including a collimator with 0.1 mm in diameter enabled us to pick up localized XRD from a selected tiny area of the sample. Then, the 2D mapping of the local XRD intensities was obtained by using an xy-stage driven by a micro-motor. The XRD intensities were detected and measured with a NaI scintillation counter with an automatic attenuator, which was to protect the detector from very intense x-rays.
The 2D-XRD mapping of the sample was performed for the diffraction from the Si(100) substrate at 2θ of 69.3°, which was the diffraction from (400) crystallographic plane of Si. The 2D measurement was done for a square area of 6 × 11 mm2 over sample A by a step of 0.1 mm for 10 s per one step. The obtained intensity data as a function of the (x, y) coordinates were visualized by using a graphic computer program (Voxler 3, Golden Software, Inc., Golden, CO).
It should be noted that the subtle topography consisting of the thickness distribution of a film sample on the Si substrate was enhanced exponentially with this method, since the incident and diffracted x-rays were attenuated according to the Beer–Lambert’s law, Reference Fox11 by the factor of exp(−αL), where α is the absorption coefficient and L is the light-path in the medium (BN film). The visualized images reproduced the 2D-distribution of the film thickness very sensitively, accordingly, which was also enhanced or exaggerated by the computer graphic processing.
III. RESULTS AND DISCUSSION
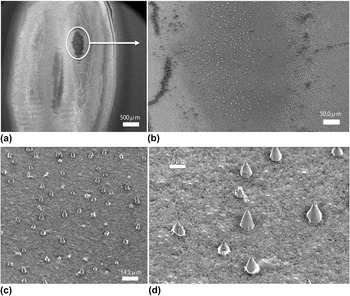
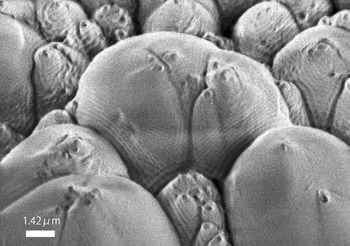
In Fig. 1, we show the SEM images of the sample A. The magnification is gradually increased from (a) to (d). The view in (a) depicts the characteristic appearance of the sample prepared by our method, in which the area irradiated by the laser is distinguished from the peripheral area where the laser did not irradiate. The inhomogeneous appearance inside the irradiated area reflects the inhomogeneous intensity section of the laser itself as well as self-organized patterning due to diffusion–reaction processes in the CVD. Reference Komatsu, Ohta, Tanaka, Moriyoshi, Nakajima, Chikyo and Shiratani2,Reference Komatsu, Kobayashi, Sato, Hirano, Nakamura, Nagata, Chikyo, Watanabe, Takizawa, Nakamura and Hashimoto8 The microcones were favorably grown in the area surrounded by the oval in (a). Through (b), (c), and (d), it is seen that this area is occupied by the microcones.
SEM images showing the surface morphology of a BN film (sample A) prepared by laser-activated plasma CVD. The duration for the deposition of sample A was 15 min.

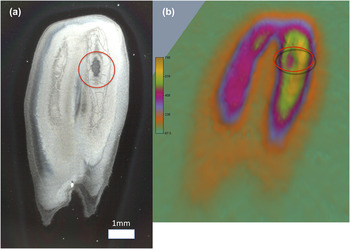
Figure 2(a) shows the image obtained by an optical microscope for sample A; the shape of the whole area irradiated by the laser is seen here. In Fig. 2(b), corresponding to (a), the results of the 2D-XRD mapping for the sample A are shown; the peripheral plane area painted green is higher in the “altitude” than in the valley of the yellow in the color gradation. In the color scale, it should be noted that the thinner the film thickness is, the more intense the XRD from the Si substrate is in our method. Figure 2(b) is a tilted view processed by the software to enhance the visibility. The circle in (a) and the oval in (b) correspond to the circle in Fig. 1(a), approximately.
(a) A photo of sample A taken with an optical microscope. The circle indicates the area where the microcones were found to have grown. The whole shape and the details are corresponding to the inhomogeneous distribution of the laser-intensity section. (b) A 2D-XRD mapping of sample A corresponding to the image (a). The circle is indicative of the area where the microcones were favorably grown. The mapped image shows the film-thickness topography depicted by relatively scanning a collimated thin beam (0.1 mm in diameter) of x-ray over the sample surface. The peripheral plane area painted green is higher in the altitude than the valley of the yellow in color gradation.

The topography of the film thickness (or growth rate) as seen in Fig. 2(b) is understood in accordance with the intensity distribution of the laser in the sectional area, which is intrinsic to the excimer laser mode, provided that the growth depended on the photon density of the laser. Reference Komatsu, Ohta, Tanaka, Moriyoshi, Nakajima, Chikyo and Shiratani2,Reference Komatsu, Kobayashi, Sato, Hirano, Nakamura, Nagata, Chikyo, Watanabe, Takizawa, Nakamura and Hashimoto8 However, it is more important for us to note that the cones favorably grew in the valley area where the growth rate was relatively low. We suppose that this is a direct indication that the cones not only grew by the growth reactions in the CVD but also were shaped by some etching or ablation processes. This means that the growth and etching (or shaping) proceeded simultaneously in the formation of the cones. And this result also suggests that there should be some suitable laser intensity for such individual cones to grow independently from each other. On the other hand, we should consider the timing at which the deposition was stopped; this time was also suitable in this area of sample A for the independent cones to have grown, we may suppose. This matter on the duration of the deposition or the total number of laser pulses will be examined again later in Figs. 6–8.
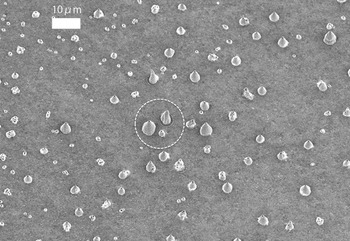
SEM image of sample B, which was deposited for 30 min. The dotted circle indicates the area whose enlargement is shown in Fig. 7.

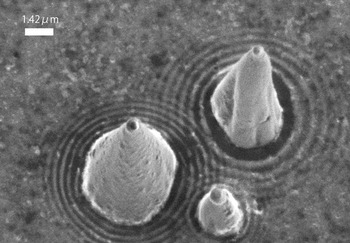
The SEM image of microcones whose position in Fig. 6 is indicated there.

The SEM image of sample C, which was deposited for 60 min.

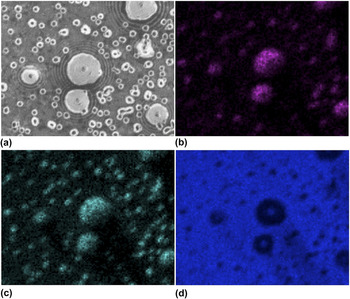
In Fig. 3, the results of EDX performed at an identical area of the sample A are exhibited. They are (a) SEM image, (b) EDX image mapping the x-ray intensity of nitrogen Kα, (c) that of boron Kα, and (d) that of silicon Kα, respectively. In (a), it is seen that each of the cones is accompanied by ripple patterns spreading around them; there we also see a lot of small nuclei, which are considered to grow into cones. The cones and nuclei are positively and clearly identified in the EDX signals from boron and nitrogen in (b) and (c), corresponding to the SEM (a). On the other hand, they are seen as “shadows” in the EDX image mapping the silicon signal in (d). As a whole, these results indicate that the morphology observed in the SEM is also seen as the chemical components of boron nitride on the silicon substrate.
(a) SEM image of sample A. Each of the cones is accompanied by ripple patterns spreading around them. (b) EDX image mapping the x-ray intensity of nitrogen Kα. (c) EDX mapping image of boron Kα. (d) EDX image of silicon Kα. The EDX images (b), (c), and (d) are corresponding to the SEM image (a).

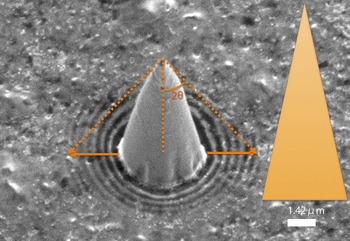
Figure 4 exhibits a SEM image that is suitable for our study on the cone accompanied by the ripple pattern (sample A). It is noted that the ripple rings surrounding the cone are diminishing as they depart from the cone while the distance between neighboring ripple rings is almost constant. The triangle shape on the right depicts the “real” proportion of the cone; the SEM images were taken at a tilted angle of 30°, for which the triangle representing the cone was corrected in the proportion. It is seen that the cone is fairly sharp. The arrows indicate the extent to be reached by the laser reflected from the cone if the shape of the cone is ideal. The details will be discussed below.
SEM image of a microcone found on sample A. The triangle on the right shows the real proportion of the cone corrected for the tilt (30°) on the SEM observation. The arrows indicate the extent the reflected laser could reach if the cone had possessed an ideal shape.

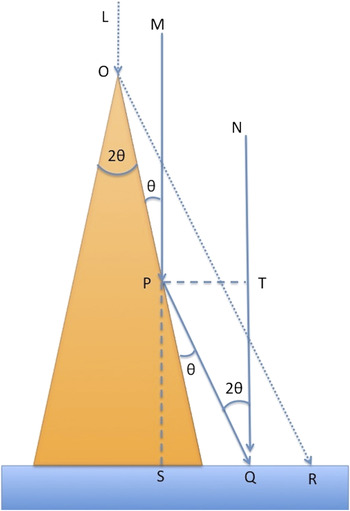
Using Fig. 5, we try to understand the origin of the ripple pattern as seen in Fig. 4. We assume here that (i) it was the interference between the laser directly incident on the growing film surface and that reflected from the side of the cone that produced the ripple patterns; (ii) the positively- interfering beams in the above meaning are more effective in activating the photochemical growth reactions of the precursor radicals than lasers interacting out of phase do. In this model, we assume that the shape of the cone, which is considered here, remains unchanged at least when the ripple pattern was being formed by photochemically activated growth reactions. Although this assumption is mostly for the simplification of our discussion, the observed ripple rings with fairly sharp delineation seem to support it; namely, the growth rate of the cone was so adequately slow that its shape was not changed significantly during the formation of the ripple pattern surrounding it, at the moment when the observed ripple pattern was formed.
A simple beam interference model to explain the origin of the ripple pattern spreading around each of the cones.

We check the condition under which the two beams MP-PQ and NQ interfere positively at the surface point Q; the single beam MP is reflected from the side of the cone and arrives at the point Q while the beam NQ directly does at point Q. The incident and reflected angle at point P is equally θ. Then the difference in the light path is PQ − TQ, where the underbar means the length. Supposing that the phase is shifted by a half wave length on the reflection, the positively enhancing interference takes place under the following condition,
 $$\underline {{\rm{PQ}}} - \underline {{\rm{TQ}}} = {\rm{(}}n + {\rm{1/2)\lambda }}\quad {\rm{,}}$$
where n = 0, 1, 2, 3…, and λ is the wave length of the laser, 193 nm. The following is geometrically required,
 $$\underline {{\rm{SQ}}} {\rm{/}}\underline {{\rm{PQ}}} = {\rm{sin(2\theta ), }}\;\underline {{\rm{TQ}}} {\rm{/}}\underline {{\rm{PQ}}} = {\rm{cos(2\theta )}}\quad {\rm{.}}$$
From the relations (1) and (2), we find,
 $$\underline {{\rm{SQ}}} = {\rm{(}}n + {\rm{1/2)\lambda cot(\theta )}}\quad {\rm{.}}$$
Accordingly, we notice that it is a mapping (“bijection” in the mathematical meaning) of the cone surface onto the surrounding plane surface, where the selection rule (3) picks up the ripples.
From the SEM image of Fig. 4, we know that tan(θ) = 0.22. Then, according to the relationship (3), the spacing between the ripple rings should be 0.44 μm. The observed spacing in the SEM image was 0.41 μm, on the other hand. Considering the accuracy in the SEM measurements, the error of 7% here seems to be allowable. The diminishing tendency as the ring departs from the cone as seen in Fig. 4 is accordingly attributed to the increase of the integer “n.” Returning to Fig. 4, the outer extent of the ripple rings seems to extend beyond this theoretical expectation. This seems to be due to the fact that the shape of the cone is not geometrically ideal; there appears to be some tapering around the cone chip.
It is worth noticing again that the ring patterns result from the “bijection-mapping” of a cone surface onto the surrounding plane surface, where the interference rule (1) picks up the ripples in general. Therefore, the deformation of the cones from their ideal mathematical cone shapes were mapped and reproduced in ring patterns as seen in the SEM images of Figs. 7 and 8, where the equations (2) and accordingly (3) are not simply applied.
Finally, let us check the other examples of the interference patterns spreading around the cones. Figures 6 and 7 show the SEM image for sample B; Fig. 6 exhibits independent cones grown on the surface as also seen in Fig. 1(c); the three cones surrounded by the dotted circle are seen in Fig. 7; in particular, it is interesting to know that the ripple patterns spreading around the three cones are interfering each other inside the triangular zone made by them. It is also noticed that the shapes of the ripple patterns appear to have reproduced or reflected the distorted shapes of the cones almost precisely, in accordance with our “beam interference model” discussed above.
Incidentally, durations for the deposition of the samples A and B were 15 and 30 min, respectively, while those of the laser frequencies were 20 and 10 Hz, respectively (Table I). Then, the number of the laser pulses for the deposition of the samples A and B was the same (18,000 pulses). They had the same deposition conditions except for the duration and the laser frequencies. We suppose that their similar morphologies with independent cones are thus attributed to the same number of the laser pulses, accordingly.
Sample C was deposited under the same condition as that of sample A, except for the duration of 60 min; that was 15 min for the sample A. As a result, the individual nature of the cones as seen in sample A (Figs. 1, 3, and 4) was completely lost and they were densely agglomerated in sample C (Fig. 8). However, even on the surface of the agglomerated cones, the ripple patterns were found as seen in Fig. 8. In this case, we may suppose that the direct beam was cast on the surface of the cones while the reflected beams came from their neighboring cones, as easily seen from the ripple patterns on the central cone. We consider these images also as supporting the photochemical growth mechanism of the BN films and morphologies in our laser-activated plasma CVD processes.
For the sake of application, it is important to control distribution as well as the uniformity of the microcones. Although the present study is not directly indicative of the solution, it indicates that their formation mechanism is deeply concerned with optical effects in micro dimensions. As seen from Fig. 2, the problem with our laser was uneven distribution in the intensity. By inventing some optics to render the intensity of an excimer laser more homogeneous, at least the region where the cones grow can be extended much more. We suppose that a laser source with enough intensity and homogeneity at about 193 nm, which is not easily available for now as far as we know, is one of the most important factors for the application.
IV. CONCLUSIONS
-
(1) SEM observations revealed that individual and independent microcones of sp 3-bonded BN grown by laser-activated plasma CVD were accompanied by ripple patterns spreading around them.
-
(2) The ripple rings were expanding almost equidistantly at 0.4 μm from each other and diminishing as they depart from a cone in typical examples.
-
(3) The origin of the ripples was attributed to the interference of a direct laser cast on the plane surface and that reflected from the side of a cone; this simple model was satisfactorily in agreement with the SEM measurement, in which the side surface of a cone was mapped onto the plane surface surrounding the cone in the mathematical meaning of bijection.
-
(4) This micro-optical effect due to the wave nature of coherent excimer laser was considered to experimentally indicate and support the photochemically activated growth reactions in this process, as already discussed earlier mostly from a theoretical point of view or from more indirect experimental results.
-
(5) On the other hand, the film-thickness topography obtained by using the collimated beam x-ray diffraction method suggested experimentally that the shaping of the cone was performed by some kind of etching processes during the growth of the cones, simultaneously.
-
(6) The observation here is interesting as an optical phenomenon in micrometer scale owing to the coherent excimer laser with a short wave length of 193 nm.