The Quality of Life (QoL) measurement has been developing as a formal discipline with systematized theoretical bases and specific methodology for more than 30 years (Scientific Advisory Committee of the Medical Outcomes Trust, 2002). QoL has become progressively recognized as an important outcome measure in treatment studies and health service evaluation (Tiffany, Friedman, Greenfield, Hasin, & Jackson, Reference Tiffany, Friedman, Greenfield, Hasin and Jackson2012). The assessment of QoL with the objective of evaluating interventions, adverse effects of treatment and the impact of the disease process is widely used in clinical trials and in observational studies of health (Globe, Reference Globe1999). Notwithstanding, QoL and health status are different constructs, and therefore, instruments designed to assess health status may be inappropriate for assessing QoL. The concept of Health-Related QoL (HRQoL) was created to distinguish outcomes generated by health-based research from earlier sociological enquiries on well-being and life satisfaction in the healthy general population (Smith & Larson, Reference Smith and Larson2003).
In the field of drug and alcohol abuse, HRQoL has been used as an important clinical and research outcome. It was initially used as an outcome measure in methadone maintenance treatment (MMT; Reno & Aiken, Reference Reno and Aiken1993). HRQoL started to be used as an outcome measure also to evaluate “hard” indicators, including criminal behaviors, unemployment, and illicit drug use (Iraurgi, Reference Iraurgi1999). The concept of HRQoL is used in drug abuse research and clinical practice, including the assessment of the impact of therapeutic interventions on patients’ lives (Raisch et al., Reference Raisch, Campbell, Garnand, Jones, Sather, Naik and Ling2012; Wang et al., Reference Wang, Wu, Yen, Yeh, Chung, Chang and Yen2012).
In the field of substance use, the HRQoL has been measured mainly via generic tests. These tests evaluate representative behaviors from daily activities and most frequent symptoms in normal persons. The most commonly used generic tests in drug abuse research, including the Short Form 36-item (SF-36) and 12-item (SF-12) health surveys (Ware, Reference Ware1997; Ware, Kosinski, & Keller, Reference Ware, Kosinski and Keller1996), the World Health Organization Quality of Life (WHOQOL-Bref) assessment instrument (The WHOQOL Group, Reference Orley and Kuyken1994) and the Nottingham Health Profile (NHP; Hunt, McEwen, & McKenna, Reference Hunt, McEwen and McKenna1985), have been widely used in epidemiological research.
Some authors suggest that one of the main advantages of a generic test is its versatility when applied to different populations (Iraurgi, Reference Iraurgi2008). Conversely, these tests may not be sensitive enough to detect clinically relevant changes in patients with specific health disorders. Therefore, it has been advocated that, whenever the main goal is to evaluate the impact of of therapeutic interventions, HRQoL measurement tools should be used.
In recent years, some specific tests have been developed in drug abuse field, including the Injection Drug Users Quality of Life Scale (IDQUOL; Brogly, Mercier, Bruneau, Palepu, & Franco, Reference Brogly, Mercier, Bruneau, Palepu and Franco2003); the Quality of Life Scale for Drug Addicts (QOL-DA;Wan et al., Reference Wan, Fang, Jiang, Shen, Jiang, Tu and Wan2011); and the Health-Related Quality of Life for Drug Abusers (HRQoLDA) test (Lozano, Rojas, & Pérez, Reference Lozano Rojas, Rojas Tejada and Pérez Meléndez2009; Lozano et al., Reference Lozano, Domingo-Salvany, Martínez-Alonso, Brugal, Alonso and de la Fuente2008; Zubaran et al., Reference Zubaran, Sud, Emerson, Zolfaghari, Foresti and Lozano2012). The IDUQOL was conceptualized using the World Health Organization’s (WHO) definition of quality of Life. Initially was developed for injection drug user, but later version have been developed for non-injectors (Morales-Manrique, Valderrama-Zurián, Castellano-Gómez, Aleixandre-Benavent, & Palepu, Reference Morales-Manrique, Valderrama-Zurian, Castellano-Gómez, Aleixandre-Benavent, Palepu and Cocaine Group2007). QOL-DA was designed also using the WHO’s QOL concept. It consists of six domains of physical, psychological, level of independence, social relationships, environment and spirituality beliefs. It was developed for addiction patient, especially for patient with problems related with heroin.
The HRQoLDA test, or TECVASP test as originally known in the Spanish version, is a quality of life instrument developed specifically for the assessment of drug users and is based on the bi-axial concept of addiction of Edwards and Gross (Reference Edwards and Gross1976). According to these authors, the alcohol dependence syndrome was a combination of psychological and physiological process. This was one axis of alcohol problems, while social, legal and other adverse consequences conform another axis. This concept was generalized to other substances abuse, and it was the basis for DSM-IV abuse and dependence construct (APA, 1994). Following this logic, the operational definition of the TECVASP included some of the main symptoms of drug dependence, and physical, psychological and social problems related with drug abuse were included as specific items. The content of operational definition was submitted to experts judgment. After that, psychometric experts checked congruence between item-content. Finally, a pilot study was developed with a drug dependence sample. Understanding the items, time management, and the adequacy of the response format were evaluated (Lozano, Rojas, & Pérez, Reference Lozano, Rojas and Pérez2005). Response categories were a five-likert scale in each item, assessing a 30 days period. This specific instrument was designed to assist clinicians and researchers to determine to what extent and intense drug addiction affects people’s QoL.
Significant psychometric evidence supports the HRQoLDA test as a reliable and useful assessment tool. In preliminary studies, reliability, as determined by Cronbach’s alpha, was 0.798 or above in the assessment of samples of heroin cocaine, crack and alcohol users (Lozano et al., Reference Lozano Rojas, Rojas Tejada, Pérez Meléndez, Apraiz Granados, Sánchez Muñoz and Marín Bedoya2007). A study of the Spanish version of HRQoLDA test applying the Rasch Rating Scale Model demonstrated that the psychometric properties were suitable for measuring the HRQoL in a drug user population (Lozano et al., Reference Lozano Rojas, Rojas Tejada and Pérez Meléndez2009). But, the test has 2 weaknesses: Item 15 did not fit (it was recommended that it was not eliminated because of the importance its content has to the operative definition of the HRQoL) and one category of response utilized in this test shown an inadequate performance.
The Spanish version of the HRQoLDA test also revealed satisfactory validity evidence based on relations to other variables (Known Groups) in that significant differences were observed between heroin users in MMT and non-MMT individuals (Lozano et al., Reference Lozano Rojas, Rojas Tejada, Pérez Meléndez, Apraiz Granados, Sánchez Muñoz and Marín Bedoya2007). In terms of its relations with other variables, HRQoLDA scores have shown significant correlations with severity of dependence, as well as with physical and psychological health (Lozano et al., Reference Lozano, Domingo-Salvany, Martínez-Alonso, Brugal, Alonso and de la Fuente2008). The HRQoLDA test was also useful as a tool in the detection of clinical improvement among patients treated with buprenorphine (e.g. González-Saiz et al., Reference González-Saiz, Lozano Rojas, Martín Esteban, Bilbao Acedos, Ballesta Gómes and Gutiérrez-Ortega2011).
In this study, the authors present the results of the psychometric analysis performed by applying a Polytomous Rasch Model of the adaptation of the original Spanish version to English, as applied to a sample of substance users in Australia. Rasch models estimate both item and person parameters with the same model, offer person-free item parameter estimation and item-free person's measure estimation, provide an optimal scaling of individual differences, etc. (e.g., Reise & Henson, Reference Reise and Henson2003). The application of Item Response Theory (IRT) models (where Rasch models could be included) provides psychometric evidence cannot be obtained through the Classical Test Theory (CTT) analysis. The evidence from each psychometric approach helps to illustrate the methodological quality of an instrument. The COSMIN-COnsensus based Standards for the selection of health Measurement Instruments- checklist (Mokkink et al., Reference Mokkink, Terwee,., Patrick, Alonso, Stratford, Knol and de Vet2012) difference between the psychometric contributions from the CTT and IRT.
The specific aim of this study was to analyze the psychometric properties of the English version of HRQoLDA test applying the Rating Scale Model (RSM), and emphasizing (a) fit between empirical data and theoretical model assumptions; (b) item category probability curves; and (c) precision in terms of information function.
Method
Participants
This study evaluated 121 adults recruited from inpatient and outpatient treatment facilities across the Sydney West Area Health Service (SWAHS) catchment area in western Sydney, Australia. Research sites included Blacktown Hospital, Cumberland Hospital, Nepean Hospital, and the Mount Druitt Centre for Addiction Medicine, all of which are higher education training facilities within Sydney West Area Health Service (SWAHS).
Potential participants presenting for treatment were randomly invited to respond to the questionnaires. The inclusion criteria consisted of fulfillment of the DSM-IV criteria for substance abuse disorders (dependence and abuse) and the ability to understand the aim of the study, as well as the content of the questions in both questionnaires, which entailed a satisfactory command of English. Exclusion criteria comprised of presentations exclusively due to alcohol abuse and/or involuntary admission for inpatient treatment.
This study was granted approval by the SWAHS Human Research Ethics Committee. Prospective participants were provided with a written protocol pertaining to the study and a verbal explanation about the purpose of the study. They were also informed that participation was voluntary, confidential and anonymous. Volunteers were also informed that they could withdraw from this study at any time without any repercussion to their treatments. Research participants were then asked to sign an informed consent form prior to their inclusion in the study.
Instruments
The HRQoLDA Test is a quality-of-life assessment tool specific for drug abuse (Lozano et al., Reference Lozano Rojas, Rojas Tejada and Pérez Meléndez2009). It assesses the physical and psychosocial aspects of life through 20 five-choice items in a Likert-type scale, with choices being designated 1 to 5 points. The choices are scored as follows (see Appendix): items 1–14 (never, 1 to 2 times, 3 to 7 times, 8 to 14 times, 15 times or more), items 15–18 (never, a couple of times, sometimes, many times, all the time) and, items 19–20 (not at all, a little bit, a fair bit, pretty much, absolutely). A structure of one dimension has been checked for this version (Zubaran et al., Reference Zubaran, Sud, Emerson, Zolfaghari, Foresti and Lozano2012). The sum of the 20 scores represents quality of life, such that the higher the score, the better the quality of life.
The Spanish version of the HRQoLDA test, whose acronym is TECVASP test, was translated into English. Recommendations from the International Tests Commission were used in adaptation process, taking into account semantic, idiomatic, experiential, cultural, and conceptual equivalence between the source and the target instruments (e.g., Muniz, Elosua, & Hambleton, Reference Muñiz, Elosua and Hambleton2013). The final English version of the HRQoLDA test was published by Zubaran et al. (Reference Zubaran, Sud, Emerson, Zolfaghari, Foresti and Lozano2012) using Classical Test Theory analysis.
Procedure
Five data collectors underwent a period of training and supervision from the central researcher prior to administering questionnaires independently. The data collectors met regularly to address any queries and ensure each were following the same procedure.
The study participants completed the questionnaires under minimal guidance from the trained examiners, who followed standardized instructional procedures. Interviews took place in a suitable room at one of the research sites mentioned above. Occasionally, specific questions not considered in the initial instruction procedure were answered on a one-to-one basis. Particular care was taken with non-native English speaking participants in order to ensure a satisfactory understanding.
Analysis
The RSM, a Rasch model for polytomous items, was used in the psychometric analysis. The RSM transform person and item raw scores to interval measures which can be located on the same metric. If the data fit the RSM all the items measure one unidimensional construct. In the RSM, probability of response to an item (πnix) is a logistic function determined by ability of persons (βn) and item difficulty (δi). In the case of the HRQoL construct, the probability that a person will affirm an item is a logistic function of the difference between the person’s level of HRQoL and the level of HRQoL expressed by the item. The RSM is expressed by (e.g., Wright & Masters, Reference Wright and Masters1982)
 $${\pi _{nix}} = {{\exp \sum\limits_{j = 1}^x {\left[ {{\beta _n} - \left( {{\delta _i} + {\tau _j}} \right)} \right]} } \over {\sum\limits_{x = 1}^{m + 1} {\exp \sum\limits_{j = 1}^x {\left[ {{\beta _n} - \left( {{\delta _i} + {\tau _j}} \right)} \right]} } }}\quad \quad x = 1,2, \ldots .m + 1$$
where ßn is the location or value of person n on the scale (ability); δi is the location of the item on the scale (difficulty), and τj, called the threshold parameter, is the location of threshold m for each response category with respect to item location on the scale. A property of the Rasch models is that item location estimates and person ability estimates are expressed on the same metric and are directly comparable.
Fit analysis.
For the RSM, the response patterns achieved are tested against what is expected (Pallant & Tennant, Reference Pallant and Tennant2007). This is known as fit analysis. Rasch analysis results are interpretable only when data fit the model. A variety of fit statistics determine whether this is the case (Smith, Reference Smith2000). Mean square fit statistics (MnSq) and standardized mean square (Zstd) are two of the most commonly used statistics. Two indexes are reported in these statistics: the INFIT and the OUTFIT indexes. The INFIT index (MnSq and Zstd) is a t standardized information-weighted mean square statistic, which is more sensitive to unexpected behavior affecting responses to items near the person's measure level while the OUTFIT index (MnSq and Zstd) is a t standardized outlier-sensitive mean square fit statistic, more sensitive to unexpected behavior by persons on items far from the person's measure level (Linacre, Reference Linacre2000).
In general, data is fitted to the model when MnSq are between 0.5 and 1.5 logits. Values larger than 1.5 indicate unmodeled noise. Values less than 1.0 indicate overly predictable. For Zstd data is fitted to the model when values are within the range of -2 to +2. In this study, the psychometric software WINSTEPS (vers. 3.64.2) was used (Linacre, Reference Linacre2000).
Results
Items and persons fit
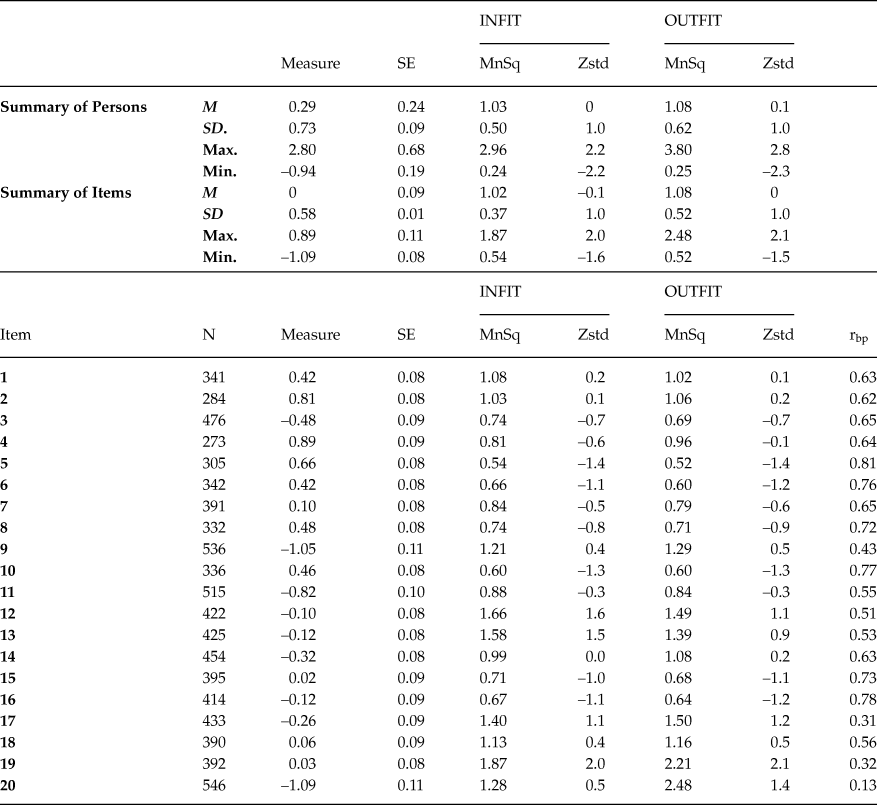
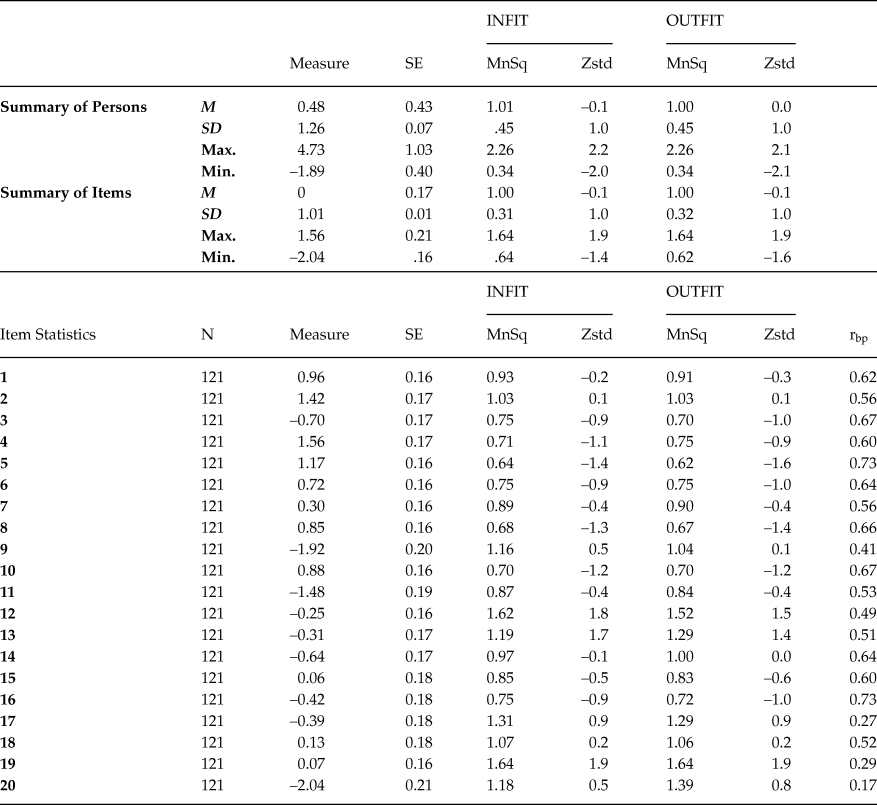
In general, the summary of items and persons show that there is a good fit between the reported data and the model (Table 1). Nevertheless, minimum and maximum values indicate that not all items and persons have acceptable fit values. Item analysis show that 6 of 20 items have MnSq values which go beyond an acceptable range. Specifically, values of items 12, 13, 17, 19 and 20 indicate that they cannot be modeled, and item 5 indicates overly predictable. On the other hand, all items except 19 have good values for Zstd statistics. Persons fit show that 68.6% of patterns of response observed are compatible with model.
Statistics of model and items with five response categories.

Note: MnSq: Mean square fit statistics; Zstd: Standardized mean square.
Items misfit indicates unpredictable responses. In those cases, additional psychometric analyses were pursued.
Thresholds and Category Probability Curve
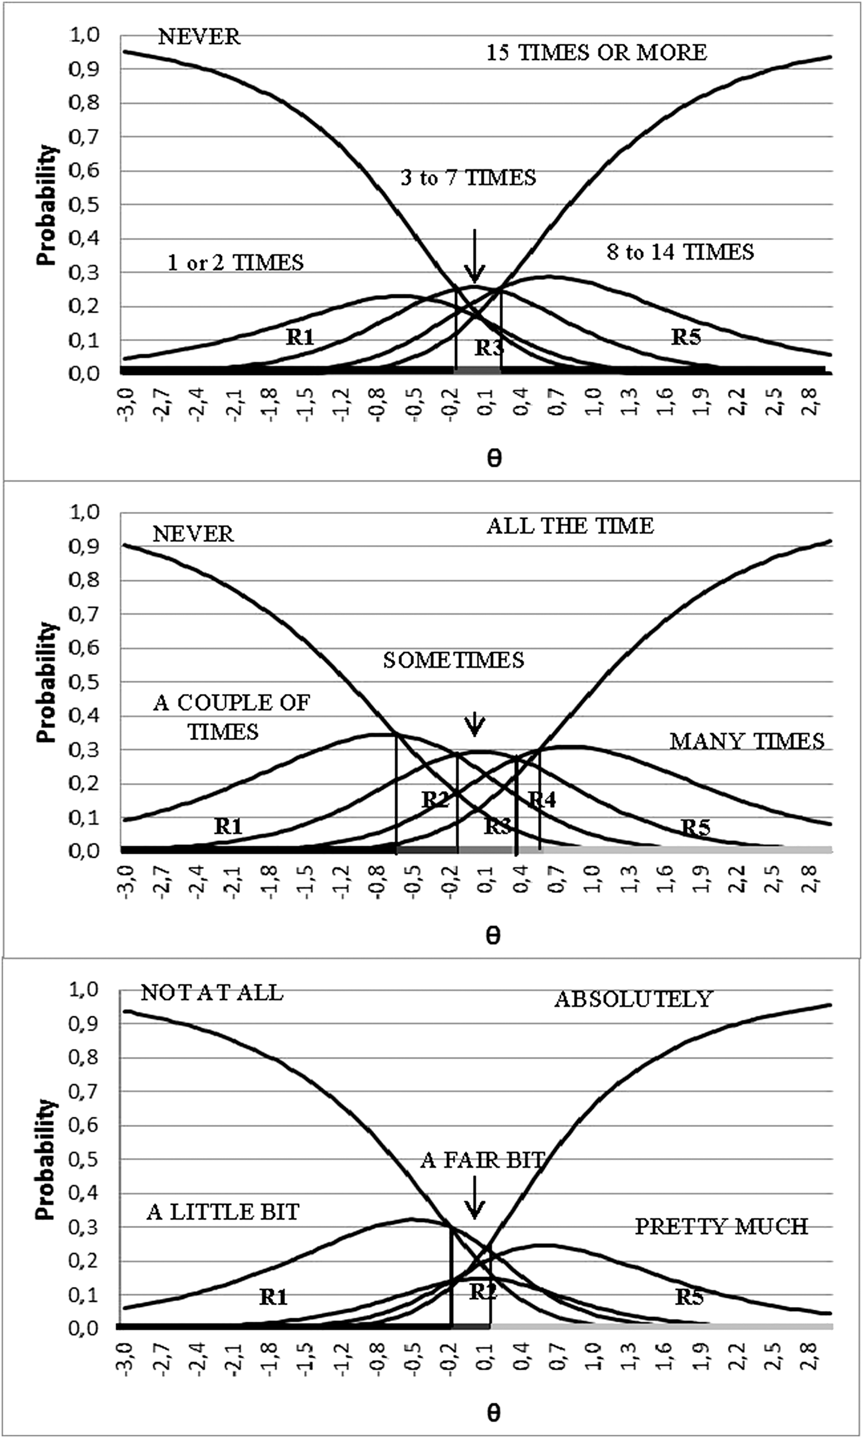
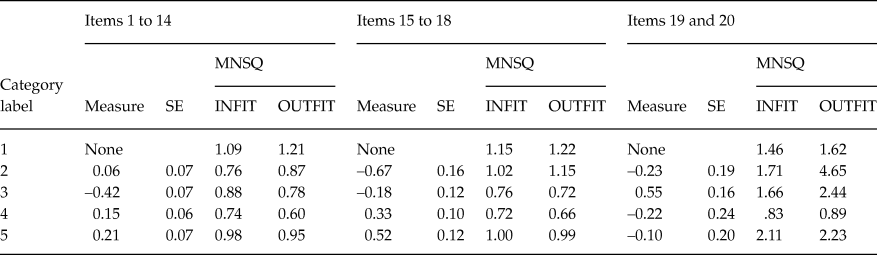
A Category Probability Curve (CPC) shows the probability of selecting each response category of an item along the HRQoL continuum. The values of threshold parameter values are shown in table 1. For items 1 to 14, the response category 3 has a lower threshold than category 2. In items 19 and 20, the threshold values for category 3 are superior to those for categories 4 and 5. The implication is that categories in these items are disordered.
Graphically, it can be observed that threshold parameters have influenced the CPC in each response format (Figures 1.A, 1.B and 1.C). An item with five response categories produces five regions of probable response in a continuum of values (regions: R1, R2, R3, R4 and R5). In this case, for items 1 to 14, response categories 2 (‘1 to 2 times’) and 4 (‘8 to 14 times’) are not the most likely categories in any segment of the continuum (Figure 1.A). Also, for items 19 and 20 (Figure 1.C.), response categories 3 (‘a fair bit’) and 4 (‘pretty much’) are not the most likely in any segment of the continuum.
Category Probability Curves for items with five categories.

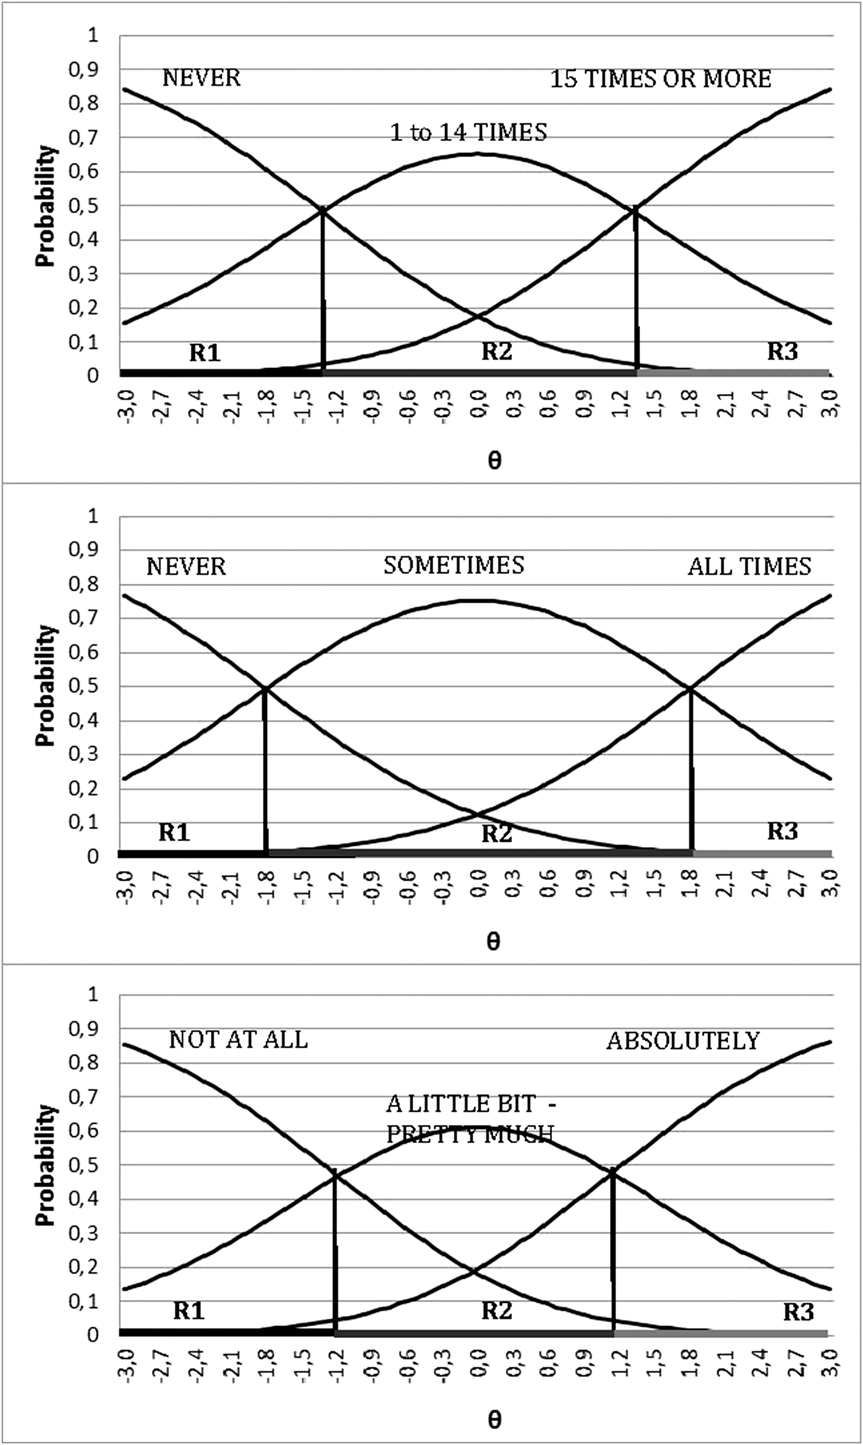
The five item response categories should generate five distinct peaks where each category is most probable along a range of locations on the latent variable, suggesting empirical observations are consistent with intended category ordering. As it does not happen, the five response categories were reduced (ad doc) to three response categories (recoding 12223). Later, threshold parameters were ordered accordingly. Figures 2.A, 2.B and 2.C can show that CPC has been effective, in that each category defines a region of likely response in the continuum.
Category Probability Curves for items with three categories.

Results of the recoding procedure have altered the way data fit the model. Table 1 shows that 18 out of 20 items have achieved optimal adjustment values. However, items 12 and 19 have generated inappropriate values of MnSq, but not in ZSTD. Taking into account these results as well as the importance of the content of the operative definition conveyed by these items, the authors have decided to retain these respective items. As a result, the percentage of research participants who presented adjusted parameters of responses increased to 73.7%.
Items and persons map
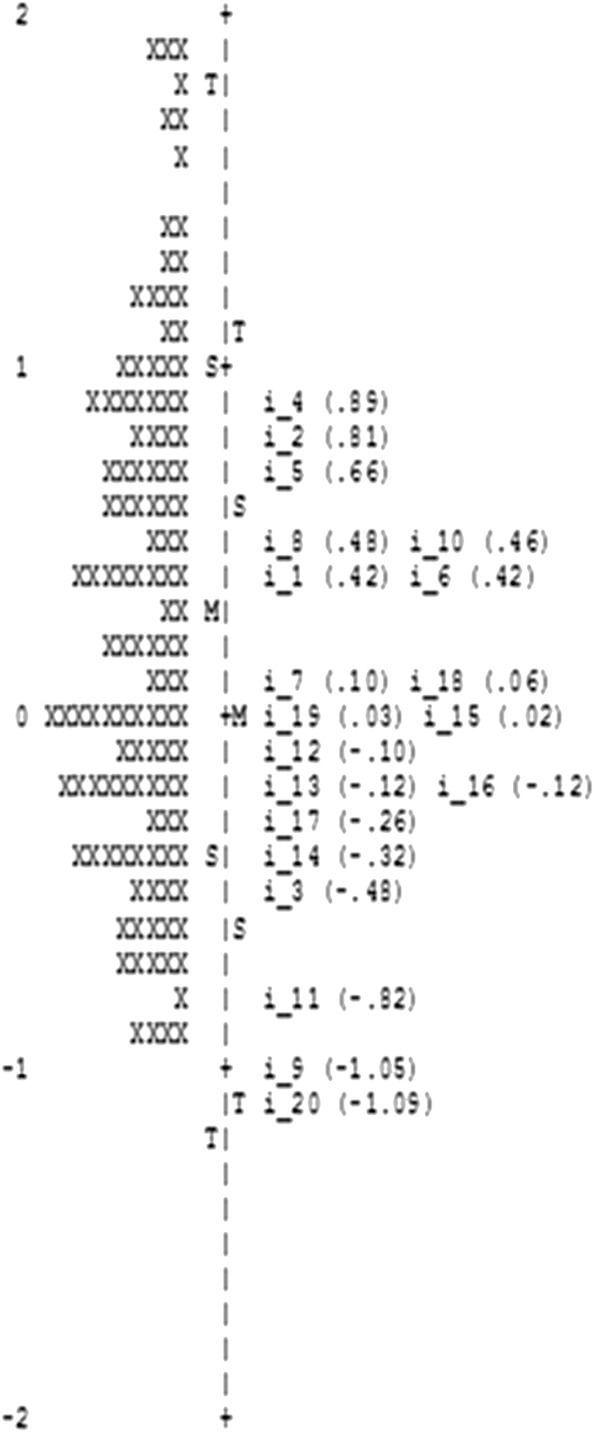
The items and persons map (figure 3) shows the combined position of persons and items on the HRQoL continuum. On the left are the measurements of the persons, and on the right the items appear in order according to their values (table 2) on the HRQoL construct. Respondents are located to the left, represented by an ‘X’. To the right are positioned all items, including in parentheses the respective value in the scale of each item. Letters ‘M’, ‘S’ and ‘T’ indicate the mean value, with one and two standard deviations respectively.
Item and person map.

Summary of category structure for items.

Statistics of model and items with three response categories.

Note: MnSq: Mean square fit statistics; Zstd: Standardized mean square.
The items with lower values are items 20 (self-referential expectations), 9 (hallucinations) and 11 (become disoriented). Items in the scale with higher values are item 4 (lack of energy), 2 (sleeping problems) and 5 (felt anxious). This calibration of items generates a more comprehensive and accurate instrument’s structure vis-a-vis the assessment of persons with substance use disorders. For instance, taking into consideration individual ‘A’ with low self-referential expectations, his or her answers in the remaining items would probably indicate a low HRQoL. By contrast, an individual ‘B’ who reports lack of energy, most probably will show a pattern of responses to remaining items indicating a better HRQoL.
The position of persons demonstrates that most of them are located between the item with the highest and the lowest value in the scale. On the other hand, 19.8%, presented HRQoL scores above the item of highest value in the scale.
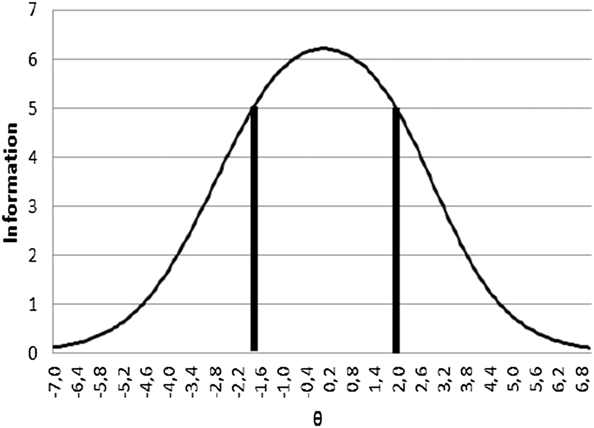
Test Information Function
The test information function reports the test precision at different levels of the HRQoL construct. Information curves are analogous to reliability of measurement and indicate the precision (reciprocal of the error variance) of a test along the underlying trait continuum (Hays, Morales, & Reise, Reference Hays, Morales and Reise2000). In Figure 4 it can be seen that the scale has its maximum precision in the central values of a continuum of scores.
Test Information Function.

Rasch models compute a separation index for persons and another for items instead of reliability coefficients. Person separation index (PSI) is used to classify people and represents the number of statistically different performance strata that the instrument can detect in the sample. Low person separation (< 2) indicates that the instrument could be not sensitive enough to distinguish between high and low performers and more items may be needed (Linacre, Reference Linacre2014). The PSI was 2.45, corresponding to a Rasch person reliability of 0.86 per persons. The Rasch reliability (of persons) is comparable to the traditional test reliability.
Item separation is used to prove the item hierarchy. The hierarchy of item is especially important because the proposed items can be compared with the order of item locations estimated from the data (Linacre, Reference Linacre2014). Low item separation (< 3) implies that the person sample is not large enough to confirm the items hierarchy of the instrument (the test has no item with high, medium, low locations; Linacre, Reference Linacre2014). The separation index for items was 5.39, corresponding to an item reliability of 0.97. The mean SE of items was 0.17.
Discussion
The continuous use of psychoactive drugs produces impairments of different spheres of human health and behavior. The HRQoL is considered one of the essential measures required for the optimal assessment of the results of treatment interventions in drug dependence (Tiffany et al., Reference Tiffany, Friedman, Greenfield, Hasin and Jackson2012).
The most widely used instruments for this purpose are the generic tests such as the SF-36, the WHOQoL and the NHP. Nevertheless, different authors called attention to the need to develop HRQoL tests that are specific to the context of substance use (Domingo-Salvany et al., Reference Domingo-Salvany, Brugal, Barrio, González-Saiz, Bravo and de la Fuente2010). The scores of an ideal test should be sensitive to change in the behavior of substance users in response to therapeutic interventions. The HRQoLDA Test has demonstrated adequate psychometric properties when used in samples of substance users in Spain (Lozano et al., Reference Lozano Rojas, Rojas Tejada, Pérez Meléndez, Apraiz Granados, Sánchez Muñoz and Marín Bedoya2007; Reference Lozano Rojas, Rojas Tejada and Pérez Meléndez2009). The validation studies of this tool have been developed with users of different substances, in which scores were sensitive to different therapeutic interventions (Lozano et al., Reference Lozano Rojas, Rojas Tejada, Pérez Meléndez, Apraiz Granados, Sánchez Muñoz and Marín Bedoya2007; Reference Lozano, Domingo-Salvany, Martínez-Alonso, Brugal, Alonso and de la Fuente2008).
In this study the authors have aimed to demonstrate a preliminary analysis of the psychometric properties using RSM of the English version of the HRQoLDA Test in an Australian sample. This research effort therefore addresses an important deficiency in the field of substance use disorders. A particular advantage of this study lies in the application of the Rasch models, which allows for a more precise analysis of psychometric properties than CTT measurements. Also, scores obtained from Rasch models show some advantages when compared to CTT models (Conrad & Smith, Reference Conrad and Smith2004), for which reason the use of these models has been progressively increasing in health care research.
The results indicate that the pattern of answers observed in the measurement of HRQoL in this sample fits the predictions established with RSM. When items are recoded into three alternatives of responses, it can be stated that there is a reasonable adjustment of the items that form the HRQoLDA test. The recoding of responses has also generated an increment in the percentage of people demonstrating an adequate fit. In addition, as demonstrated, the CPC reveal an adequate performance in the three formats of answers utilized in this test.
However, the original response format had five alternatives. Two CPC of five never peaked along the HRQoL continuum. These results and the study of Lozano et al. (Reference Lozano Rojas, Rojas Tejada and Pérez Meléndez2009) suggest that the five-point response did not appropriately target respondents. One hypothesis to explain this result is the lack of ability of patients to discriminate between the response categories. Thus, the results suggest that patients simplify how they feel the symptoms: the symptoms are not present, or are always present, or are occasionally. This hypothesis is consistent with the results found by Chachamovich, Fleck, & Power (Reference Chachamovich, Fleck and Power2009). These authors administered the WHOQOL-BREF in graduate level readers and nonreaders. According to these authors, reducing the number of response categories improve the execution for nonreaders group. Nonreaders do not interpret the scale as a true five-category scale, but exhibit a response pattern indicative that only three categories are in fact considered.
Regarding the precision of the test, the measurement error is slightly superior to the one found in the Spanish version of the test. Nevertheless, in the Spanish version a larger sample size was evaluated (Lozano et al., Reference Lozano Rojas, Rojas Tejada and Pérez Meléndez2009), which contributes towards a more precise estimate of the item parameters. The test information function has demonstrated that the highest precision of the instrument is to be found in the central values of the score range.
The use of Rasch models may have other clinical implications for patients (McHorney, Ware, & Haley, 1997): (1) the scoring system is on the same scale for people and items. Thus, by the item and person map a comprehensive evaluation of the therapeutic needs of each patient can be made. For example, a patient with a score of -0.50 logits should have no problems of disorientation, or hallucinations, and have appropriate expectations of leaving the drug. His/her person measure is greater than these three items measures and lower the rest of the items measures. This information may be useful for therapeutic targets that must be achieved in the course of treatment; (2) the estimation of measurement error for each person represents a gain, allowing clinicians to do a more accurate estimation of patient’s situations; (3) because the scores are expressed in a interval level, it is possible to interpret the score differences on longitudinal evaluations; (4) finally, because the observed person response patterns are contrasted with the expected or theoretical person response patterns, clinicians may question the validity of the responses of patients who present misfit. In such cases it would be necessary to conduct further exploration.
Another element of interest in this work is the comparison with the Spanish version of the hierarchical structure of the items in the HRQoL continuum (Lozano et al., Reference Lozano Rojas, Rojas Tejada and Pérez Meléndez2009). The five items with a lower value of HRQoL measure, located between the first and second standard deviation below the average person, are the same in both versions. Three of the seven items in the top positions of the continuum (lacked energy, nervous and depressed) between the mean value and first standard deviation of people, also are the same. These similarities can be interpreted with clinical interest, but with caution. Under a clinical perspective, items with lower scale value would indicate that, in drug addicts, and regardless of culture, are less impacting on HRQoL (see Appendix). By contrast, among the items that most negatively affect the HRQoL of these patients, regardless of cultural differences, are feeling lacked of energy, nervous and depressed. However, because both studies have not followed the same methodological design, it need to be careful with these comparisons.
One of the limitations of the present study relates to the sample size, which was of 121 participants, which may have influenced the estimate of the parameters of items and respondents. Despite this possible limitation, it has been demonstrated in different studies that analyses using the Rasch models are able to generate precise estimates even with small sample sizes (Smith, Rush, Fallowfield, Velikova, & Sharpe, Reference Smith, Rush, Fallowfield, Velikova and Sharpe2008). The authors demonstrated that mean square statistics were relatively independent of sample size for polytomous data and that misfit to the model could be identified using published recommended ranges. Revici, Chen, and Gelhorn (Reference Revici, Chen and Gelhorn2013), based on the simulation study, demonstrated that “there were more stable estimates observed in samples that were of size 100 or greater” (p. 22).
Considering these results with RSM with an Australian sample, the HRQoLDA Test indicates adequate psychometric properties. Future studies are needed in order to compare the psychometric properties of the current version of the instrument in samples of other English speaking nations.
Appendix
HRQoLDA (Health-Related Quality of Life for Drug Abusers) Test
The following questions will ask you about your health during the last month. Your task will consist of answering each of the questions with complete honesty. For this, you will have 5 alternatives for your answer (you should chose only one). These choices indicate the extent to which you have had the symptoms and situations described in the questions. Before you start, remember that it is important that you answer honestly. Choose the answer that best represents your experience during the last 30 days. If you have any questions, please ask the interviewer before you begin.
During the last month, how often:
-
1. Have you had pain (physical)?
-
2. Have you had sleeping problems?
-
3. Have you vomited (or had nausea)?
-
4. Have you felt tired (lacked energy)?
-
5. Have you felt anxious (nervous)?
-
6. Have you felt depressed (sad, hopeless, “felt like giving up”)?
-
7. Have you felt aggressive?
-
8. Have you had problems remembering things (names, where you put things, etc.)?
-
9. Have you had hallucinations?
-
10. Have you had problems concentrating (“losing your train of thought”)?
-
11. Have you become disoriented (“not sure where you were”)?
-
12. Have you used illicit drugs to feel better physically?
-
13. Have you used illicit drugs to feel better psychologically (mentally)?
-
14. Have you had a physical problem that made it difficult for you to do your daily activities (to get dressed, to shower, etc.)?
-
15. Have you felt that your physical health had worsened?
-
16. Have you felt that your psychological (mental) health had worsened?
-
17. Have you felt that people cared about you?
-
18. Have you had family problems?
-
19. Do you believe that drug use reduced your social activities (to go out with friends, to work, etc.)?
-
20. Do you believe that some people can quit drugs?