Introduction
The inner ear is highly sensitive to vascular pathological changes. It is well known that hypercholesterolaemia causes arteriosclerotic changes in vessel walls, leading to partial vascular obstruction and end-organ hypoxia. It has been proposed that these arteriosclerotic changes in cochlear vessels lead to hearing loss.Reference Axelsson and Lindgren1 Increased blood viscosity, microthrombosis and/or altered vasomotion may also contribute to hearing loss.
The role of hyperlipidaemia in causing atherosclerosis and coronary artery disease is well recognised.Reference Glueck, BM and RI2 The serum cholesterol level is the most important factor in determining an individual's risk of developing atherosclerotic coronary disease (i.e. the higher the serum cholesterol, the greater the risk).Reference Dawber, Moore and Mann3, Reference Kannel, Dawber, Kagan, Revotskie and Stokes4
Hyperlipidaemia has been associated with hearing loss, and a recent study reported hearing impairment in patients with low serum values of high-density lipoproteins (HDLs).Reference Suzuki, Kaneko and Murai5 However, this study had two drawbacks: (1) it used pure tone audiometry, which is a subjective test, whereas evoked response audiometry could have provided better results, and (2) the isolated effect of any lipid fraction cannot be assessed in isolation, as hyperlipidaemia involves two or more abnormal lipid fractions that may have a combined effect on auditory functions. We therefore conducted a prospective, cross-sectional study to further evaluate the effect of various lipid fractions on auditory responses.
Materials and methods
The normal values for serum total cholesterol, HDLs, low-density lipoproteins (LDLs) and triglycerides were adopted as prescribed in the Adult Treatment Panel III final report.6 Patients with high serum levels of at least two of the four lipid fractions were classified as hyperlipidaemic.
This study had two groups, each consisting of 25 individuals with no hearing loss at any frequency on pure tone audiometry. Group 1 comprised 19 men and six women who were hyperlipidaemic (diagnosed for the first time); this group had a mean age ± standard deviation (SD) of 39.6 ± 6.8 years. Group 2 comprised 16 men and nine women who were normolipidaemic (control group); this group had a mean age of 40.1 ± 6.9 years.
The exclusion criteria of the study were: (1) diabetes mellitus, hypertension, coronary artery disease or ischaemic heart disease, stroke, chronic renal failure, chronic liver disease, nephrotic syndrome, or smoking; and (2) a history of hearing loss, ear trauma, ear discharge, ingestion of ototoxic drugs, ear surgery, head injury, oral contraceptives, or abnormal laboratory results other than serum lipids.
An audiological evaluation was carried out before starting any antihyperlipidaemic treatment. The initial hearing evaluation used a pure tone audiometer (AC40 Clinical Audiometer, Interacoustics A/S, DK-510, Assens, Denmark) installed in a soundproof room in the otolaryngology department.
Brainstem evoked response audiometry test protocol
Wave parameters were recorded with a brainstem evoked response audiometer (EP-15, Interacoustics A/S) for all subjects, using alternating polarity clicks, for each ear. Stimuli in the form of rarefaction clicks were presented at the rate of 39.1/second, at 80 dB sound pressure level, to each ear in turn. A low-pass filter at 150 Hz and high-pass filter at 3000 Hz with sweeps of 2000 were used. Stimulus was given to the test ear via headphones, and five waves (I–V) were recorded per stimulus in each ear. Waves were identified as per universal standards.
Statistical analysis
Mixed analysis of variance (ANOVA) was performed separately for each waveform. Repeated measure ANOVA was performed to compare ears, with group as the independent factor.
To determine the effect of the serum value of each lipid fraction on the brainstem evoked responses, the patients with hyperlipidaemia (group 1) were further subdivided into two subgroups depending upon their serum level of each lipid fraction: subgroup 1a comprised patients whose serum level was less than the group mean serum level, and subgroup 1b comprised those whose serum level was greater than the group mean serum level. These subgroups were then compared with each other and with group 2 (controls).
Sample sizes in these three groups were not similar, so non-parametric tests were administered. The three groups were compared using the Kruskal–Wallis test. If any significant difference was observed, pair-wise comparisons were conducted using the Mann–Whitney U test.
The main objective of the study was to determine the relationship between each waveform and the various lipid fractions. This was carried out using Pearson's correlation and stepwise linear regression. Correlation and regression were assessed for each waveform separately, and also separately for the different ears (left and right) and the different groups. A p value of less than 0.05 was considered statistically significant.
Results and analysis
Combined effect of lipid fractions on auditory brainstem evoked responses
The various lipid fractions found in the patients in groups 1 and 2 were compared by applying an independent t-test. A statistically significant difference was found between the groups, for all lipid fractions (Table I).
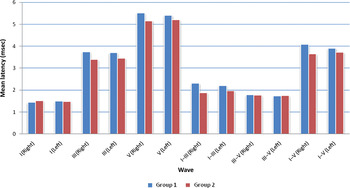
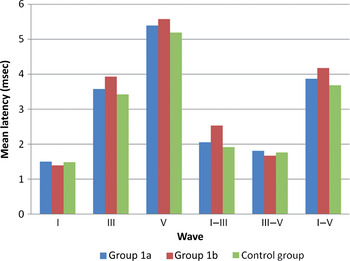
Graphical representation of Table I data, comparing auditory brainstem responses in groups 1 and 2.

Serum lipid levels for groups 1 and 2

HDL = high-density lipoproteins; LDL = low-density lipoproteins
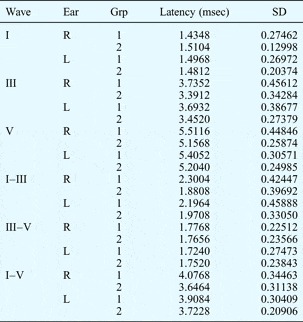
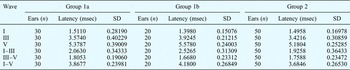
The auditory brainstem evoked responses of these two groups (Table II and Figure 1) were analysed by applying mixed ANOVA. We found that the two groups had no statistically significant difference in wave I and wave III–V interpeak latency but these groups showed a statistically significant difference in all other waves (p < 0.01).
ABER results by ear and group

Latency data represent mean values. ABER = auditory brainstem evoked response; grp = group; SD = standard deviation; R = right; L = left
Subgroups 1a and 1b were compared with each other and with group 2 (controls). The results for the Kruskal–Wallis and Mann–Whitney tests for each lipid fraction were as follows.
Cholesterol
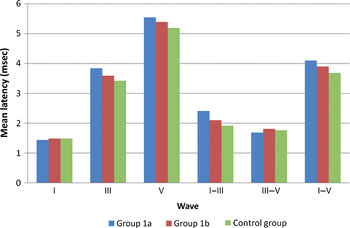
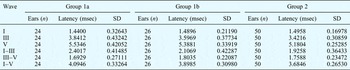
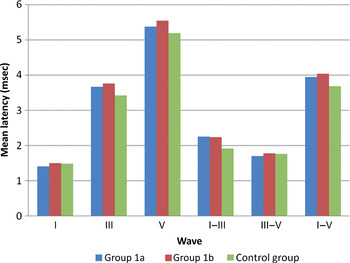
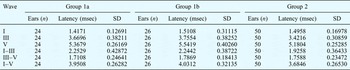
Table III and Figure 2 show results for cholesterol analysis. The mean serum cholesterol values in groups 1 and 2 were 297.6 ± 86.5 mg/dL and 145 ± 13.9 mg/dL, respectively. Comparison of the two group 1 cholesterol subgroups showed significantly different results (p < 0.05) for wave III latency and wave I–III and I–V interpeak latency. Cholesterol subgroup 1a and group 2 results differed significantly for all waves apart from the III–V interpeak latency. In contrast, cholesterol subgroup 1b and group 2 results differed significantly for waves III and V and for the I–V interpeak latency.
Graphical representation of Table III data, comparing cholesterol subgroups with controls. See text for subgroup definitions.

ABER results for cholesterol subgroups and controls

Latency data represent mean values. ABER = auditory brainstem evoked response; SD = standard deviation
High-density lipoproteins
Table IV and Figure 3 show results for HDL analysis. The mean serum HDL values in groups 1 and 2 were 43 ± 10.4 mg/dL and 65.6 ± 5.4 mg/dL, respectively. The two HDL subgroups did not differ significantly as regards wave latency results (p > 0.05). However, HDL subgroup 1a and group 2 had significantly different results (p < 0.05) for all waves apart from waves III and V and the I–III and I–V interpeak latencies. In contrast, the HDL subgroup 1b and group 2 results showed significant differences (p < 0.05) for all these latter parameters (i.e. wave III and V latencies and I–III and I–V interpeak latencies).
Graphical representation of Table IV data, comparing high-density lipoprotein subgroups with controls. See text for subgroup definitions.

Descriptive statistics for high-density lipoprotein subgroups and control group

Latency data represent mean values. SD = standard deviation
Low-density lipoproteins
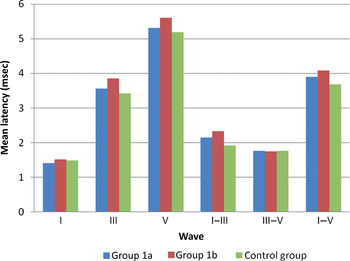
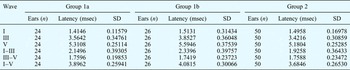
Table V and Figure 4 show results for LDL analysis. The mean serum LDL values in groups 1 and 2 were 186.1 ± 69.0 mg/dL and 73.08 ± 10.8 mg/dL, respectively. The two LDL subgroups differed significantly (p < 0.05) as regards waves III and V. The LDL subgroup 1a and group 2 differed significantly as regards wave I–V interpeak latency, whereas LDL subgroup 1b and group 2 differed significantly (p < 0.05) as regards waves III and V latencies and I–III and I–V interpeak latencies.
Graphical representation of Table V data, comparing low-density lipoprotein subgroups with controls. See text for subgroup definitions.

Descriptive statistics for low-density lipoprotein subgroups with control group

Latency data represent mean values. SD = standard deviation
Triglycerides
Table VI and Figure 5 show results for triglyceride analysis. The mean triglyceride values in groups 1 and 2 were 301.8 ± 137.8 mg/dL and 118.3 ± 12.2 mg/dL, respectively. The two triglyceride subgroups differed significantly as regards wave III and I–III and I–V interpeak latencies. Compared with group 2, triglyceride subgroup 1a showed significant differences (p < 0.05) for wave V and the I–V interpeak latency, whereas triglyceride subgroup 1b showed significant differences (p < 0.05) for waves III and V and I–III and I–V interpeak latencies.
Graphical representation of Table VI data, comparing triglyceride subgroups with controls. See text for subgroup definitions.

Descriptive statistics for triglycerides subgroups and control group

Latency data represent mean values. SD = standard deviation
Effect of individual lipid fractions on auditory brainstem evoked responses
Group 1
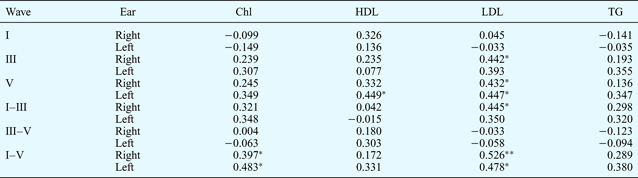
Table VII shows Pearson's correlation coefficient for the waveform and lipid fraction data assessed in group 1. It can be seen that LDL results significantly correlated with many waveform results, whereas triglyceride results did not significantly correlate with any of the waveform results. Stepwise regression also found that LDL value was a significant predictive factor for many waveform results (Table VIII).
Pearson's correlation coefficient for lipids and ABER values: group 1
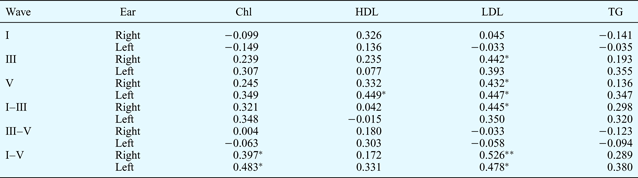
*p < 0.05; **p < 0.01. ABER = auditory brainstem evoked response; Chl = cholesterol; HDL = high-density lipoproteins; LDL = low-density lipoproteins; TG = triglycerides
Stepwise regression for lipids and ABER values: group 1

*p < 0.05; **p < 0.01. ABER = auditory brainstem evoked response; Rt = right; L = left; LDL = low-density lipoproteins; HDL = high-density lipoproteins; Chl = cholesterol
Group 2
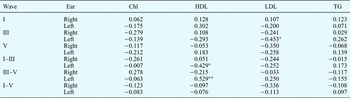
Table IX shows Pearson's correlation coefficient for the waveform and lipid fraction data assessed in group 2. It can be seen that HDL results significantly correlated with results for two of the waveforms (I–III interpeak latency with p < 0.05, and III–V interpeak latency with p < 0.01), whereas cholesterol and triglyceride results did not significantly correlate with any of the waveform results. Stepwise regression showed that the HDL value was a significant predictive factor for I–III interpeak latency (p < 0.05), and III–V interpeak latency (p < 0.01), whereas the LDL value was a significant predictive factor (p < 0.05) for waveform III (Table X).
Pearson's correlation coefficient for lipids and ABER values: group 2

*p < 0.05; **p < 0.01. ABER = auditory brainstem evoked response; Chl = cholesterol; HDL = high-density lipoproteins; LDL = low-density lipoproteins; TG = triglycerides
Stepwise regression for lipids and ABER values: group 2

*p < 0.05; **p < 0.01. ABER = auditory brainstem evoked response; L = left; LDL = low-density lipoproteins; HDL = high-density lipoproteins
Discussion
Hyperlipidaemia represents a group of clinical and biochemical conditions in which blood lipid levels are abnormal.6 The role of hyperlipidaemia in atherosclerosis and coronary artery disease has long been recognised.Reference Rosen, Olin and Rosen7 Atherosclerosis manifests as lipid-containing intimal lesions of the small and large arteries, and has a severely detrimental effect on the blood and oxygen supply to any given organ.Reference Spencer8
An important relationship exists between vascular disease and auditory dysfunction.Reference Morizono and Paparella9 Electron microscopic examination of the cochleae of guinea pigs fed on a high-lipid diet showed vacuolar and parenchymal protrusions on the surfaces of the stria vascularis and the organ of Corti, oedema in the strial marginal layer and outer hair cells, and vacuolar degeneration around the capillary vessels of the stria vascularis.Reference Saito, Sato and Saito10–Reference Satar, Özkaptan, Sürücü and Öztürk13 However, widespread auditory changes do not correlate with the pathology in the inner ear; therefore, other factors must also play a role in auditory dysfunction in hyperlipidaemic patients.
Ben-David et al. have reported significant changes in the auditory brainstem evoked responses in hyperlipidaemic in comparison to normolipidaemic subjects.Reference Ben-David, Pratt, Landman, Fradis, Podoshin and Yeshurun14 Our study provides further evidence of such changes: our hyperlipidaemic patients showed significant increases in wave III and V latencies and wave I–III and I–V interpeak latencies, compared with normolipidaemic subjects.
Suzuki et al. examined 924 individuals; for each lipid fraction, participants were divided into a high-level group (i.e. serum lipid concentration equal to or greater than 1 SD higher than mean) and a low-level group (i.e. serum lipid concentration equal to or less than 1 SD lower than mean).Reference Suzuki, Kaneko and Murai5 The pure tone audiometry results for each of these two groups were compared and analysed by t-test. The authors found a significant increase in hearing threshold in the HDL low-level group compared with the HDL high-level group. However, they did not comment on the serum values of the associated lipid fractions in the HDL low-level group, which might have influenced this group's results.
We used a similar methodology to that of Suzuki et al. However, we did not divide patients on the basis of mean ± 1SD, as the sample size was too small. Instead, we divided our hyperlipidaemic patients into two subgroups: a high-level group (whose serum levels of the lipid fraction of interest were greater than the group mean serum level for that lipid fraction) and a low-level group (with lower serum levels than the group mean level for that lipid fraction). These two groups were compared with the normolipidaemic group using non-parametric tests. Using this system of comparison, we found several significant associations between lipid fraction values and auditory brainstem evoked responses. Our findings support the hypothesis of a combined effect of various lipid fractions on hearing, in hyperlipidaemic patients.
The effect of any one lipid fraction on auditory function can be evaluated by conducting a study, with a large sample, in which individual subjects have only one altered lipid fraction. Statistical tools (e.g. linear regression) can then be used to analyse the data and test the study hypothesis.
• Hyperlipidaemia has been implicated in hearing impairment
• A low level of high-density lipoproteins has been associated with auditory dysfunction
• This study found an association between increased low-density lipoprotein levels and abnormal brainstem evoked response audiometry waves
In the current study, Pearson's correlation and stepwise regression were used to analyse results from the hyperlipidaemic and normolipidaemic groups. We found that hyperlipidaemic patients had a significant correlation between LDL values and wave III and V latencies and I–III and I–V interpeak latencies. In contrast, cholesterol and HDL values were significantly correlated with I–V interpeak latencies and wave V latencies, respectively. In our study group, triglyceride values were not significantly correlated with any waveform. In our normolipidaemic group, we found fewer correlations between lipid fractions and waveforms. These findings suggest that increased serum concentrations of LDLs and cholesterol, and decreased serum concentrations of HDLs, have a greater effect on auditory functions, compared with altered levels of other lipid fractions.
However, as discussed earlier, this statement needs to be interpreted cautiously as the effect of other lipid fractions on these observations cannot be ignored. As mentioned earlier, increased cholesterol and LDL levels and decreased HDL levels can all cause atherosclerosis and reduce organ blood supply. These pathological characteristics of hyperlipidaemia are further investigated in the current study.
Conclusion
In this study, LDLs were found to be significantly associated with many auditory brainstem evoked response waveform alteration; hence, we believe it to be one of the major lipid fractions involved in auditory dysfunction. However, hyperlipidaemia involves abnormal serum values of at least two lipid fractions; therefore the individual effect of each lipid fraction could not be assessed adequately. Hence, a study with a larger sample size is required to adequately assess the effect of the various lipid fractions on auditory dysfunctions.