American slavery has long fascinated scholars. Over the past 40 years few issues have so sharply divided cliometricians as the performance and nature of the slave economy. These debates have generally focused on static questions such as the relative efficiency of slave and free labor enterprises. Much of this research has relied on the Parker-Gallman sample, which provides a cross-sectional view of cotton farms and plantations as recorded in the 1859 Census. We take a decidedly more dynamic approach. Our goal is to explain the forces that propelled the rapid expansion of the American cotton economy and made the South the world's dominant producer of the Industrial Revolution's key raw material. In doing so we place the history of slavery and cotton plantations into the context of the more general literature on the sources of American productivity growth.
Standard accounts treat the technology of cotton production as static following the invention and refinement of Eli Whitney's 1793 saw gin. Given that cotton cultivation remained a hand labor task throughout the slavery period and that no machines comparable to the reaper gained acceptance, this view seems plausible at first glance. All early attempts to develop mechanical cotton harvesters failed. The stereotype of an “uninventive South” is reinforced by the region's low level of patenting activity. Implicit in this treatment is the assumption that all Upland cotton was alike. But cotton was not cotton. The qualitative accounts of planter-historian B. C. L. Wailes, agronomist J. O. Ware, historian John Hebron Moore, and others, asserted that southern planters created superior cotton varieties that significantly increased cotton yields, fiber quality, and the amount of cotton that could be picked in a day.
The surviving archival records of 142 plantations allow us to construct a panel dataset including 509 crop years and 704,800 daily observations of the cotton production activities of 6,200 individual enslaved African Americans. The data clearly document the revolution in cotton-picking efficiency—between 1801 and 1862 the average amount of cotton picked per slave in a day quadrupled. This rapid growth in picking efficiency—2.3 percent per annum—was substantially faster than the advance in labor productivity in the overall economy.
Although many have declared this period of the South's history to be devoid of indigenous technological advances, the region was the undisputed world leader in the creation of superior cotton varieties. Despite concerted efforts, the British were unable to replicate the results in their far-flung colonial empire. The achievements of antebellum southern cotton breeders surpassed those of northern wheat breeders. Our findings shed light on these advances in cotton breeding, as well as the movements in slave, cotton, and land prices; the factors responsible for the growth of cotton output and the spread of cotton cultivation; the sources of the differences in regional production and productivity between the Old and New South; as well as the conventional static comparisons of plantation and non-plantation efficiency.
The article takes the following form. First, we explore the macro trends in the antebellum cotton economy. The data on cotton and slave prices, coupled with the observation that cotton output was growing at a faster pace than the labor force in the cotton-producing counties, suggest that labor productivity was rising between 1800 and 1860. These macro trends suggest a dynamic South. Contemporaries, and many historians, viewed the introduction and improvement of large-boll cottons from Mexico as a revolutionary innovation that rivaled the importance of Whitney's gin. We follow this lead by analyzing the creation and diffusion of Upland cotton varieties. Next, we introduce a new dataset drawn from the archival records of 142 plantations. These data show that the amount of Upland cotton the typical slave picked in a day increased approximately four times in the 60 years preceding the Civil War. We go on to explore a number of hypotheses for the increase in picking efficiency, concluding that improved cotton varieties likely accounted for most of the change. We further argue that our measured increase in picking efficiency captures only part of the impact of biological innovation on cotton production because the new varieties also offered higher yields and rendered higher quality fiber than earlier cottons. Finally we note that, due to increasing insect and disease problems, cotton yields and picking efficiency would have likely fallen in the absence of biological innovation.
NEGLECTED SIGNS OF RAPID PRODUCTIVITY GROWTH
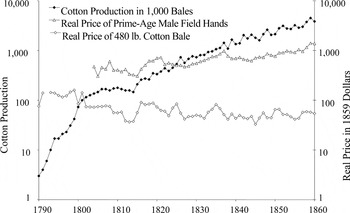
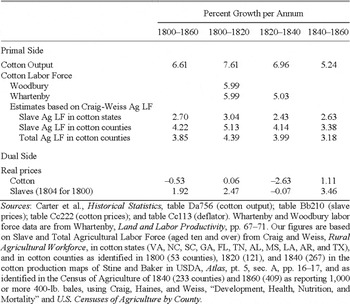
Figure 1 plots the long-run trends in cotton production (in logs) along with the real prices of both cotton and prime-age male slaves. The data depict a dynamic and expanding economy. From 1800 to 1860, the quantity of cotton produced increased by 6.6 percent per annum as the real price of cotton fell by 0.5 percent per annum. Over a slightly shorter period beginning in 1804, the U.S. slave population rose by 2.4 percent per year while the real price of prime-age male slaves rose by 1.9 percent per year. Obviously, not all slaves worked in cotton and not all cotton was produced by slaves (although by the 1850s, the overwhelming bulk of the crop was).Footnote 1 We can develop refined estimates of the cotton labor force by totaling the Lee A. Craig and Thomas Weiss numbers of agricultural workers (both slave and free) for only those counties producing cotton commercially.Footnote 2 As the growth rates for the number of slaves and for all workers in Table 1 indicate, cotton output expanded faster than the number of workers over the 1800–1860 period and for each of the subperiods, 1800–1820, 1820–1840, and 1840–1860. For the entire antebellum era, the gap between the growth rates of cotton output and the enslaved agricultural labor force in cotton counties averaged 2.4 percent per annum. Hints of rising labor productivity also appear on the dual side (cost function) of the production function. Slaves were a major input in the production of cotton, yet their real prices were soaring at a time when real cotton prices were declining.
COTTON PRODUCTION, AND SLAVE AND COTTON PRICES

PRIMAL-SIDE AND DUAL-SIDE INDICATORS OF COTTON PRODUCTIVITY GROWTH

Sources:
Carter et al., Historical Statistics, table Da756 (cotton output); table Bb210 (slave prices); table Cc222 (cotton prices); and table Cc113 (deflator). Whartenby and Woodbury labor force data are from Whartenby, Land and Labor Productivity, pp. 67–71. Our figures are based on Slave and Total Agricultural Labor Force (aged ten and over) from Craig and Weiss, Rural Agricultural Workforce, in cotton states (VA, NC, SC, GA, FL, TN, AL, MS, LA, AR, and TX), and in cotton counties as identified in 1800 (53 counties), 1820 (121), and 1840 (267) in the cotton production maps of Stine and Baker in USDA, Atlas, pt. 5, sec. A, pp. 16–17, and as identified in the Census of Agriculture of 1840 (233 counties) and 1860 (409) as reporting 1,000 or more 400-lb. bales, using Craig, Haines, and Weiss, “Development, Health, Nutrition, and Mortality” and U.S. Censuses of Agriculture by County.
In Time on the Cross, Robert Fogel and Stanley Engerman recognized that productivity was rising: “The basic cause of this long-term decline [in cotton prices] was the steady increase in productivity. Among the developments which made cotton farming increasingly more efficient were the improvements in the varieties of cottonseeds, the introduction of the cotton gin, the reduction in transportation and other marketing costs, and the reallocation of cotton production in the more fertile lands of the New South.”Footnote 3 This brief passage is the only acknowledgement we have found in the post–1970 cliometrics literature of the impact of new cotton varieties. In subsequent cliometrics exchanges, the quest to understand the sources and timing of productivity growth in the southern cotton economy, as well as its role in making the region the dominant world supplier, took a backseat to static questions such as the self-sufficiency of southern plantations, the distribution of wealth, and the relative efficiency of slave and free-labor farms. This emphasis was in part due to the heavy lifting done by William Parker, Robert Gallman, and their students in constructing the 1859 Census micro sample.Footnote 4
A handful of agricultural and economic historians have touched on the issue of long-run productivity growth. Noting the divergent movement of cotton and slave prices, Alfred H. Conrad and John R. Meyer hinted at the importance of productivity increases, which they attributed to the movement of cotton production to more fertile western lands.Footnote 5 Building on a long tradition of agricultural writers, John Hebron Moore argued that antebellum southern planters developed and adopted a succession of new cotton varieties that increased yields per acre, quality, disease resistance, and picking efficiency.Footnote 6 Drawing on a limited sample, Franklee Whartenby estimated that between 1800 and 1840 cotton yields per acre increased 46 to 78 percent and suggested that improved varieties allowed slaves to pick about three times as much cotton in a day. “With the advent of Petit Gulf cotton in the late 1820s, the daily picking averages jumped from about fifty or sixty to about 125 to 150, with as much as 300 or more sometimes reported.”Footnote 7 Stanley Lebergott also called attention to a change in picking rates. Relying on an assortment of retrospective secondary sources, he surmised that the amount of cotton harvested in a day increased from 50 pounds in 1800 to 200 pounds in the 1850s.Footnote 8 The cliometrics literature has all but ignored these claims of sustained productivity advances. There has been little appreciation of how the evolution of cotton varieties shaped southern development.
THE CREATION OF AMERICAN UPLAND COTTON VARIETIES
The dynamism of the cotton-producing sector bears directly on the very foundations of the Industrial Revolution.Footnote 9 The usual story focuses on the inventions of Richard Arkwright, Samuel Crompton, James Hargreaves, and John Kay, which mechanized spinning and weaving. Homage is also paid to Eli Whitney, whose saw gin helped ensure a supply of raw cotton to meet growing industrial demands.Footnote 10 However, this account neglects another set of innovators—the farmers and plant breeders who developed cotton varieties suited to the new spinning technologies and, as importantly, to the diverse North American environment.
According to Ware, the varieties that became the basis for the South's economic development were a local invention, a distinctive “Dixie product.” “Although the stocks of the species were brought from elsewhere, new types, through [a] series of adaptational changes, formed this distinctive group the final characteristics of which are a product of the Cotton Belt of the United States.”Footnote 11 The cottons that came to be cultivated in the United States belonged to one of two species. Sea Island (Gossypium barbadense) was grown primarily along the coasts and on the offshore islands of Georgia, South Carolina, and Florida. Cottons of the second and more important species (Gossypium hirsutum) were commonly referred to as Upland cottons because they were grown in the more variable climates away from the coast. None of these cottons were native to British North America.Footnote 12
In its native environment in Central America, Upland cotton was a frost-intolerant, perennial shrub with short-day photoperiod response. It flowered in the late summer and autumn. At the more northern latitudes of the American South, the conditions that triggered flowering occurred later in the year, and the first frost typically hit before the cotton could mature. Initial attempts to grow Upland cotton in the areas that now constitute the United States faced severe difficulties. Success depended on finding a mutation or cross, or introducing a variety with the appropriate photosensitivity characteristics.Footnote 13 Adaptation was assisted by the genetic heterozygosity of the initial imports, which made them relatively malleable. The varieties that eventually prevailed in the United States flowered in early to mid-summer and began to mature by the end of August or early September. The process of molding Upland cotton to the environment was repeated again and again. According to Ware, cotton-producing technologies were never static. “The vast differences in climate and soil that obtain over the Cotton Belt undoubtedly brought about a kind of natural selection, which eliminated many of the kinds that were tried, while others became adapted to the several conditions under which they were grown and selected over a period of years.”Footnote 14 These new American Upland cotton varieties proved “much more suitable, than any other kind, for general factory use.”Footnote 15
The most common Upland variety in the colonial period was Georgia Upland (aka Green Seed, Georgia Green Seed), which was introduced to North America in 1733/34. By later standards, Georgia Green Seed was a low quality, low yielding, low value, short staple variety that was hard to pick. Its seeds were “fuzzy,” meaning that the lint clung to the seed, making their separation difficult. Whitney's achievement was to develop a saw gin that could economically remove these seeds.Footnote 16 Upland cottons evolved as farmers acclimatized the standard Georgia Green Seed to different conditions. By the end of the eighteenth century an improved variety, Tennessee Green Seed, had been developed in the Cumberland Valley, and by 1801 seed for this variety was being grown in South Carolina and advertised for sale as far away as Savannah. It was lauded as being easier to pick and earlier to mature.Footnote 17
There were two parallel development paths, one focused on Sea Island varieties and the other on Creole Black Seed varieties. In the late eighteenth century (1786 is a commonly cited date), Georgia planters introduced high quality cottons from the Caribbean (or possibly from Brazil).Footnote 18 After considerable effort, some of these plants were acclimatized to become the Sea Island cottons. Sea Island types were low yielding and difficult to pick, but they produced a longer, finer fiber than Upland varieties, and their smooth black seeds could be removed easily with a roller gin—a machine widely available. Persistent attempts to extend the range of Sea Island by acclimatizing it to grow away from the coast met with little success.
As with Upland cottons, Sea Island cottons were genetically diverse and mutable. South Carolina planter Whitemarsh Seabrook noted in 1846 that decades of breeding had resulted in up to 15 subvarieties of Sea Island cotton.Footnote 19 Ware asserted that “more than one species and no doubt several varieties were brought in during the early period.… From these introductions the Sea Island growers doubtless developed their own distinct varieties and strains.”Footnote 20 Just as the early mechanical inventors whose genius stimulated the Industrial Revolution knew little of the laws of mechanics, “these early breeders knew little of genetics or the science of plant breeding, but they were artists in knowing their plants. They sought practical ends and concentrated on the development of the long silky types of cotton that the English spinners of the time demanded.… The result was the development of many special strains of the finest cotton the world has ever known.”Footnote 21
Historians usually depict crops and farm technologies as spreading from East to West, but French colonists in the Mississippi Valley actually began continuous commercial production of cotton before planters in the Carolinas and Georgia. During the early 1720s, French settlers experimented with Sea Island cottons with limited success in a narrow band along the Gulf. The repeated failure of Sea Island elsewhere led farmers to test other options. By 1733 a new variety had been imported from Siam. Dubbed Black Seed, or Creole, it soon became the dominant cotton in the region. In the early nineteenth century, lower Mississippi Valley planters considered Creole their “native” cotton. Like Sea Island, it had smooth seeds that could be extracted with a roller gin. Creole was far more reliable and outyielded Sea Island in this area, but produced lower quality fiber. As with Sea Island, Creole was difficult to pick due to its small bolls and because the lint clung to the pods. But Creole was superior in many respects to the Green Seed Upland cottons and commanded a higher price.Footnote 22 The Black Seed varieties first developed in the Gulf States moved eastward and mixed with local stocks of Black and Green Seed to create an array of varieties of differing quality and ripening characteristics. In the first two decades following Whitney's 1793 invention, southeastern planters experimented with myriad varieties to find suitable stock for their local conditions.Footnote 23
THE INTRODUCTION OF MEXICAN COTTON
The first in a long chain of events that would revolutionize southern cotton production occurred in 1806. While visiting Mexico City, Walter Burling obtained seeds of a high quality cotton which he passed on to his Natchez neighbor, William Dunbar, for experimentation. This “required some reselection for adaptation before satisfactory responses under Mississippi Valley conditions were obtained. Fresh seed from Mexico during the first year or two of planting was said to produce no more than one-half crop.”Footnote 24 By 1808 Dunbar sent samples of fiber to Liverpool to be tested for spinning quality and received a positive response.Footnote 25
By 1820 southern breeders had outcrossed Mexican highland cotton with Green Seed, Creole, and possibly even Sea Island varieties, creating many new genotypes.Footnote 26 Word of the new white-seeded cottons had already reached Baltimore by 1820 because an article in the American Farmer noted that the new “Mexican cotton” variety was “found to ripen, in a greater degree at one time: has a shorter season than any other cotton known among us, and is collected in much greater quantities, by a laborer, in one day. The cotton wool is represented to hang out of the pods of this species of the plants, and even to drop at times from them.”Footnote 27 In addition, contemporaries lauded the Mexican cotton for outyielding Creole and Green Seed and for producing a fiber superior to the latter. Perhaps most importantly, at least initially it was relatively resistant to a disease called “the rot,” which was causing large losses throughout the South.Footnote 28
On top of all of these qualities, Mexican cotton (and subsequent Mexican hybrids) had higher lint-to-seed ratios than the varieties they replaced. According to Lewis Cecil Gray, “the older varieties yielded lint weighing only 25 percent of the total weight of seed cotton.” This may have been an upper estimate. By contrast, many published accounts noted that the new varieties yielded closer to 33 percent lint.Footnote 29 This implies a more than 30 percent premium after ginning. Plantation records generally confirm the increase in lint yield, but suggest a more complicated story of continual improvement. Mississippi planter Francis Terry Leak chose seeds with an eye on lint ratios. His records showed a gradual upward trend in lint turnout well after the first introduction of Mexican varieties. Between 1841 and 1846, he averaged 26 percent lint and by 1853–1857 he obtained a 30 percent yield.Footnote 30 The Mexican cottons' many attributes led M. W. Phillips of Edwards, Mississippi to proclaim that the improved seed “can hardly be regarded as of less importance than the introduction of the gin stand.”Footnote 31
The early success of Mexican cotton stimulated others to seek fresh introductions. In 1827 Timothy Flint noted that in Louisiana, Mexican cotton was “getting into common adoption, and the importation of seed from Tampico and Vera Cruz is becoming a considerable business.”Footnote 32 This further increased the genetic material available to breeders. Cotton breeders had several competing objectives including higher yields; longer, finer, and stronger fibers; ease of picking; and resistance to pests. Early maturing cottons could be harvested before insects and diseases could multiply and destroy much of the crop, but such cottons generally had lower yields and fiber quality. The trick for breeders was to select crosses or mutations that combined the best qualities of different varieties. They did this by planting different varieties near to each other in experimental plots, by carefully selecting seed from plants that had desired qualities, and by isolating their premium cottons to prevent cross-pollination.
By the late 1820s, two new Mexican hybrids, Petit Gulf and Alvarado, gained acclaim. Petit Gulf was developed by Dr. Rush Nutt of Rodney, Mississippi. The Nutt family began as local suppliers of superior cottonseed, but by the 1830s acquired a regional and even international reputation.Footnote 33 Contemporary observers proclaimed that Petit Gulf was of higher quality than the first Mexican imports, its lint was less likely to fall to the ground if not picked promptly, and it ripened earlier. Petit Gulf widened the already considerable productivity gap separating the Mexican cottons from the Green Seed and Creole cottons.
THE DIFFUSION OF MEXICAN COTTONS
Plantation records as well as press accounts document the gradual spread of Mexican cottons throughout the Gulf region in the 1820s. In 1820 the American Farmer reported that Mexican cotton had recently been introduced to Louisiana and recommended that travelers to that state from other cotton growing regions “procure seeds and instructions for the culture of this … very important cotton.”Footnote 34 We know that by 1824, John Garnier of the Santa Rosa Sound, in the far western part of Florida, was growing a mix of varieties including Mexican seed.Footnote 35 The plantation records of James T. Magruder of Jefferson County, Mississippi first noted on 1 May 1824 that he was planting Mexican seed. In the same year, A. Penquite sought Mexican seed (as well as other types) from Rush Nutt. At the start of the 1825 planting season, the manager of John Quitman's Port Gibson, Mississippi plantation was “very desirous to procure some Mexican Cotton seed.” Planters often experimented with Mexican for a few seasons before committing to the new seed. David Rees of Saint Martin's Parish, Louisiana may have tested Mexican cotton as early as 1822, but the first explicit mention appeared in May 1826, when he had planted Mexican seed in several fields. Rees's main concern was to find a variety resistant to rot. Rees was also growing Tennessee Green Seed and Creole. In 1827 the American Farmer implied that Creole and Tennessee were still in use in Louisiana, but losing favor.Footnote 36 Clearly two decades after William Dunbar first received the Mexican seed, many planters in the lower Mississippi Valley were just beginning to adopt the new variety.
Previous accounts suggest that there was a lag of up to two decades between the spread of Mexican cottons (including hybrids such as Petit Gulf and Alvarado) in the West and their appearance in the Southeast. However, our examination of archival records reveals that many southeastern planters had begun experimenting with the new varieties by the 1820s. Ware reports that Mexican cotton first appeared in South Carolina in 1816 but offered no source, and we have not substantiated this early sighting. Archival accounts document that John Connors of Lancaster, South Carolina was growing Mexican cotton by 1825; Calvin Jones of Wake County, North Carolina and John Walker of King and Queen County, Virginia both reported the variety in 1827; as did Bryan Croom of Rocky Comfort, Florida by 1829.Footnote 37 We know that Mexican cotton was still a novelty in Alabama in 1826 because David Moore, whose plantation was near Huntsville, caused “unusual excitement” when on 28 and 29 August his 27 hands picked “the enormous quantity of 8921 pounds of seed cotton, being an average of 330 to the hand for two days.… It was Mexican cotton, which bears very large bolls, and was beautifully opened.”Footnote 38
Retrospective accounts indicate that many others were experimenting with Mexican cotton in the 1820s. As an example, James Davis of the Fairfield District, South Carolina noted that between 1825 and 1827 he “substituted what is called the Mexican cotton in the place of the Green Seed.” By 1835 he was unable “to find a single plant of the Green Seed kind growing the neighborhood” to test its performance against Petit Gulf, the then-dominant Mexican hybrid in his region.Footnote 39 Davis appears to have been totally committed to Mexican soon after his first experiments, but most planters continued to grow other varieties for years. There are several explanations for this coexistence. In some settings the Mexican cottons either were not overwhelmingly better or still needed to be acclimatized. Farmers may have been playing it safe. Growing different varieties could also help spread out the planting and harvest seasons. In addition, many farmers were unwilling to pay for large quantities of commercial seed, and it could take years to produce sufficient planting seed for an entire plantation.Footnote 40
The diffusion of the new Mexican hybrids outside the Mississippi Valley was also much earlier than many presumed. South Carolinians John Connors and William Richardson both planted Alvarado in 1829, as did John Lawton in 1833, and James Calhoun in 1834. In 1834 William Proctor Gould of Greene County, Alabama was planting Petit Gulf as well as Mexican. In addition, he gave a neighbor, Dr. Means, both types of seed. In 1836 Carolina planter Walter Peyre grew Alvarado, Petit Gulf, and both Green Seed and Black Seed varieties.Footnote 41 Others in the Southeast had already adopted Petit Gulf. For example, James Henry Hammond of South Carolina noted in 1833, “planted some Petit Gulf cotton and well pleased with it.” In 1834 he observed, “planted half my crop in Petit Gulf … Shale [sic] plant all Petit gulf hereafter.”Footnote 42
Several forces facilitated the diffusion of the new cotton varieties. The praise for the new seeds in agricultural journals and newspapers helped spread the word. In addition, a regional market in cotton seeds emerged. Here again the press played an important role by providing a medium for both sellers and buyers to advertise. As early as 1770, advertisements for cotton seed appeared in the Georgia Gazette of Savannah. In 1798 another Savannah paper noted that William Belcher was offering “Sea Island, White Nankeen, and the common Green Seed, of the upper country.”Footnote 43 By the spring of 1833, dealers were advertising Mexican seed in Alabama, and by 1835 there was an explosion of ads in the southeastern press for “Alverado” and Petit Gulf.Footnote 44
In the vernacular of the day, the older varieties tended to “run down.” This could be for a number of reasons. For example, what passed for Petit Gulf might have been accidently crossed with inferior cottons or it could have become more susceptible to diseases. Although advertisements found in southern farm journals and plantation records show Petit Gulf remained popular throughout the antebellum era, a large number of new varieties came on the market in the 1840s and 1850s. Some represented improvements for specific locales, others were disappointments.Footnote 45 Among the most popular was One Hundred Seed, which was bred and distributed by Col. Henry W. Vick of Vicksburg, Mississippi in the mid-1840s.Footnote 46 In 1839 Vick began the annual process of having his most able slaves make special pickings in which they harvested only the finest bolls from the largest and most prolific plants. This cotton was ginned separately and then grown in isolated fields. Vick often ventured into the fields himself in search of valuable mutations and crosses. He personally selected the progenitor of the One Hundred Seed cultivar in 1843 from the particularly appealing bolls of a single plant he discovered while visiting another plantation in the Delta.Footnote 47 He then increased this seed for a few years before marketing it. Most planters typically bought small quantities of commercial seed, which they then tested and increased themselves. They had to be very careful to maintain seed quality given the potential for cross-pollination in the fields and seed mixing at the gin. Specialized seed producers such as Vick were particularly diligent to separate their test fields and to clean their gins between runs.Footnote 48
Other important varieties produced by antebellum Mississippi Valley breeders were Sugar Loaf (1843), Mastodon (before 1846), Boyd's Prolific (before 1847), and Banana (before 1848). Sugar Loaf was first in the line of cluster types (that is, the plant tended to have multiple bolls at each node on its short fruiting limbs, making the bolls cluster together). Boyd's Prolific was the pioneer variety in the semi-cluster line (which possessed the clustering habit in a less pronounced form). Varieties such as Mastodon were highly popular in certain regions, but were considered “humbugs” in others.Footnote 49
In 1868 Joseph Lyman reflected on the dynamics of the seed industry: “Beginning with the year 1820, and from that time forward, various planters in different parts of the cotton growing states have devoted themselves to the development and sale of improved varieties of cotton seed, and certain styles of cotton have for two, three, or four years, enjoyed a great, though ephemeral popularity, and, then, as suddenly, been pushed aside for a new reigning favorite. The improvement of a cotton seed as a business, and sale of the improved varieties, has enabled quite a number of prominent and enterprising planters throughout the South to realize handsome fortunes.”Footnote 50 Cotton improvement was not the monopoly of a few well-known breeders. Our reading of plantation diaries suggests that most planters large and small typically grew more than one variety in a given year, carefully observing the many pros and cons of each. Planters such as John Carmichael Jenkins, Francis Leak, and Charles Whitmore regularly grew three or more varieties and were testing others in garden plots.Footnote 51 Antebellum observers were impressed and at times astounded at the high prices the new seeds brought in the market. Ordinary cotton seed might sell for 25 cents per bushel (when used for manure) and was often simply discarded. By contrast, Petit Gulf seed regularly fetched twice as much. Seeds of choice varieties such as Sugar Loaf, Brown, Hundred Seed, Banana, Multibolus, and Prolific, “under ordinary circumstances, command from one to three dollars per bushel.” When first introduced, Mastodon seed netted five dollars a bushel, Banana “at first sold for a hundred dollars a bushel [and] some paid ten cents apiece [again roughly $100 per bushel] for ‘Hogan’ seeds.”Footnote 52
New varieties gained considerable attention in the southern and even the northern press. As an example, in 1854 Harper's Magazine reported that “whenever, by good fortune, a higher-yielding cotton plant appears ‘instantly … the local newspapers teem with advertisements and commission houses are filled with the magic seed [for marketing].’”Footnote 53 Improved cottons of both the Sea Island (from Seabrook) and Upland (Petit Gulf and Extra Prolific) varieties were included in the Great Exhibition when it opened in New York in 1853. The writer for the Times observed that “although the Crystal Palace contains many articles which make more show, and will attract more attention, it has none which have exercised a greater influence upon the civilization of world,” than these cottons.Footnote 54
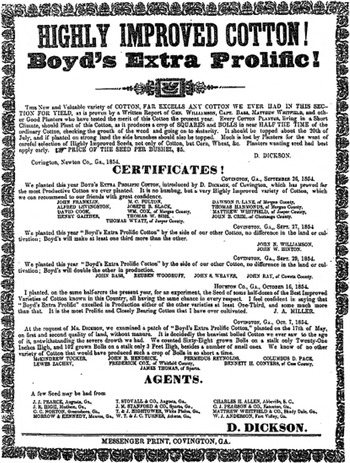
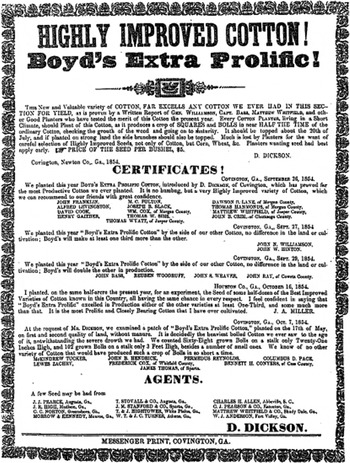
In the late antebellum period, some of the seed producers who had started as planters, such as Martin W. Philips, conducted ambitious privately funded agricultural experiments and disseminated their findings and latest creations for free. In time, Philips was “drawn into a profitable seed business selling name brands from his Mississippi plantation.”Footnote 55 Other seedsmen, such as David Dickson of Hancock County, Georgia were commercial operators from the beginning. Much like those of northern manufacturers of agricultural machinery, Dickson's advertisements in the 1850s (such as Figure 2) featured testimonials from satisfied local customers.Footnote 56 The new seeds were not protected by patents, yet the innovations continued to flow. The speed of innovation appears to have been more rapid in the Upland cotton sector, where an ethos of greater openness prevailed, than in the Sea Island sector, where planters closely guarded their improved seeds and cultural practices as trade secrets.
THE PICKING REVOLUTION
Advances in the efficiency of cotton picking are of special interest. On most cotton plantations, picking represented the largest single use of labor. During the year, slaves on cotton plantations worked on many tasks, but the non-cotton activities were chiefly inputs into the production of the cotton cash crop. Jobs such as raising corn and peas, tending animals, and clearing new land were, when possible, scheduled to fill down times in the yearlong cotton cycle. Although the cotton cycle varied with location and weather, in general, preparing the land by clearing dead stalks started in January, plowing and working to control weeds began soon thereafter, and planting and chopping accelerated the work pace beginning in April. Depending on latitude and other factors, the picking season stretched from late August into December and in some seasons even later. The rate of picking tended to peak in October and early November, when more cotton was open. Picking required dexterity and diligence. It involved stoop labor to gather the low-lying bolls and repetitive motions of the hand amidst the plant's thorny burrs. But it did not require great physical strength, which contributed to the high rate of participation of the slave population, including children and the elderly, during the picking season.
DAVID DICKSON'S 1854 SEED ADVERTISEMENT
Picking was the key binding constraint on cotton production. Capturing a sentiment often noted in antebellum accounts, Gallman asserted that “a field hand could raise very much more cotton than he could pick” and the plantation's “capacity to pick … governed the volume of land put to cotton.”Footnote 57 However, most estimates of labor requirements fail to appreciate that this constraint was not fixed over time. As a rough approximation, in the early period, an individual slave could pick only one-half of the acreage of cotton that he or she could plant and cultivate. With improvements in picking rates, this ratio increased, allowing planters to expand cotton acreage and more evenly employ labor in higher value tasks.Footnote 58
One sign of the importance of the harvest operations is that many slave masters kept extensive logs detailing the daily picking output of individual slaves. Absentee owners often required their overseers to keep such records so that the owners could better assess day-to-day farm activities, but many resident owners also caught the record-keeping bug.Footnote 59 The data allowed for comparisons with past years, and helped set expectations for tasking the pickers. These records were precursors to the time-in-motion studies initiated by Frederick Taylor and the “Scientific Management” movement in the early twentieth century.Footnote 60
Failing to meet picking standards had severe consequences. In 1834 S. A. Townes of Marion, Alabama threatened to “make those bitches go at least 100 [pounds] or whip them like the devil.”Footnote 61 In the 1830s Dr. J. W. Monett of Mississippi asserted that after weighing an individual's daily picking, masters would whip slaves for light or trashy picking.Footnote 62 On several occasions, Louisiana planter Bennet Barrow ordered a whipping for all hands because the output was too low. As yet another example, John Edwin Fripp of South Carolina recorded “popping” and “switching” his slaves for light picking. On the Mississippi plantation of John Quitman and Henry Turner, a number of slaves ran away rather than face punishment for light or trashy picking.Footnote 63
A NEW COTTON-PICKING DATASET
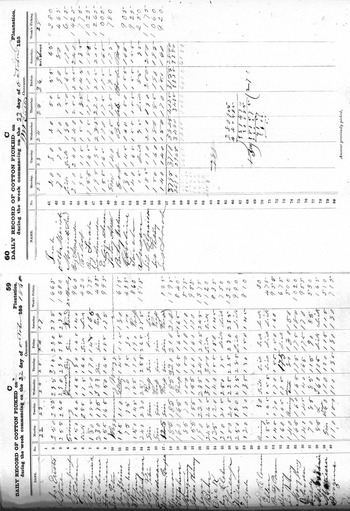
Plantation managers recorded picking data in various documents including plantation journals, diaries, cotton books, ledgers, letters, and the like. Over time recordkeeping became more formalized with many planters employing bound account books with printed templates designed especially for this purpose. Such preprinted records, which appeared by the 1810s, undermine any romantic notion of a sleepy plantation system run by pre-capitalist masters. The most popular cotton account book was produced by Thomas Affleck, a noted nurseryman, experimenter, and farm journalist. The first edition of the Affleck Plantation Journal and Account Book appeared in 1847. Within a few years, he offered three different volumes—one for small plantations with up to 40 slaves, one for mid-size plantations with 80 hands or less, and one for plantations with up to 120 hands.Footnote 64 In addition to the pages efficiently laid out for recording picking, the Affleck (and competing) books provided forms for listing the slaves' names, ages, and values, births and deaths, stock and equipment inventories, the weight of individual cotton bales, and other valuable information. The volumes also contained space for a diary. The daily entries (and marginal notes found with the picking records) often give a detailed sense of the pulse of plantation life, including information on work assignments, plant varieties, crop damage due to insect and disease infestations and bad weather, owner-overseer relations, cotton sales and quality, days lost to rain, and whether the slaves worked a full or half day, whether the slaves worked on Saturdays and Sundays, and the like. Of course the overseers and owners differed significantly in their attention to detail, but in many instances we were able to supplement the information found in the picking records with commentary extracted from diaries, letters, and other types of farm journals. Figure 3 shows an example of two unusually legible and reasonably complete pages from an Affleck book. These two pages capture the activities for the week of 22 October 1860 on the Eustatia Plantation in Mississippi detailing the picking output of 54 slaves with about 260 individual picking entries.Footnote 65
Our dataset captures 704,800 individual picking entries from 142 separate plantations over a total of 509 plantation crop-years spanning the period from 1801 to 1862 (474 of the crop years are from Upland cotton operations and 35 are from Sea Island operations).Footnote 66 The quantity and quality of the data differ greatly from plantation to plantation. For 52 plantations we have data for just one, or only part of one, picking season. At the other extreme, we have data for 22 years for the Leak Plantation located in Tippah (now Benton) County, Mississippi. The Leak Plantation has the most entries for a single plantation at 79,602. To expand coverage for our investigation of changes in picking rates, we also mined plantation records containing aggregate daily picking totals and the numbers of pickers. There are 40 plantation years in our sample for which we have only aggregate data.Footnote 67
SAMPLE FROM 1861 EUSTATIA COTTON BOOK

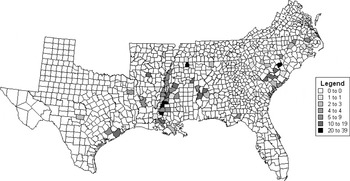
We scoured public archives and private collections across the United States for plantation records. The resulting sample is not distributed uniformly with cotton production over space or time. Figure 4 displays the geographical distribution of our sample. The Old South region accounts for 103 of our 474 Upland plantation-year observations, with coverage extending from 1801 to 1862. The New South makes up 371 Upland observations, beginning in 1805.Footnote 68 Mississippi with 200 crop- year observations and Louisiana with 72 are especially well represented, and coverage for this region extends back to 1805. In general, the data become more abundant over time. Over all states, we have data for 31 plantation years before 1820; 24 for the decade of the 1820s; 47 for the 1830s; 122 for the 1840s; 214 for the 1850s; and 71 for the early 1860s.
CHANGES IN PICKING EFFICIENCY
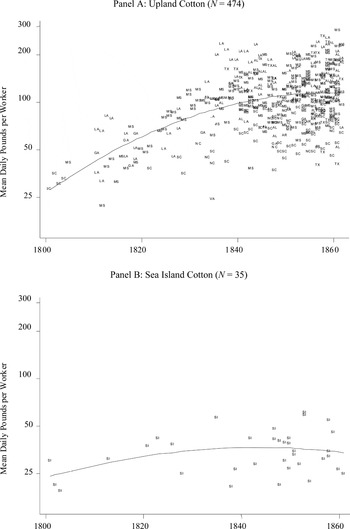
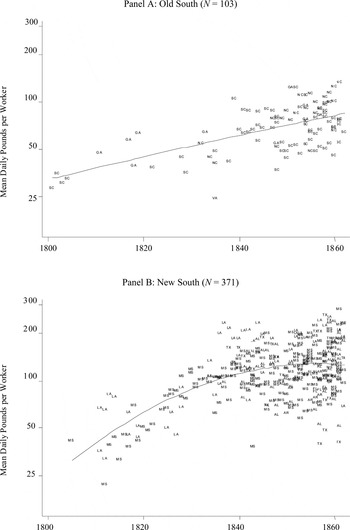
Figure 5 documents the changes in daily picking rates on cotton plantations between 1801 and 1862. Panel A displays mean daily picking rates on a log scale for Upland cotton operations; Panel B does the same for Sea Island cotton operations. Each data point represents the mean amount of cotton picked per day for a plantation crop-year. Thus a plantation with 300 entries covering only part of the picking season has equal weight as a plantation with 5,000 entries spread across the entire season. The labels on the observations indicate their locations by state (MS=Mississippi, LA=Louisiana, and so on) or their type (SI=Sea Island).
GEOGRAPHIC DISTRIBUTION OF PLANTATION-YEAR OBSERVATIONS

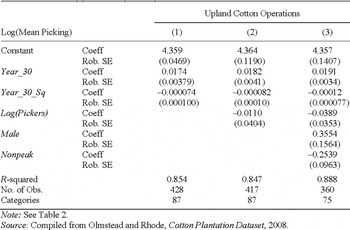
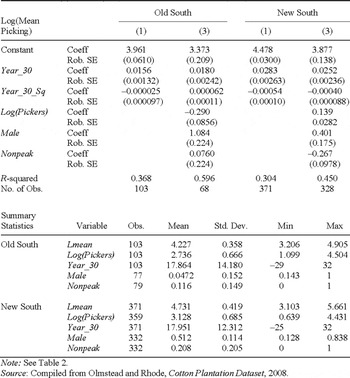
Table 2 reports regressions of the log of the mean picking rates on the linear and quadratic time trends.Footnote 69 The results are displayed in Figure 5 as the solid trend line. By these estimates, the mean pounds picked increased over 2.3 percent per annum, rising from 28.1 pounds in 1801 to 114.2 pounds in 1862. This represented an increase of 4.1 times. Our sample provides a better sense of the timing of the transition, with the quadratic term indicating that the rise in picking rates was slowing down by the 1850s. In the additional regressions, we also control for size of the picking labor force, gender composition, seasonality of activity, and region, Old vs. New South.Footnote 70 Including these controls reduces the size of the sample by 78 observations. Evaluating specification (3) for Upland cotton operations, at the sample means of these controls, indicates that adjusted picking rates more than tripled (3.19 times) between 1801 and 1862, growing at a rate of 1.90 percent per annum. Note that this calculation does not allow for regional shifts in production. The coefficient on New South location in specification (3) indicates picking rates per day were almost 57 percent (that is, exp[0.451]) higher in the New South than in the Old South.
MEAN DAILY PICKING RATES BY PLANTATIONS, 1801–1862

DECIPHERING DAILY PICKING RATES, 1801–1862

Notes:
Year_30 = Crop-Year1830; Year_30_Sq = (Year_30)2; Log(Pickers) = log of average number of pickers per day; Male = percentage of picking observations for males; Nonpeak = percentage of picking observations in months other than September, October, and November; New South = 1 if plantation is in Alabama, Arkansas, Florida, Louisiana, Mississippi, Tennessee, or Texas, otherwise New South = 0. Standard errors are robust.
Source:
Compiled from Olmstead and Rhode, Cotton Plantation Dataset, 2008.
The picking rates display increasing variation over time. The standard errors reported in Table 2 use the White robustness correction and the picking rates have been transformed into logs (percentage terms). But rather than viewing the heterogeneity as merely a statistical problem, we believe that the high and increasing variance in mean picking rates is an important phenomenon calling for further investigation and interpretation. Focusing on the 1850s and early 1860s, the coefficient of variation (the ratio of the standard deviation to the overall mean) of the average picking rates on Upland operations was 0.404. Thus, on late antebellum-era plantations, there was a one-standard-deviation spread of roughly 40 percent in the average productivity per worker performing the key task in the production of a relatively standardized commodity trading in world markets. Yet as wide as the variation was in the 1850s and early 1860s, all but 1 or 2 percent of the operations in that period had higher picking rates than the median operation in the period before 1820; indeed, the breakpoint for the bottom 25 percent in the later period was above the highest operation in the earlier period.
WHY DID PICKING RATES INCREASE?
To explain the increase in picking rates, we explore four hypotheses. First, we ask if the increase in economies of scale associated with the more efficient use of the gang system accounted for the upswing in picking efficiency. We then look at a related issue by asking if planters learned to be more efficient managers. Although both of these hypotheses play a prominent role in the cliometrics story of cross-sectional efficiency differences, neither attracted much contemporary notice and neither appears to explain much of the increase in picking efficiency in our sample. We next explore the impact of the movement of cotton production onto superior western lands. We follow this discussion with an analysis of the biological revolution in cotton varieties and the breeding activities that reshaped the antebellum economy.
Scale and Gangs
Fogel and Engerman have argued that slave plantations had a significant efficiency advantage because of their ability to exploit the “gang system.” According to this view, the gang system was an innovation akin to the moving assembly line of the early twentieth century. Slaves “who toiled in the gangs of the intermediate and large plantations were on average over 70 percent more productive than either free farmers [northern and southern] or slaves on small plantations.” Fogel asserts that under the gang system slaves worked more intensely, but for fewer hours than free workers. The “greater intensity of labor per hour, rather than more hours of labor per day or more days of labor per year, is the reason the index of total factor productivity is 39 percent higher for the gang-system plantations than for free farms.”Footnote 71
One might expect that such significant productivity-enhancing innovation would have been widely discussed at the time—certainly Henry Ford's assembly line did not go unnoticed.Footnote 72 In fact, the use of the term gang was rare in discussions of picking operations in the hundreds of cotton books and plantation journals that we reviewed, usually occurring with reference to a trash, house, or children's gang performing some unusual activity. More generally, we have seen almost no slave era testimony extolling the productivity advantages of the gang system (under any name) in any cotton production activity. Nevertheless, was the gang system somehow responsible for the growth in picking efficiency? This is very unlikely because by all accounts, including those of Fogel and Engerman, cotton picking was not a gang activity. Picking was evaluated on an individual basis, conceivably because of the widely different skill levels of the pickers and the ability to easily monitor and measure output.Footnote 73 But perhaps larger crews were more efficient picking forces.
To test for the effects of scale economies, we introduce controls in specifications (2) and (3) of Table 2 for plantation size as measured by the average number of pickers working per day. Plantations with larger picking crews tended to have higher rates of picking per person (which is consistent with economies of scale, positive correlations between size and managerial efficiency, and other explanations).Footnote 74 The measured effect of (the log of the) size of the average number of pickers, as shown in specification (2), for the Upland cotton operations appears quite large at 0.196. This would imply that doubling the size of the crew would lead to a roughly 20 percent increase in daily output per picker. Controlling for crew size reduces somewhat the estimated time effects, with the adjusted daily picking rates increasing by 1.92 percent per annum.Footnote 75 But including controls for seasonality, gender, and location as shown in specification (3) of Table 2, for the Upland cotton operations measurably reduces the picking crew-size coefficient.Footnote 76
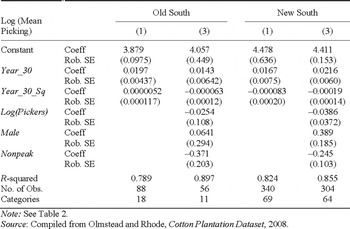
Gavin Wright and others have long argued that a plantation's size was correlated with its management structure, location (climate and soil type), and other productivity-related attributes, which makes disentangling the separate effects using cross-sectional data difficult. Our panel data allow us to address this issue. Table 3 presents results on the determinants of daily picking rates controlling for plantation fixed effects. (This requires dropping 46 Upland cotton operations for which only one year of data is available.) Adding these controls eliminates the crew-size effect.Footnote 77 It also diminishes the coefficient on gender, suggesting that the percentage of pickers who were male was correlated with other unmeasured productivity-related attributes of the plantations. The time effects remain strong, consistent with a 1.87 percent increase per year in picking rates, even while holding location constant. Consistent with Wright's hypothesis, plantation characteristics such as location and soil quality clearly had a strong effect on picking productivity.
More Efficient Exploiters
To control for the possibility that picking rates increased because slave owners learned over time to exploit larger picking crews more efficiently, we also included a term interacting the year and log of the picking crew size. Its coefficient had a statistically insignificant effect (at the 10 percent level) and its inclusion provided no additional explanatory power. If planters were becoming better managers (or just more callous and more demanding, i.e., better slave drivers) this increased “skill” should have allowed them to utilize their slaves more effectively in other activities besides picking Upland cotton. We can test this managerial hypothesis by looking at a closely related activity—the production of Sea Island cotton. As Panel B of Figure 5 indicates and the year variables of specifications (1) and (3) for Sea Island operations in Table 2 show, picking rates for this type of cotton changed little over the antebellum period. This is precisely what one would expect from reading contemporary accounts. While there was considerable testimony proclaiming the wonders of new Upland varieties, there was no parallel trumpeting of the productivity virtues of new Sea Island varieties. Our conclusion at this juncture is that managerial innovations (our first two hypotheses) unlikely accounted for much of the increase in picking efficiency.
FIXED EFFECTS MODEL OF DAILY PICKING RATES FOR PLANTATIONS WITH OBSERVATIONS IN MULTIPLE YEARS

The Shift in Output to Better Lands
The territorial expansion of the cotton-slave frontier was one of the most controversial issues of the antebellum era, with claims and counterclaims regarding the importance of new lands in preserving the political and economic power of the slave South. Much of this literature lies at the foundation of the early debates over the profitability of the slave system.Footnote 78 For all the discussion of the political and economic implications of the spread of slavery, there has been no precise measure of the actual spread of cotton culture and little understanding of how technological forces help explain the expansion of the cotton South.
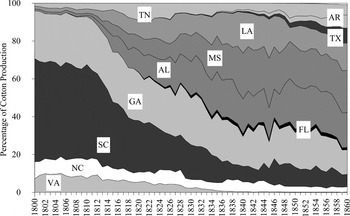
We offer a fresh perspective on the geographical movement of cotton production. In the early 1790s, U.S. production was concentrated along the coasts of Georgia and South Carolina. By 1839 the geographic center (median) of the production of Upland cotton was near Greensboro in west central Alabama, and by 1859 the center was just west of the Mississippi-Alabama border. To provide perspective, it was not until the 1880s that the median geographic center of wheat production shifted west of this longitude. The speed of cotton's westward movement before the Civil War is all the more impressive when one realizes that over the entire period from 1860 to 1920, the geographic center of cotton production remained within the boundaries of the state of Mississippi.Footnote 79Figure 6, which plots annual state-level commercial cotton production between 1800 and 1860, offers another perspective on the enormous regional shift in production.Footnote 80 The movement away from the Old South began in earnest in the early 1810s. By 1833 its share had fallen from over 95 percent of total output to less than one-half and by 1859 to less than one-quarter. In fact, the westward shift was even more pronounced than the aggregate state-level data reveal because Georgia's production shifted markedly to the interior.
The effects of the westward shift in production and the increase in picking rates were closely intertwined. Table 4 and Figure 7 address this issue by decomposing our picking sample into the Old and New South. Focusing on specification (1) in Table 4 and on the period when data exist for both regions, we observe that estimated picking rates in the Old South increased from 38.7 pounds per day in 1811 to 84.4 pounds by 1862. This represented an increase of 1.52 percent per annum. Estimated picking rates in the New South in 1811 were 42.3 pounds per day, about 9 percent higher than in the Old South at that year (and likely within error bounds of the estimate). But picking rates grew much more rapidly in the New South, reaching an estimated 125.4 pounds in 1862. This was 49 percent higher than in the Old South the same year. It was three times higher—consistent with a growth rate of 2.13 percent per annum—than in the New South in 1811. Note that growth in the Old South was roughly linear in time (the quadratic coefficient is small), whereas growth in the New South was rapid in the 1820s and 1830s and then slowed. As a result, the gap between picking rates in 1840 was huge—the average picker of the New South gathered 110.7 pounds per day, whereas his or her counterpart in the Old South collected only 61.3 pounds. (This calculation does not control for picker characteristics.)
REGIONAL DISTRIBUTION OF U.S. COTTON PRODUCTION, 1800–1860

Table 5 reports the results controlling for plantation fixed effects for the Old and New South samples. The regional differences in the growth rates become smaller with these controls. The reported levels, reflecting differences in both observable and unobservable variables, remain significantly higher for the New South plantations than for the Old South plantations.
The dynamics of southern development were a function of the interaction of biological innovations and western movement. The existing view emphasizes that the West enjoyed a productivity advantage because the land in its vast alluvial basins was inherently better than the land common in the East. Moreover, the virgin land in the West had not yet been mined of its nutrients as had purportedly occurred in the East. However, these long-standing explanations of East-West productivity differences tell only part of the story because the rapid westward movement in cotton production in the years before 1833 occurred precisely when western cotton producers enjoyed their greatest varietal advantage over eastern producers. Most of the new cotton varieties were invented in the West, and they were undoubtedly best suited for the area where they first evolved thereby enhancing the West's comparative advantage. The new varieties gradually were adapted to displace older varieties in a wide spectrum of geoclimatic conditions, but the new technologies were particularly suited for more fertile lands. The large plantation regions of the West had better soils to start with, but in a sense biological innovation made these soils even better. The rapid increase in picking rates before 1840, followed by the leveling off displayed in Panel B of Figure 7, probably reflects the earlier and more rapid diffusion of new varieties in the West.
UPLAND PICKING RATES IN OLD AND NEW SOUTH

GEOGRAPHIC BREAKDOWN OF UPLAND COTTON-PICKING RATES

FIXED EFFECT MODELS FOR OLD AND NEW SOUTH UPLAND OPERATIONS WITH OBSERVATIONS IN MULTIPLE YEARS

Biological Innovation
We have explored the importance of biological innovation at several points earlier in this article. We can gain further insight into the impact of varieties by examining changes in picking efficiency on the same plantation over time, thus controlling partially for geoclimatic conditions. To qualify for this experiment, a plantation had to have records for the years before and after the probable introduction of Mexican cotton. The Locust Grove Plantation located in Jefferson County, Mississippi and the Oakland Plantation located in West Feliciana Parish, Louisiana both met this test.
The managers of the Locust Grove Plantation kept picking records for 19 consecutive years beginning in 1825.Footnote 81 (The surviving records do not indicate the types of cotton grown.) For the first five years of this period, the mean picking rates averaged 84.6 pounds a day. It is likely that Mexican cotton was introduced in these early years. Over the last five years, the mean averaged 119.6 pounds. This implies an annual growth rate of about 2.5 percent. The records of Nathaniel Evans (and family) are particularly valuable because they begin well before the widespread introduction of Mexican cotton. In the years 1811–1817, Evans planted Creole Black Seed. The individual picking records for this period (1811–1813 and 1817) show unweighted mean picking rates of 68.5, 66.6, 83.6, and 64.3 pounds—a four-year mean of 70.8 pounds.Footnote 82 Nathaniel Evans died in 1819, and the management of his Oakland Plantation passed to his wife, Sarah and son, John N. Evans. For the 1819 season, the plantation diary enumerates the number of slaves picking and the total amount of cotton picked for 50 days (1,542 slave work days) starting 1 January 1820 and ending 7 April 1820. This was a very late picking season and the mean daily picking rate for this period was only 43.6 pounds per worker.Footnote 83
We can connect the early pre-Mexican picking rates with cotton- picking data for 1839–1840 and 1866. For a total of ten days in September 1839 and November 1840, John N. Evans recorded the number of slaves picking and the total quantity of cotton harvested. The daily mean per slave for this period was 146.7 pounds.Footnote 84 For 1866 we again have individual picking data, albeit only a fragment, consisting of the names and quantity picked by 20 free laborers on 18 and 19 October. For these two days, the mean picking rate was 157.3 pounds, or over two times that recorded in the pre-Mexican era. Because picking rates varied significantly over the season and October would typically be a peak period, it is important to fine-tune our comparison. In the 1811 to 1817 period the mean picking rate during October was 74 pounds. In 1866, 12 of the 40 observations exceeded 200 pounds and one exceeded 300 pounds. By comparison, in October of the four years for which we have data in the 1810s, only two out of the 1,695 observations exceeded 200 pounds. These comparisons probably understate the differences in picking rates that would have been evident if we could have compared the 1810s data with data for the late 1850s, because picking rates in the later stages of the Civil War and in the immediate postwar years fell significantly on plantations for which we have data.Footnote 85 Overall, the evidence drawn from the Oakland Plantation is consistent with the general trends shown in Figures 5 and 7.Footnote 86
As noted earlier we found little contemporary testimony extolling the productivity virtues of the gang system. By contrast, a wealth of statements exist attributing the increase in picking efficiency to the change in cotton varieties. As an example, in 1852 De Bow's Review reproduced a week of picking data from the 1817 cotton book of G. W. Lovelace of Sicily Island, Louisiana. Over a six-day period, his slaves averaged 46 pounds a day of hard-to-pick Tennessee Green Seed cotton, and the most anyone picked in a day was 78 pounds. The article noted that Lovelace “was a good thrifty planter in his time, and had some choice Negroes,” but that by 1852, comparable quality hands could pick as much in a day as Lovelace's pickers could pick in a week because of the change in cotton varieties.Footnote 87
MEASURED PERFORMANCE IN A DETERIORATING ENVIRONMENT
Our estimates of the actual increase in cotton-picking rates only partially capture the full effects of biological innovations because they do not account for negative shocks borne by producers. The economic history of cotton is often written as if the boll weevil, which first appeared in 1892, was the crop's only serious pest. However, plantation accounts, the nineteenth-century southern press, and entomologists' reports clearly show that antebellum planters paid keen attention to the insects and diseases that preyed upon their cotton. Without the infusion of new varieties, yields and picking rates would have declined significantly in response to the increase in disease, insect, and weed problems. The most menacing disease was cotton rot and the most destructive insects were the boll worm and the cotton worm (known also in the antebellum era as the caterpillar, the army worm, and le chenille). The damage caused by these two insects increased significantly in the period after 1840. In addition, the introduction from foreign lands and subsequent spread of a number of weeds led to a deteriorating environment. As an example, Johnsongrass, which became a problem in the 1840s, significantly increased the problem of weed control and even with increased diligence sapped cotton yields and picking efficiency.Footnote 88
A disease called “the rot” takes center stage in our discussion because it played a major role in the early transition in varieties. As noted earlier, historians of Mississippi Valley agriculture, where the rot was first mentioned, relate how it wiped out the early Creole Black Seed cotton popular in the region. According to this story, around 1810 to 1815 planters turned to Tennessee Green Seed in desperation, but soon it too became susceptible to rot. Planters then turned to Mexican cotton, which gained acceptance in the 1820s in the Mississippi Valley and which by many accounts was initially totally immune to the disease.Footnote 89 Many of these reports of rot relied on statements made in agricultural journals, in which observers reflected on events decades after the fact. Such retrospective accounts must be taken with some skepticism given the blurring effect of time on memories. Contemporary newspapers and plantation records offer a more exact sense of the disease's impact.
The first mention of the disease that we located was in a letter from Natchez, Mississippi Territory published in the Alexandria Gazette on 12 October 1812. “The cotton crops will be late and short, on account of the wetness of the season causing the early balls to rot off.”Footnote 90 Our search of contemporary newspapers housed in the Mississippi Department of Archives and History found rot first referenced in March 1814 when the commission merchant, John Henderson, advertised that he had “just received a quantity of Tennessee Cotton Seed. A change of seed is said to secure the crop against the rot. Planters wishing to make the experiment will do well to apply soon.”Footnote 91 This account suggests that the change to Tennessee Seed was still in the experimental stages several years after some historians have declared that the transition was complete. In the autumn of 1814, letters from New Orleans reported that “rot is destroying the cotton dreadfully.”Footnote 92 In 1815 and 1816 newspaper accounts continued to describe an “alarming” situation in the lower Mississippi Valley with loss rates around 50 percent of the crop.Footnote 93 By 1817 the disease was hitting cotton in Georgia, Alabama Territory, South Carolina, and possibly other areas. One account reported rot in Alabama Territory in 1817/18, with one-half of the crop destroyed.Footnote 94 In 1819 there was severe damage across a wide range of South Carolina. The switch to Green Seed cottons as a defensive measure clearly continued in some regions into the 1820s. In 1819 James H. Dearing ran an advertisement aimed at Alabama planters offering 2,000 bushels of Green Cotton Seed. The seller implied that the seed was free of rot.Footnote 95 In that same year, Georgia planter and former U.S. Senator, George W. Troup, described the disease's devastation with crop losses ranging from 25 to 75 percent. Not limiting the search for a cure to Green Seed cotton, Troup appealed for an enterprising merchant to import seeds from the “Brazils” in the hope that they would prove rot resistant.Footnote 96 In the meantime, dire reports continued from Mississippi and Louisiana.
Plantation diaries reinforce the impression that the rot arrived in parts of the Mississippi Valley well after 1810 and that the transitions away from Black Seed to Green Seed varieties, and subsequently to Mexican varieties, were drawn out processes that took place only after considerable experimentation—with farmers often testing all three varieties simultaneously. The disease hit Nathanial Evans' Louisiana plantation hard in 1813. In August he noted that “the Bolls continue to rot and the forms fall off.” John Palfrey of Attakapas, Louisiana reported in October 1815 that the disease was causing financial embarrassment, and in October 1817 John Bisland of the Natchez area lamented that he expected to “lose one-half of the cotton by the rot.”Footnote 97 Louisiana planter David Rees was fighting the disease into the latter part of the 1820s, experimenting with Black Seed, Green Seed, and Mexican cottons. Rees was clearly growing all three varieties at one time and his account suggests that his Black Seed cottons often did better than his Green Seed. The statements of other contemporaries contradict the standard story that Green Seed cottons were universally more rot resistant than Black Seed. Alexander Lawton of Beauford, South Carolina lamented in 1817 that “we were visited by the black rot also, which destroyed from one-fourth to one-half of the planters' crops of Green Seed cotton, it did not affect Black Seed cotton.” John Connors of Lancaster, South Carolina also reported that the disease did more damage to his Green Seed than to his Black Seed cotton.Footnote 98 Other plantation documents confirm that the disease caused terrible damage into the mid-1820s in South Carolina. The decline in the frequency of reports of the disease corresponded with the introduction of Mexican cottons, and there was a strong causal connection in the minds of many planters. However, early accounts of Mexican cottons also sustaining damage undermine the frequent claims that the new cottons were totally resistant. Nevertheless, there is little doubt that the transition to Mexican cottons helped ward off losses due to diseases and insects, both due to direct genetic resistance to disease and to the cotton's relatively early ripening characteristics. In the 1840s and 1850s, both disease and insect problems increased significantly with the reappearance of rot and the aforementioned attacks by the boll worm and cotton worm. These problems further propelled the search for resistant varieties. The upshot is that the measured efficiency improvements that we report in this article understate the productivity impacts of biological innovation in the antebellum years.
CONCLUSION
Technological changes revolutionized southern cotton production in the 60 years preceding the Civil War. The amount of cotton a typical slave picked per day increased about 2.3 percent per year due, primarily, to the introduction and perfection of superior cotton varieties. The increase in picking efficiency correlated with yield and quality improvements, which further increased the incentives to grow cotton. These technological changes help make sense of the long-run movements in cotton and slave prices.Footnote 99 They also provide new perspectives on many long-standing issues, including the rapid westward march of cotton production and the slave population; the movement of slaves out of industrial and other urban pursuits into cotton; and the roles of scale, the gang labor system, geography, and other factors in determining productivity. The increase in picking rates and in the quality of U.S. cotton also increased the competitiveness of U.S. producers relative to those in the West Indies, Brazil, India, and Egypt. By the 1850s U.S. production accounted for over 80 percent of the cotton consumed in Europe and North America.Footnote 100 British cotton interests were aware of the changes in cotton varieties underway in the United States, but in spite of repeated efforts they were unable to adapt the new technologies to their Asian colonies. The location-specific nature of the innovation process was tailored to fit the environment of the U.S. South and did not immediately spillover to benefit competing regions. The United States maintained the quality advantage in world cotton markets until the boll weevil largely wiped out the production of long and medium staple varieties in the American South, roughly 40 years after the Civil War.
To put the pre-Civil War increase in picking efficiency into perspective, the early (circa 1860) mechanical reaper, which represents the textbook example of an antebellum laborsaving mechanical innovation, increased wheat harvest labor efficiency relative to using a cradle by roughly 50 to 100 percent. The data on the impact of Mexican hybrids suggest that their impact on cotton harvest efficiency likely surpassed that of the reaper on the grain harvest in the antebellum era.Footnote 101 The total impact of the Mexican hybrids would, of course, have been even greater because of their effects on yields and cotton quality. The mechanical reaper had no parallel impact on either yields or quality. But the Mexican cottons did have one important point in common with the reaper and many other mechanical innovations. The new, easier picking cotton varieties helped smooth out the peak-load labor demand so that the labor hours needed for the harvest more closely approximated those needed for non-harvest tasks. This led to a decline in the often-heard comment that farmers planted more cotton than they could pick, and (as with the diffusion of the reaper) it presumably led to an increase in acres planted. These were some of the ways that biological innovations reshaped the opportunities cotton farmers faced and fundamentally altered the antebellum southern economy.