Healthcare-associated infections (HAIs) caused by antibiotic-resistant bacteria are a serious public health threat; they are associated with poorer outcomes and increased cost of care compared to HAIs due to antibiotic-susceptible organisms.1–Reference Shorr4 The nature and extent of antibiotic resistance varies geographically, but the problem is widely prevalent.5–Reference Diekema, Pfaller and Schmitz14 Geographic variability may reflect differences in antibiotic use, infection control, and pathogen characteristics of prevalent strains. Complicating the interpretation of regional antibiotic resistance assessments is the fact that key metrics and methods of measuring antibiotic resistance often vary between regions.5, Reference Zilberberg, Shorr and Kollef10–Reference Kallen, Hidron, Patel and Srinivasan12
In the United States, the Centers for Disease Control and Prevention (CDC) has published guidelines for preventing the transmission of antibiotic-resistant pathogens in healthcare settings.15 Individual healthcare facilities typically are responsible for implementing interventions designed to prevent transmission of HAIs including resistant organisms.Reference Siegel., Rhinehart., Jackson. and Chiarello.16 However, recent reports have underscored the importance of using regional data to inform regional collaborative efforts to reduce HAIs or antibiotic-resistant infections.Reference Smith, Dushoff, Perencevich, Harris and Levin17–20 CDC has published risk-adjusted, state-level summary statistics regarding HAI prevention success.21 These reports have helped local hospital administrators and state public health authorities understand HAI prevention successes and areas in need of improvement.22, 23
Similar state-level summary data on antibiotic resistance may help state or regional efforts to reduce infections due to antibiotic-resistant bacteria,24 and these data can be useful to aid antibiotic stewardship efforts.1 Previous attempts to evaluate regional differences in antibiotic resistance among HAIs in the United States have varying results and relied on administrative data,Reference Zilberberg, Shorr and Kollef10 convenience samples of facilities,Reference Sannes, Kuskowski and Johnson9, Reference Gales, Jones and Sader13, Reference Diekema, Pfaller and Schmitz14 or large geographic areas aggregating data across many states.Reference Kallen, Hidron, Patel and Srinivasan12 Surveillance through CDC’s National Healthcare Safety Network (NHSN) began in 2006 as a voluntary, hospital-based reporting system to monitor HAIs and to inform local and national prevention efforts. When reporting of CLABSI from acute care hospital intensive care units (ICUs) was required for participation in the Centers for Medicare and Medicaid Services’ (CMS) Hospital Inpatient Quality Reporting (IQR) program, enrollment expanded to 4,100 healthcare facilities at the beginning of 2011.25 However, antibiotic susceptibility data are not reported publically as part of this program. As an initial step in developing state/regional summary measures of antibiotic resistance, we analyzed central line-associated bloodstream infection (CLABSI) data, and we have described an approach to risk-adjusting a state-level metric for direct comparison between states and the impact of this risk adjustment. Ultimately, these methods can be applied to more representative data to make accurate regional estimates of antibiotic resistance.
METHODS
Surveillance Infrastructure
NHSN surveillance processes on CLABSI are described in detail on the CDC website (http://www.cdc.gov/nhsn/about.html). Pathogen and antimicrobial susceptibility data reported to NHSN are provided by the facility’s designated clinical microbiology laboratory. Susceptibility test results must have been reported for a select group of pathogens and antimicrobials if testing was performed. Laboratories are expected to use current Clinical and Laboratory Standards Institute (CLSI) standards for antimicrobial susceptibility testing. Results for each of the selected pathogens were reported to NHSN as the category interpretation of “susceptible” (S), “intermediate” (I), “resistant” (R), or “not tested.” We limited the analysis to ICUs reporting CLABSIs in 2011 because reporting from these locations was nearly complete in 2011 due to the CMS IQR program requirement.25
Selection of Antibiotic-Resistant Infections
For this analysis, 3 distinct antibiotic-resistant phenotypes were identified among ICU CLABSI reported to the NHSN: (1) methicillin-resistant Staphylococcus aureus (MRSA), defined as S. aureus reported as resistant to oxacillin, methicillin, or cefoxitin; (2) extended-spectrum cephalosporin (ESC)-nonsusceptible Klebsiella species, defined as K. pneumoniae or K. oxytoca reported as I or R to cefotaxime, ceftazidime, ceftriaxone, or cefepime; and (3) carbapenem-nonsusceptible Klebsiella species, defined as K. pneumoniae or K. oxytoca reported as I or R to imipenem, meropenem, or doripenem.
Statistical Analyses
Statistical analyses were conducted using SAS version 9.3 (SAS Institute, NC) and SAS callable SUDAAN version 11.0 (Research Triangle Institute, NC). Frequency distributions of selected healthcare facility characteristics were determined for ICU CLABSIs according to study isolates or not. To determine factors influencing variability in resistance metrics, associations between patient- or facility-level characteristics among ICU CLABSIs due to an antibiotic-resistant phenotype were compared to those without resistance using χ2 or Fisher’s exact tests as appropriate. A separate analysis was performed for each resistant phenotype.
Factors associated with an ICU CLABSI being attributed to an antibiotic-resistant phenotype were explored in multivariable regression models including patient-level characteristics (age, gender) because these might be plausible indicators of a biological association with antibiotic-resistant infections and facility-level percentage of isolates tested for antibiotic resistance. Other facility-level characteristics such as facility type, facility bed size, and medical school affiliation were evaluated in bivariate analyses but were not considered for multivariable modeling. These characteristics may be proxies for factors such as infection control practices, for which adjustment may not be appropriate in this setting, and therefore we did not include hospital bed size or teaching status into the modeling process. Specifically, adjustment would not be appropriate, as doing so would “discount” resistance metrics based on poor cross-transmission prevention efforts (if bed size or teaching status were proxy measures for such poor efforts) when trying to compare resistance metrics by region, state, or facility. To develop models for each of the 3 phenotypes, multivariable logistic regression by the backward elimination method was employed. Because patient age was a continuous variable, different parameter categorizations were examined when obtaining the best fit model with the smallest AIC and –2 log likelihood value. Statistical significance was assessed at the 0.05 level, and all tests were 2-sided.
Calculation of State-Specific Summary Measures of Nonsusceptibility
The infection rate was calculated by dividing the total number of ICU CLABSIs for each antibiotic-resistant phenotype in each state by the pooled number of ICU central line days for each state. The crude percent nonsusceptible was calculated by dividing the total number of ICU CLABSIs for each antibiotic-resistant phenotype in each state by the total number of ICU CLABSI isolates of S. aureus or Klebsiella species tested for susceptibility to at least 1 of the antibiotics within the antibiotic-resistant phenotype definition.Reference Rothman and Boice26 For MRSA, the percent nonsusceptible is equivalent to the percent resistant because, by definition, there are no breakpoints for S. aureus for testing intermediate (I) to oxacillin or cefoxitin.
A third state summary metric, the adjusted percent nonsusceptible, was calculated for direct comparison between states. Adjusted percent nonsusceptible for each phenotype was computed for states reporting antibiotic susceptibility test results from a minimum of 20 ICU CLABSI isolates of S. aureus or Klebsiella species to impose statistical precision. Among these states, state-specific point estimates of adjusted percent nonsusceptible were obtained as functions of predicted marginals by multivariable logistic regression using SAS-callable SUDAAN. Marginal prediction takes a model-based approach to computing standardized estimates and allows comparisons of predicted outcomes (percent nonsusceptible) between groups after controlling for differences in covariate distributions.Reference Graubard and Korn27 Therefore, standardized results from fitted logistic regression models can be compared like percentages (percent nonsusceptible) across these states. To compute 95% confidence intervals of the metrics, variance estimates of unadjusted and adjusted percent nonsusceptible were obtained using the Taylor linearization method,Reference Wolter28 and variances of infection rates were estimated using the mid-P method.Reference Rothman and Boice26
RESULTS
Reporting Facilities
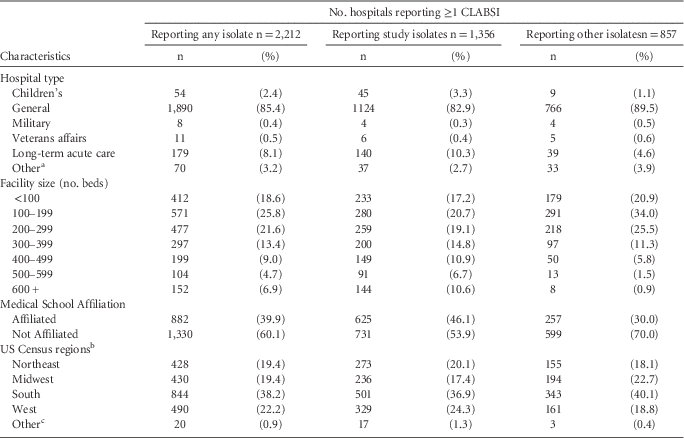
During 2011, 22,561 CLABSIs were reported from 2,212 facilities (58.0% of the total facilities participating in NHSN CLABSI reporting); 1,145 facilities (51.8%) reported at least 1 S. aureus CLABSI, and 732 (33.1%) reported at least 1 Klebsiella CLABSI (Table 1).
Characteristics of Hospitals Reporting Central Line-Associated Bloodstream Infections (CLABSIs) from Intensive Care Units to the National Healthcare Safety Network, 2011

a Oncology hospitals, orthopedic hospitals, psychiatric hospitals, inpatient rehabilitation hospitals, surgical hospitals, women’s hospitals, women’s & children’s hospitals, critical access hospitals.
b Northeast: Connecticut, Maine, Massachusetts, New Hampshire, New Jersey, New York, Pennsylvania, Rhode Island, and Vermont;
Midwest: Illinois, Indiana, Iowa, Kansas, Michigan, Minnesota, Missouri, Nebraska, North Dakota, Ohio, South Dakota, and Wisconsin;
South: Alabama, Arkansas, Delaware, District of Columbia, Florida, Georgia, Kentucky, Louisiana, Maryland, Mississippi, North Carolina, Oklahoma, South Carolina, Tennessee, Texas, Virginia, and West Virginia;
West: Alaska, Arizona, California, Colorado, Hawaii, Idaho, Montana, Nevada, New Mexico, Oregon, Utah, Washington, and Wyoming.
c Armed Forces, Puerto Rico, and US Virgin Islands
Crude Distributions of Nonsusceptible Isolates by Facility and Patient Characteristics
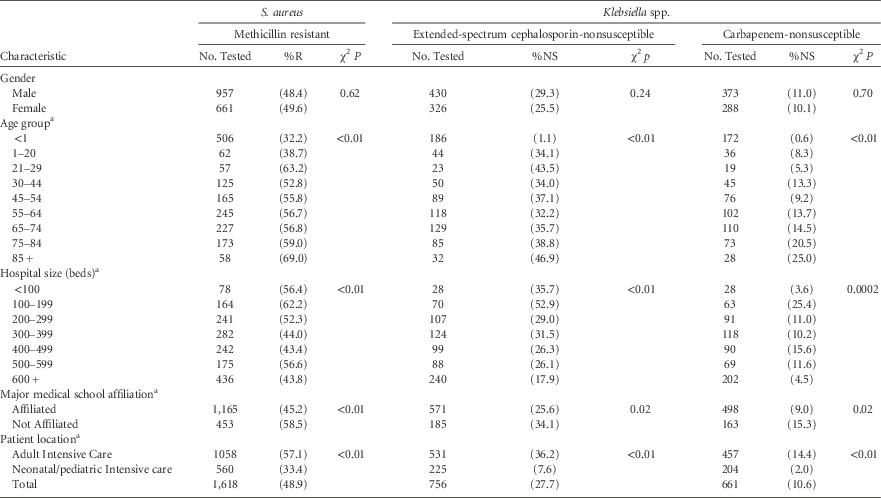
Of 1,750 S. aureus CLABSIs reported from ICUs, methicillin susceptibility test results were available in 1,618 isolates, among which 791 (48.9%) were due to MRSA. Of 889 Klebsiella CLABSIs reported from ICUs, ESC susceptibility test results were available in 756 isolates, among which 209 (27.7%) were due to ESC-nonsusceptible Klebsiella, and carbapenem susceptibility test results were available in 661 isolates, of which 70 (10.6%) were due to carbapenem-nonsusceptible Klebsiella. For all phenotypes, there was no significant difference in the percent nonsusceptible among males and females, while increasing age was significantly associated with decreasing susceptibility (Table 2). There was a significant difference in the percent nonsusceptible among the patient locations for all phenotypes, with adult locations having higher levels of resistance than neonatal and pediatric locations. However, differences between adult ICU and non-ICU locations, and between pediatric ICU and non-ICU locations, were in most cases small and not statistically significant (data not shown). Isolates from smaller hospitals and those without medical school affiliations were significantly more likely to be nonsusceptible than isolates from larger hospitals or hospitals with medical school affiliations (Table 2). Approximately 37% of Staphylococcus aureus isolates and 27% of Klebsiella species in medical school–affiliated hospitals came from infants. Similar proportions of study isolates in large hospitals (>200 beds) were obtained regarding infants.
Percent of Isolates Associated with Central Line-Associated Bloodstream Infections (CLABSIs) Reported from Intensive Care Units Testing Nonsusceptible to Select Antimicrobial Agents, by Patient and Facility Characteristics, National Healthcare Safety Network, 2011
NOTE. Methicillin resistance was defined as resistance to oxacillin, cefoxitin, or methicillin. Extended-spectrum cephalosporin-nonsusceptible was defined as K. pneumoniae or K. oxytoca testing intermediate (I) or resistant (R) to cefotaxime, ceftazidime, ceftriaxone or cefepime. Carbapenem-nonsusceptible was defined as K. pneumoniae or K. oxytoca reported as I or R to imipenem, meropenem, or doripenem. R, resistant; NS, nonsusceptible.
a χ2P<0.05, all phenotypes.
Adjusted State-Specific Summary Measure of Non-susceptibility
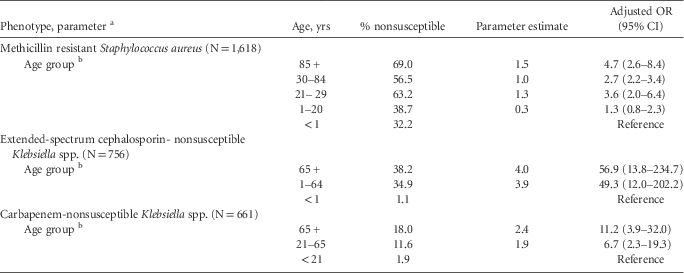
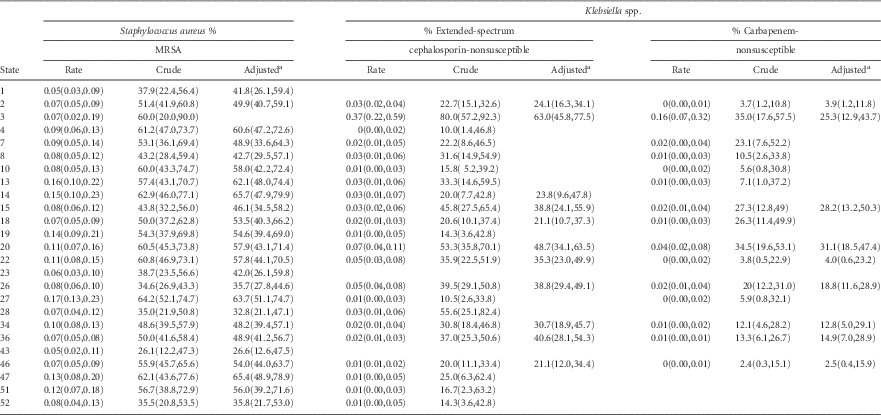
Although the proportion of isolates tested for the relevant antibiotic susceptibility varied between facilities (and states), this variation was not significantly associated with the percent nonsusceptible and was dropped from the model-building process. The final regression models included age divided into 3 or 4 categories, depending on the resistant phenotype (Table 3). Controlling for age in these models, the adjusted percent nonsusceptible of each resistant phenotype was calculated. The crude infection rate, crude percent nonsusceptible, and adjusted percent nonsusceptible values are plotted in Figure 1 (and the Appendix).
State-specific rate and percentage of isolates with resistant phenotypes, reported as central line-associated bloodstream infections (CLEBSIs) from intensive care units, National Healthcare Safety Network, 2011. Triangle represents point estimate of rate per 1,000 device days, open bar represents crude proportion and grey bar represents adjusted proportion. Graph 1A represents methicillin-resistant Staphylococcus aureus (MRSA). Graph 1B represents extended-spectrum cephalosporin-nonsusceptible (ESC-NS) Klebsiella spp. Graph 1C represents carbapenem-nonsusceptible (C-NS) Klebsiella spp.
Multivariable Analysis of Factors associated with Resistant Phenotypes among Isolates associated with Central Line-Associated Bloodstream Infections from Intensive Care Units, National Healthcare Safety Network, 2011
NOTE. Methicillin resistance was defined as resistant to oxacillin, cefoxitin, or methicillin. Extended-spectrum cephalosporin-nonsusceptible was defined as K. pneumoniae or K. oxytoca testing intermediate (I) or resistant (R) to cefotaxime, ceftazidime, ceftriaxone or cefepime. Carbapenem-nonsusceptible was defined as K. pneumoniae or K. oxytoca reported as I or R to imipenem, meropenem, or doripenem.
OR, odds ratio; CI, confidence interval; N, number of isolates.
a Eligible parameters gender and facility-level percentage of isolates tested for antibiotic resistance, were not statistically significant and therefore dropped in the final models of all 3 phenotypes.
b This final model with specified age groups is the best fit model with the smallest AIC and –2 log likelihood value after different age parameter categorizations were examined including age as a continuous variable.
For MRSA, 24 states had sufficient data to calculate an adjusted measure. The adjusted percent nonsusceptible values differed only slightly from crude percent nonsusceptible values (Figure 1A), in all cases by fewer than 5%, and usually within 1%–2%. The variability of the state-specific crude percent nonsusceptible (range: 26%–64%) and adjusted percent nonsusceptible (range: 27%–66%) was large (Figure 2), with only a slight narrowing of the interquartile range in the adjusted measure compared to the crude measure (~19%–16%). In 5 instances (states 2, 13, 18, 27, and 35), a state’s rank shifted relative to the position of other states based on the respective measure (Figure 3A).
Distributions of state-specific percentage of pathogenic central line-associated bloodstream infection (CLEBSI) isolates nonsusceptible to selected antibiotics in intensive care units, unadjusted (crude) vs. adjusted (model-based) values, National Healthcare Safety Network, 2011. MRSA, methicillin resistant S. aureus; ESC-NS, extended-spectrum cephalosporin-nonsusceptible Klebsiella spp.; C-NS, carbapenem-nonsusceptible Klebsiella spp. Horizontal lines represent maximum, minimum, 75th, 50th, and 25th percentile values. Diamond represents the mean value.
Linked values of unadjusted (crude) and adjusted (model-based) state-specific percentage of isolates with selected resistance phenotype among central line-associated bloodstream infections (CLEBSIs) from intensive care units, by state, National Healthcare Safety Network, 2011. Graph 3A represents methicillin-resistant Staphylococcus aureus (MRSA). Graph 3B represents extended-spectrum cephalosporin-nonsusceptible (ESC-NS) Klebsiella spp. Graph 3C represents carbapenem-nonsusceptible (C-NS) Klebsiella spp.
For ESC-nonsusceptible Klebsiella spp., 11 states had sufficient data to calculate an adjusted measure. Compared to crude percent nonsusceptible measures, the adjusted percent nonsusceptible values differed appreciably in only 2 states: state 15 with a lower adjusted value by 7%, and state 3 with a lower adjusted value by 17% (Figure 1B); otherwise, differences were minor (0–4%). The variability of the state-specific measures of crude percent nonsusceptible (range: 20%–80%) and adjusted percent nonsusceptible (range: 21%–63%) was large (Figure 2), but the interquartile range in the adjusted measure was narrower (17%) compared with that in the crude measure (25%). In only 1 instance did the state’s value shift ranking relative to the position of other states based on the respective measure (ie, only 1 line crossed other lines in state 36) (Figure 3B).
For carbapenem-nonsusceptible Klebsiella spp., 9 states had sufficient data to calculate an adjusted measure. The adjusted percent nonsusceptible values differed appreciably from the crude percent nonsusceptible only in state 3, with a lower adjusted value by 10%; this state happened to be the same state with a large difference between adjusted and crude measures for ESC-nonsusceptible Klebsiella spp. (Figure 1C). Differences in all other states were minor (1%–4%). The variability of the state-specific measures of crude percent nonsusceptible (range: 2%–35%) and adjusted percent nonsusceptible (range: 3%–25.3%) was again large (Figure 2). There was essentially no difference in the size of the interquartile range between the adjusted measure and the crude measure (Figure 2). In only 1 instance (state 3) did the state’s value shift in rank (Figure 3C).
DISCUSSION
Using susceptibility data for S. aureus and Klebsiella CLABSIs reported from ICUs to the NHSN in 2011, we have demonstrated that the extent of antibiotic resistance varies considerably between different states. Among the 3 state-level summary measures of nonsusceptibility that we explored, the most state-to-state variability was seen for the crude percent of isolates testing nonsusceptible. However, the age-adjusted state-summary resistance measure (ie, adjusted percent nonsusceptible), with few exceptions, did not appreciably change the state-specific values either in magnitude or relative to other states compared to the crude measure.
State-level summary antibiotic resistance measures have public health implications. Summary measures have the potential to inform empiric treatment recommendations where local representative data are not available. Second, utilizing a state-specific summary measure should allow providers and public health agencies at the state level to gain situational awareness around the magnitude of the resistance problem in their jurisdictions, more so than if they relied on data from a few selected healthcare facilities. This is especially true regarding resistant phenotypes of an urgent threat nature, such as carbapenem-resistant Enterobacteriaceae (CRE). The variability in resistance measures reflected in these data supports other studies’ findings of regional variability in resistance related to HAIs. It also supports the notion that 1 single approach to reducing infections with antibiotic-resistant bacteria may not be appropriate for all locales.Reference Zilberberg, Shorr and Kollef10, Reference Kallen, Hidron, Patel and Srinivasan12, Reference Tillotson, Draghi, Sahm, Tomfohrde, del Fabro and Critchley29
Unique to this analysis is our adjustment of a summary measure of antibiotic resistance through a modeling process, which allows for valid comparisons between state-specific measures. The direct standardization method that summarizes the measure across adjusting categories is commonly used for comparison between groups.Reference Hennekens, Buring and Mayrent30 However, in states with small values for tested isolates, many categories have small cell sizes or empty cells, leading to unstable category-specific rates to calculate adjusted summary measures. In addition, some of the adjusting variables may be continuous in nature, and it may be difficult to optimize the categorization of these variables, making direct standardization less feasible. The model-based approach can circumvent these inherent limitations in the direct standardization method. Unfortunately, even with the model-based method, the lack of appreciable changes in the adjusted measure compared to the crude measure likely reflects an absence of adequate factors to incorporate into the modeling process (residual confounding). Such factors, those that are associated with resistance at the patient level but are not confounded by facility-specific infection control activity, are limited in our current data set (eg, age, gender). Additional opportunities for improved adjustment of state summary resistance measures include incorporation of patient-level or ward-level severity measures or more likely hospital-wide severity of illness measures such as a case mix index.Reference Kuster, Ruef and Bollinger31 Ideally, measures used to compare one state to another should be as risk adjusted as possible. For now, given the limited availability of adjustment factors that systematically influence the values, crude summary measures of resistance appear to be a reasonable approach to evaluating geographic differences in summary resistance patterns.
There were notable differences in the impact of adjustment on specific resistant phenotypes. For MRSA there was minor impact: although 5 states shifted their relative ranking to one another, the change in the value of the resistance measure was small. In contrast, for the most uncommon resistant phenotype, carbapenem-nonsusceptible Klebsiella spp., the state with the highest crude value had a substantial decrease (10%) in the percent nonsusceptible after age adjustment because, unlike other states, all ICU patients with Klebsiella CLABSIs in that state were 21 years and older, apparently inflating the crude percent nonsusceptible. Despite this, the overall variability in the percent nonsusceptible did not change with adjustment; the range and interquartile range essentially stayed the same. This finding suggests that the variability of antimicrobial resistance among the states is likely related to factors (other than age) such as cross-transmission between patients or facilities.
A notable observation that CLABSIs reported from large, academic hospitals have less-resistant pathogens than those from smaller non-academic hospitals could be partly explained by the presence of large proportions of infants represented in the patient population with CLABSIs in these large, academic hospitals, and these infants least often had resistant pathogens.
Overall, these data indicate that crude summary measures of resistance may suffice at present for assessing geographic variability. However, the generalizability of this finding is constrained by several study limitations. The isolates obtained from CLABSI do not represent hospital patients in general. Although we adjusted for state differences in age distributions, additional explanation for regional variability in antibiotic resistance could range from differences in laboratory testing standards and reporting bias to differences in patient mix. Data used in the analysis are for a small fraction of HAIs; CLABSIs account for <10% of HAIs occurring in acute care hospitals.Reference Magill, Edwards and Bamberg32 Therefore, the magnitudes of the proportions presented in this paper do not reflect the magnitude of resistance problem accurately; however, we believe they do reflect the impact of adjusting these summary measures accurately. It is possible that the variability of, and impact of adjustment on, resistance measures may differ for other HAI types, and this topic requires further analysis.
Additional limitations include the relatively small number of states represented in some comparisons. Although eliminating summary values comprised of fewer than 20 isolates helped to exclude outliers, it reduced the number of states included in each analysis. Similarly, although all facilities within a state reporting to NHSN could have contributed data to the state summary value, only those that did report a CLABSI are represented in the percent nonsusceptible measure. However, we did also construct crude resistance infection incidence measures that included exposure data (ie, cumulative central line days) from all facilities reporting CLABSI data to NHSN and is more representative of facilities within the state. This measure has an added advantage of better reflecting infection burden compared to the percent nonsusceptible.Reference Schwaber, De-Medina and Carmeli33
Reducing the transmission of antibiotic-resistant bacteria in healthcare settings remains a high priority for patients, healthcare providers, and public health agencies. Although the relative value of the different tools in place for hospitals and local health departments to reduce these infections is still uncertain, state-specific summary measures (which ideally include all infection types) should be able to provide health authorities and healthcare providers within a region or state situational awareness of the magnitude of the resistance problem in their area. The improvement of such measures by identifying and applying factors such as laboratory practices and patient mix into a risk adjustment strategy and by incorporating test results from more clinical cultures is needed. However, producing state summary resistance measures and assessing their utility using existing national data will be a critical first step toward reducing the emergence and spread of antibiotic resistance in US hospitals.
ACKNOWLEDGMENTS
We thank the NHSN participants for their ongoing efforts to monitor infections and improve patient safety, and our colleagues in the Division of Healthcare Quality Promotion, who tirelessly support this unique public health network.
Financial support. The NHSN surveillance system is supported by the Division of Healthcare Quality Promotion, Centers for Disease Control and Prevention.
Potential conflicts of interest. All authors report no conflicts of interest relevant to this article.
State-Specific Rate and Percentage of Isolates with Select Resistant Phenotypes, reported as Central Line-Associated Bloodstream Infections from Intensive Care Units, National Healthcare Safety Network, 2011