


1. Introduction
It is now realized that ice sheets often flow across beds of weak and poorly consolidated sediments, and that such beds may contribute to the forward motion of ice. This has altered our view of the mechanics of ice flow, in particular with regard to ice streams, and raises the possibility that substrate properties may exert a strong control on ice-sheet behaviour and stability. A product of the processes operating at the bed is that distinctive subglacial bedforms may be generated. Theories of bedform creation (e.g. “the drumlin problem” (Reference Menzies and RoseMenzies and Rose, 1987)) are therefore no longer just an interesting academic puzzle, but are a key to unlocking the workings of part of the subglacial system. We can only fully understand the mechanics of ice flow by ascertaining the nature and processes of ice–bed coupling, which must include knowledge of how bedforms are created. Or put another way, we do not understand ice flow over soft beds until we have solved the drumlin problem.
Mega-scale glacial lineations (MSGLs) have been described as elongate streamlined ridges of sediment produced subglacially and are similar to flutes and drumlins but much larger in all dimensions (Reference ClarkClark, 1993). Typical dimensions are lengths of 6–100 km, widths of 200–1300 m and spacing of 200 m−5 km. In this paper we take the view that the appearance of ridges is misleading, and a more useful visual model is that of a highly grooved till surface. From this, we develop a qualitative model of how MSGLs are produced. We hypothesize that large bumps (10–103 m) in the base of the ice sheet act as “keels” that plough through soft sediments, carve elongate grooves and squeeze sediment up into intervening ridges.
Methods to validate or falsify this model are: geophysical observations of the real-time process in operation; submarine swath mapping and very high-resolution seismic reflection profiling of MSGLs in order to elucidate their internal structure as indicative of the ploughing process; numerical modelling of the ice–bed system to assess the plausibility of generating keels and sustaining them downstream; and development of predictions of the geomorphology that should arise from such a process, compared with the actual geomorphology found on exposed ice-sheet beds. This paper explores the latter two methods, and reports the predicted nature of landforms arising from the groove-ploughing hypothesis which are then compared to observations from Canada, the Arctic and Antarctic sea floor and the Norwegian continental shelf.
Characteristics of MSGLs are firstly reviewed, their association with fast-flowing ice established, and the issue of whether they are produced by groove carving or ridge building is discussed and illustrated with a case study. The grooveploughing hypothesis is introduced, and its physical viability explored by numerical modelling and geophysical observations of ice-stream beds. In order to help evaluate our hypothesis, we make a range of predictions on the nature of the geomorphology that should be produced. We then examine all available data on the characteristics of MSGLs in order to assess the degree to which they match with the predictions. A discussion on the plausibility of the grooveploughing hypothesis is presented followed by implications with regard to ice-stream mechanics.
2. Mega-Scale Glacial Lineations
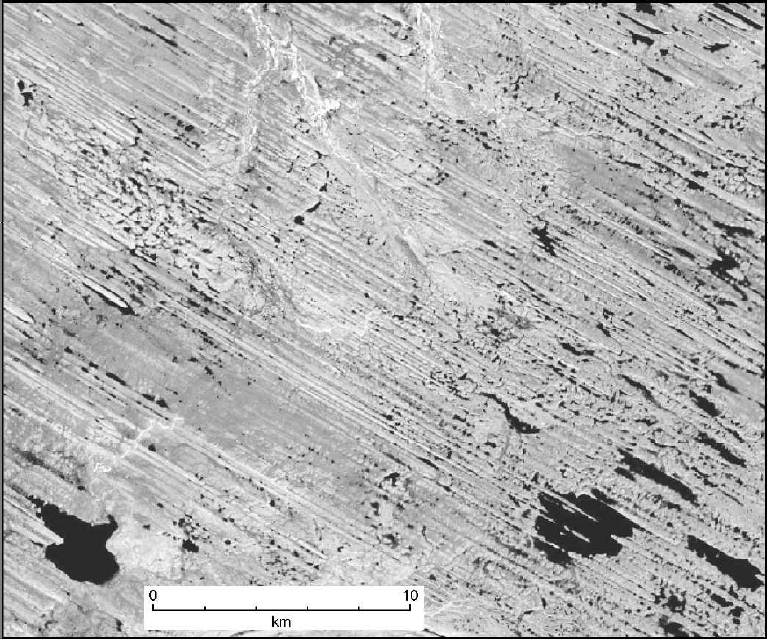
MSGLs are by far the largest component of the family of subglacial bedforms, and their large size often requires satellite images or wide-swath submarine imaging to observe them, as they can appear too fragmented to be recognizable at the scale of aerial photographs or field investigation (Fig. 1). Their widespread occurrence was first reported for parts of the bed of the Laurentide ice sheet (Reference ClarkClark, 1993, Reference Clark1994) and they have since been found elsewhere (Fig. 2). If drumlins form by a mechanism of sediment deformation (e.g. Reference Boulton, Menzies and RoseBoulton, 1987; Reference HartHart, 1997; Reference HindmarshHindmarsh, 1998a, Reference Hindmarshb) then an extension of this theory is that high strain rates, accompanied by sediment availability, can produce much more attenuated forms and up to the scale of MSGLs. Reference ClarkClark (1993) took this view and argued that MSGLs were formed under conditions of fast ice flow such as experienced in ice streams or surge events, and that this explains such high elongation ratios (∼100 :1), and straight form over great distances. It has been argued that they can thus be used as an indicator of palaeo-ice-stream location (Reference ClarkClark, 1993, Reference Clark1999; Reference Stokes and ClarkStokes and Clark, 1999).
Satellite image (Landsat ETM+) illustrating MSGLs recording ice flow northwestwards as part of the bed of the Dubawnt Lake palaeo-ice stream, Keewatin, Arctic Canada. Contrary to the usual descriptions of the terrain as comprising parallel ridges, we view it as an originally flat surface that has become highly grooved. Image is centred at 64°02′ N, 101°51′ W.
Distribution of known MSGLs in North America (a), Antarctica (b) and Scandinavia (c) (note that positioning is only approximate). For all occurrences, exposed bedrock exists immediately upstream (as determined from Reference FultonFulton, 1995, and the following publications). Numbers on diagram relate to the following references: 1. Reference LemkeLemke (1958); 2. Reference Boulton and ClarkBoulton and Clark (1990a, Reference Boulton and Clarkb); 3. Reference ClarkClark (1993); 4. Reference EvansEvans (1996);5. Reference Shaw, Faragini, Kvill and RainsShaw and others (2000); 6. Reference Shipp, Anderson and DaviesShipp and Anderson (1997); 7. Reference Shipp, Anderson and DomackShipp and others (1999); 8. Reference Longva and ThorsnesLongva and Thorsnes (1997); 9. Reference Clark, Knight and GrayClark and others (2000); 10. Reference Canals, Urgeles and CalafatCanals and others (2000); 11. Reference Polyak, Edwards, Coakley and JakobssonPolyak and others (2001); 12. Reference Wellner, Lowe, Shipp and AndersonWellner and others (2001); 13. Reference Clark and StokesClark and Stokes (2001); 14. Reference Stokes and ClarkStokes and Clark (2003). Unnumbered MSGLs are from our observations from satellite images.

Using swath bathymetry and high-resolution seismic investigations, MGSLs have, for the first time, been discovered on the Antarctic continental margin (Reference Shipp, Anderson and DomackShipp and others, 1999; Reference Canals, Urgeles and CalafatCanals and others 2000, fig. 2). We take these remarkable finds as validation of the association between MSGLs and fast flow as they are found to lie distal to positions of existing or inferred ice streams. Furthermore, MSGLs have never been found in locations incompatible with ice streaming.
As an indication of the dimensions of MSGL, we report morphometric measurements from an extensive pattern comprising the bed of the Dubawnt Lake palaeo-ice stream, Arctic Canada. The ice stream was 450 km in length and its width varied from 305 km in the onset zone to 140 km in the main trunk to 190 km at the terminus (Reference StokesStokes, 2000; Reference Stokes and ClarkStokes and Clark, 2003). This terrestrially terminating ice stream is reconstructed to have played a major role in deglaciation of the Laurentide ice sheet, and it is probably the most complete terrestrial record of an exposed ice-stream bed. Figure 1 illustrates some of the MSGLs, which show high parallel conformity and lengths of up to 12 km. In order to determine their characteristic wavelength (spacing, transverse to flow) we extracted 37 transverse profiles (total length 1200 km) from Landsat-7 Enhanced Thematic Mapper Plus (ETM+) imagery (15 m resolution) and subjected them to spectral analysis. Wavelengths are 208–1166 m with an average of 587 m.
MSGLs (Fig. 1) have usually been perceived as elongate ridges of sediment, and this has focused attention on how the ridges were produced, and encouraged a comparison to drumlins and their formation (Reference ClarkClark, 1993; Reference Shipp, Anderson and DomackShipp and others, 1999; Reference Wellner, Lowe, Shipp and AndersonWellner and others, 2001). However, because the process that leads to MSGL production has not yet been observed, it is hard to ascertain whether they are the result of a predominantly ridge-building or groove-carving process. Objectively, they are better described as longitudinally aligned corrugations, or ridge–groove structures. We argue that their assessment as ridges has been premature and unfounded. From the palaeo-record the only way of demonstrating that relief amplification was by groove carving is to find an antecedent marker surface that has been cut into. This would demonstrate that actual grooves were cut, rather than their merely appearing as such because they are between two ridges. Figure 3 illustrates this. In the widely researched Peterborough drumlin field in Ontario, Canada, for a small portion of the drumlin field the smooth drumlinized surface has grooves cut into it. These can be seen as wide (125 m) angular grooves which slice through successive drumlins and cleave some of them in two, and as a finer-scale system of shallow grooves or scratches which run across drumlin surfaces and inter-drumlin areas. We interpret the geomorphology here as a multi-stage process, whereby the classical drumlins were first created and then a phase of groove ploughing occurred, cutting into the antecedent drumlin surface. It appears that there are two populations of grooving: the deeper ones which actually cut small gorges through drumlins, and the finer-scale ones making minor modification of the surface.
Demonstration of grooves cut into an antecedent till surface. Stereo couplet of aerial photographs (view with a stereoscope) of part of the Peterborough drumlin field, Ontario, Canada. Ice flow from the northwest. The original drumlin surface has been modified by subsequent phases of groove ploughing. Wide (∼125 m) angular grooves can be observed cutting through drumlins, and there is widespread scratching of the landform surface, particularly evident within the annotated area. Image is oriented northwards, and is from aerial photographs, A25686-88+89, available from the Geological Survey of Canada.

In the above case, only small and spatially restricted grooves (up to 8 km long, 200 m wide) were generated, and we do not infer that an ice stream was responsible. In a paper that mostly focuses on the formation of the drumlins (Reference HeidenreichHeidenreich, 1964), the presence of these groove systems is noted and it is reported that many of the grooves are related to upstream bedrock protuberances. We take this case study as a demonstration that grooves have been cut, and from here on explore whether MSGLs were created by this process on a larger scale.
In the groove-ploughing hypothesis, we focus on how a hard, bumpy ice base may shape soft ice-stream beds into longitudinally aligned corrugations. Following from Reference Tulaczyk, Scherer and ClarkTulaczyk and others (2001) a qualitative theory is developed and presented that may account for the carving of grooves, and production of MSGLs.
3. Groove-Ploughing Hypothesis
Ice is intermediate in strength and strain rate between bedrock and soft till. We therefore expect that bedrock topography can shape the form of basal ice (ice is weaker) to produce a bumpy ice base, and if this ice moves downstream onto soft sediments, then the bumpy base can shape the soft till (ice is stronger). Because the basal roughness of the ice is sliding across the till surface, down-pointing protuberances, or keels, will carve into the sediment, ploughing grooves and deforming sediment around them as the keels pass. Till will be transported downstream and laterally by this mechanism. Soft till will be squeezed away from the keels into intervening high points in the basal ice, and may thus be moulded into ridges. This is schematically represented in Figure 4. The process is analogous to that of subglacial clasts, embedded in basal ice, ploughing their way through till (e.g. Reference BegetBeget, 1986; Reference Brown, Hallet and BoothBrown and others, 1987), but the roughness operates at the larger scale of 10–103 m. A garden rake dragged across a soil surface is a reasonable analogy, carving grooves and pushing sediment into ridges.
Schematic ice-stream cross-section illustrating how roughness elements in the base of the ice carve and mould the till surface into groove–ridge systems characteristic of MSGLs. Note that two of the larger keels have penetrated through the till into underlying sediments, eroding into them, providing basal drag and nourishing the till with a fresh supply of sediment. Diagram is not to scale.

Essential to this model is that roughness can be generated in basal ice and then be transported downstream to areas of soft deformable sediment. This likely occurs across a range of scales from 1 to 103 m. At the larger scales, we envisage a number of scenarios for this, as below.
3.1. Roughness production across a bedrock ridge
Consider the case of ice that has to pass over a prominent bedrock ridge or hill. As the ice base passes across the ridge, it will be deformed to conform to its profile shape, which will then be carried downstream for some distance and, if carried across soft till, can start the groove-ploughing process. In this scenario, there is continuous production of basal roughness, so the downstream till surface should experience continuous transmission of ice keels.
Although similar in some respects to crag-and-tail landforms (i.e. drift ridges in the lee of bedrock protuberances), the scale and process is different. For crag-and-tails, the main factor is the protuberance and there is a size limitation imposed by the length of cavity that may form behind it. In our scenario, the main factor is the down-pointing keel, and as long as this survives downstream then groove–ridge systems can be created for great lengths. Cavities are not necessary for their formation.
3.2. Roughness production in onset zones of ice streams
Ice streams are characterized by a main trunk of fast-moving ice that is fed by a large fan-shaped onset zone. This provides a strong velocity contrast between slow-moving ice in the onset zone, where we presume there is enough elapse of time for basal ice to be shaped by the bedrock roughness, and fast flow velocities in the trunk which can carry roughness elements great distances downstream. If the onset zone is positioned over rough bedrock and the ice-stream trunk over soft sediments, then this is an ideal situation for the production of grooves. As ice velocities are fast, we expect these grooves to extend great distances downstream and to produce MSGLs. The velocity contrast between onset and trunk zones may thus enable continuous roughness generation and the consequent production of MSGLs.
Roughness produced in the onset zone is likely to be modified and changed in spatial frequency as it moves downstream. A single bump, perhaps formed by a 500 m diameter basin, will experience considerable transverse compression as ice flow converges from the wide onset zone through to the main trunk. Transverse compression may be of the order two- to five-fold, and hence the original keel will undergo strain, transforming into a narrow (∼100 m), long keel. According to this notion, profiles of the ice base will have different spatial frequencies at different points downstream.
4. Can Basal Ice Roughness Survive Down-Stream Propagation?
That ice roughness can be produced at the base of ice sheets is self-evident and easily proven (ice usually touches the underlying substrate; cavities are rare). Critical to the groove-ploughing theory, however, is the downstream survival of basal roughness. Over hard bedrock surfaces we expect thermal (i.e. frictional), ice-deformational and mechanical degradation of the roughness, such that bumps may disappear over short distances (102 −103 m). However, if the bumpy base moves onto a much softer and easily deformed surface, we expect the roughness to survive for much greater distances (103–105 m). If the hypothesis presented here has any validity, it is essential to demonstrate the downstream survival of basal roughness.
4.1. Considerations of ice physics
One approach is a consideration of how long it takes a bump to be smoothed out by ice deformation and the effects of differential basal melting. Reference Tulaczyk, Scherer and ClarkTulaczyk and others (2001) present calculations on these processes and conclude that bumps can survive the residence time likely within an ice stream (100 km length, 100 m a−1, gives residence time of 1000 years). Reference Thorsteinsson and RaymondThorsteinsson and Raymond (2000) consider a bumpy ice base moving over a till of viscous rheology and conclude that bumps with small wavelengths (<1 m) are likely to be rapidly reduced by differential melting, but that larger wavelengths are more persistent. For bumps with wavelengths of 30 m (and 5 m amplitude), their calculations indicate much lower rates of differential basal melting and hence downstream survival of roughness for distances of 10–100 km under an ice stream of 500 m a−1 velocity. According to this analysis, the roughness wavelengths necessary for MSGLs, which are an order of magnitude higher, would easily survive the length of ice streams.
In our model, bedrock bumps are prescribed simply by a combination of two sine waves:

where z is bedrock elevation with respect to an arbitrary datum, x is the along-flow horizontal coordinate, y is the horizontal coordinate in the direction transverse to the ice flow, A b is the arbitrarily selected half-amplitude of bedrock bumps (typically assumed to be in the range 10–100 m), kx and ky are wavenumbers (ki = 2πH/λi (i = x; y; λi are wavelengths)), and H is ice thickness (used as a normalizing quantity with units of length). We assume one row of equally shaped bedrock bumps, which are bordered on the downstream side by a widespread region of weak, deformable till. During its motion over the bedrock bumps, the simulated ice base is moulded to reflect their shape. Downstream of the tops of the bedrock bumps, the base is free to relax its shape because of the gradients in lithostatic stresses arising along the uneven ice–till interface due to the ice–till density contact (here assumed to be ρ i = 910 kg m−3 vs ρ t = 2000 kg m−3) (Reference HindmarshHindmarsh, 1998b). Based on an analysis discussed in detail in Reference Tulaczyk, Scherer and ClarkTulaczyk and others (2001), we neglect differential melting as an effective mechanism for removal of long-wavelength basal roughness under conditions of deformable till bed (see also Reference Thorsteinsson and RaymondThorsteinsson and Raymond, 2000).
Fully three-dimensional numerical analysis would appear necessary in order to take into account the full complexity of ice-base deformation in response to horizontal and vertical gradients in lithostatic stresses occurring along the ice base. However, in this simple model we take a much simpler approach analogous to that used in modelling of broad, low subglacial conduits by Reference Hooke, Laumann and KohlerHooke and others (1990). Vertical deformation of the bumpy ice base is assumed to be driven by a generalized vertical lithostatic stress differential, σ (x), whose magnitude is proportional to the density contrast across the ice-base interface (ρ t − ρ i) and to the maximum amplitude of ice bumps in the direction transverse to ice flow, Δz (x):

where g is gravitational acceleration. This generalized deviatoric stress, which is variable in the down-flow direction, gives rise to a vertical deformation rate whose horizontal distribution is assumed to be governed by the following equation (modified from Reference Hooke, Laumann and KohlerHooke and others (1990)):

where z i is ice-base elevation with respect to an arbitrary datum, t is time, w (x;y) is vertical rate of deformation of the ice base, and B and n are ice-flow parameters. Although Equations (2) and (3) represent a significant simplification of a complex problem, they do encapsulate several important aspects of reality. For instance, the distribution of the vertical velocity described by Equation (3) will lead to gradual elimination of ice-base roughness (i.e. flattening of the ice base) because the ice base is deformed upward where ice bumps are present and downward where cavities occur. The mild non-linear dependence of the rate of deformation (with n ≈ 3) on the lithostatic stress differential means that basal roughness with large amplitude (∼10 m) will be eliminated much faster than basal roughness with small amplitude (∼1 m). Figures 5 and 6 show simulated ice-base roughness over and downstream of bedrock bumps obtained by numerical integration of Equation (3) through time. In the process of integration, we have assumed that ice moves in the down-flow direction with an ice-stream velocity of 500 m a−1 and that there is no component of transverse motion. By combining these assumptions with Equation (3), we can fully describe evolution of ice-base geometry by displacing each of its points by finite amounts Δx and Δz within a finite time-step of Δt. The illustrated results come from a modelling run in which we have assumed the following values of adjustable parameters: A b = 20 m, kx = 0.25, ky = 1.0, H = 1000 m, n = 3, and B = 200 kPa a1/n .
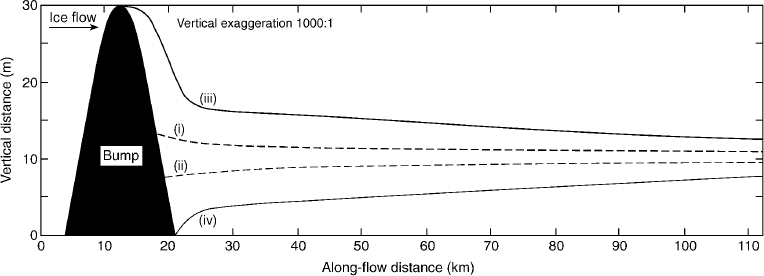
Longitudinal cross-section of a bedrock bump and downstream ice-base geometry, illustrating predicted MSGL relief for cases with (solid lines) and without (dashed lines) isostatic compensation of ice-stream surface topography. Ice-base geometry is determined by numerical integration of Equations (2) and (3). For the case without isostatic compensation, line (i) is the ice base behind the bedrock bump, and line (ii) is the ice base arising from the depression lateral to the bump (i.e. off plane). With the inclusion of isostatic compensation, line (iii) is the ice base behind the bump and line (iv) lateral to the bump. The distance between lines (i) and (ii) shows the predicted transverse relief of MSGL in the case of no isostatic compensation of surface topography. Conversely, the difference between lines (iii) and (iv) illustrates the relief of MSGL with the isostatic compensation. Vertical datum is arbitrary.
Map views of simulated ice-base topography. Grey scales denote ice-base elevation above/below an arbitrary datum (grey bar for scale). A single row of same-size bedrock bumps/depressions with half-amplitude of 20 m is located on the lefthand side. The remaining part of the bed extends for 100 km downstream of the bumps/depressions, with ice-base geometry determined by Equations (2) and (3). (a, b) Bedrock roughness with wavenumbers kx = 0.25 (a) and ky = 1.0 (b) (H = 1000 m); (c, d) sinusoidal bedrock with wavenumbers kx = 0.5 (c) and ky = 2.0 (d) (H = 1000 m). (a) and (c) show ice-base geometry as calculated assuming no isostatic compensation of ice-surface topography, whereas (b) and (d) compensate for surface topography. This demonstrates that inclusion of isostatic compensation permits much greater downstream survival of bumps.

Figures 5 (i, ii) and 6a and c illustrate that Equations (2) and (3) are very effective at decreasing the amplitude of ice-base roughness until it reaches just a few metres. The mechanisms encapsulated in these equations can only explain bedforms with relatively small relief being maintained over length scales of tens and hundreds of km. This relief is smaller than that observed for most MSGLs. Hence, we must invoke an additional hypothesis to explain greater survival of high relief (∼10 m and more) ice-base roughness. This hypothesis is based on the observation of Reference Gudmundsson, Raymond and BindschadlerGudmundsson and others (1998) that bedrock bumps of certain wavelength and amplitude cause the development of so-called flow stripes on the surface of ice streams. These flow stripes have length and width that are strikingly similar to those of MSGLs. They are also associated with surface ridges and depressions, which may serve to diminish the lithostatic stress differentials along the ice-base interface in a manner analogous to the Airy-type isostatic compensation of long-wavelength Earth surface topography. Reference Gudmundsson, Raymond and BindschadlerGudmundsson and others (1998) showed that elongated depressions and ridges develop downstream of bedrock bumps and depressions, respectively. Such geometry may help preserve the ice-base roughness resulting from ice deformation over the same bumps and depressions. Quantitatively, this effect can be introduced into our system of equations by subtracting the amplitude of ice-surface roughness from the amplitude of ice-base roughness. This will diminish significantly the lithostatic stress differential that drives the vertical deformation of the ice base, particularly due to the non-linearity present in Equation (3). Figures 5 (iii, iv) and 6b and d demonstrate that this modification has indeed a significant influence on survivability of basal roughness. By including the isostatic compensation of surface topography, we can maintain basal roughness with amplitude in excess of 10 m for at least tens of km. As shown by Reference Gudmundsson, Raymond and BindschadlerGudmundsson and others (1998), ice streams act as a bandpass filter because only bedrock bumps with specific horizontal dimensions influence relief of surface flow stripes in an effective way. If isostatic compensation of surface topography is indeed an important factor in determining long-term survivability of ice-base roughness in ice streams, the occurrence of long and high-relief MSGLs may also be tied to the occurrence of the same size of bedrock bumps.
4.2. Geophysical observations of contemporary ice-stream beds
We can appeal to observations of basal roughness beneath existing ice streams, to see if ice-stream bases exhibit roughness at the appropriate scale. Siple Coast ice streams flowing into the Ross Ice Shelf, West Antarctica, have been the focus of glaciological and geophysical investigations for the last several decades. Whilst ice surface topography and morphology is known in relatively fine spatial detail, ∼100 m (e.g. Reference JoughinJoughin and others, 1999; Reference Liu, Jezek and LiLiu and others, 1999), the topography of the ice bed is mostly known at spatial scales that are one to two orders of magnitude coarser (Reference Fahnestock, Bamber, Alley and BindschadlerFahnestock and Bamber, 2001). Such coarse resolution is not sufficient to directly investigate the roughness of the ice bed at scales similar to those which characterize the spacing and width of typical MSGLs and associated bedforms, 102–103 m. Insufficient vertical resolution of the bed topography data is another reason why it is still not possible to use these data directly to evaluate the relationship between highly elongated bedforms and modern ice streams. The errors associated with existing surveys of ice-bed elevation (tens of metres (Reference Retzlaff, Lord and BentleyRetzlaff and others, 1993, table 1)) are larger than the typical amplitudes of MSGL.
Evidence of the geometry of ice-stream beds at the spatial scales relevant to our discussion is provided by the high-resolution seismic images collected in the 1980s by the University of Wisconsin ice-geophysics group (e.g. Reference Blankenship, Bentley, Rooney and AlleyBlankenship and others, 1986, Reference Blankenship, Bentley, Rooney and Alley1987; Reference BentleyBentley, 1987; Reference Rooney, Blankenship, Alley and BentleyRooney and others, 1987). In Figure 7 we reproduce traces of the ice-bed and till-bottom reflectors as defined by Reference Rooney, Blankenship, Alley and BentleyRooney and others (1987) for two seismic lines run perpendicular to the ice-flow direction in the Upstream B (henceforth UpB) camp area on the upper reaches of Ice Stream B. The two seismic lines were separated by ∼350 m and they both began just outside of the crevassed area associated with the southern margin of the ice stream (Reference Rooney, Blankenship, Alley and BentleyRooney and others, 1987, fig. 1). Vertical resolution of this survey in the weak till layer was about 2.5 m. The reflection from the bottom of the till shows variability that is greater than the level of this error. The fact that some of the same features can be recognized in both of the closely spaced lines strongly suggests that we are looking at real features and not random variability. The trace of the till bottom shows undulations with a magnitude of a few to several metres and transverse wavelengths of ∼100 m to a few kilometres. The ice bed shows less variability but does have one relatively large feature centred on the 5 km marker. The relative amplitude of this feature is ∼10 m and its transverse wavelength is a few km. It is worth noting here that the seismic work at UpB as well as an analogous survey in the downstream area of Ice Stream B (DnB) (Reference RooneyRooney, 1988) indicate perceptibly less variability of ice-bed and till-bottom geometry in lines shot along the ice-flow direction than transverse to it. Overall, the seismic data of Reference Rooney, Blankenship, Alley and BentleyRooney and others (1987) and Reference RooneyRooney (1988) are consistent with the existence of basal roughness that is elongated in the ice-flow direction, have amplitudes of at least several metres and transverse spacing of ∼100 to ∼1000 m.
Geophysical observations beneath Ice Stream B reveal bed roughness at the appropriate scale. Trace of ice bed (thick line) and till bottom (thin line) from high-resolution seismic surveys discussed by Reference Rooney, Blankenship, Alley and BentleyRooney and others (1987). Vertical axes are expressed in two-way travel time. On the left, we provide two vertical scales which translate the travel times into distances in ice (compressional wave velocity of 3800 m s−1) and in till (compressional wave velocity of 1700 m s−1) (Reference Blankenship, Bentley, Rooney and AlleyBlankenship and others, 1987). We interpret the till base roughness to indicate that keels have carved grooves into the underlying sedimentary substrate, and that till now occupies these grooves. At the time of imaging, these grooves are antecedent and do not match the basal roughness in the ice.

The seismic data of Reference Rooney, Blankenship, Alley and BentleyRooney and others (1987) can be placed into a broader spatial context thanks to local availability of very high-resolution bed topography from radar surveys (Reference Novick, Bentley and LordNovick and others, 1994, fig. 6). From their map, it becomes clear that the prominent bump in the ice at 5 km represents a cross-section of an elongated ice keel ∼10 km long, ∼1 km wide and with an amplitude of up to 10 m.
Although other geophysical data collected over the Siple Coast ice streams provide lower spatial resolution than the seismic surveys described above, they do contain some indication of variability in ice-stream bed properties at spatial scales similar to those of MSGL. A particularly good example comes from a seismic survey performed in the DnB area of Ice Stream B and discussed by Reference Atre and BentleyAtre and Bentley (1994). The results of this survey are interpreted as being indicative of the presence of basal stripes which are roughly parallel to the flow and are 0.5–5 km wide (Reference Atre and BentleyAtre and Bentley, 1994). Another piece of evidence indicating stripe-like patterns in bed properties beneath Ice Stream B comes from the high-resolution radar surveys performed in the UpB area (Reference Novick, Bentley and LordNovick and others, 1994, fig. 8). In this case, the strength of the radar reflection from the base can be seen varying transverse to the flow with wavelength of a few kilometres while showing no clear variations along the flow direction. These stripes were interpreted by Reference Novick, Bentley and LordNovick and others (1994, p.152) as representing “real changes in bed characteristics that are dragged along by the ice movement”.
Aerial photograph illustrating part of the MSGL field in North Dakota. The prominent ridge in the southwest corner extends for >22 km, and parallel to it are numerous smaller ridges and grooves. We interpret broad ice keels carving grooves and squeezing sediment up into ridges. Image is centred on 48°05′ N, 100°40′ W.

As demonstrated above, initial results from physically based modelling indicate keel survival, and some geophysical observations beneath ice streams record bumpy ice beds and till surfaces at the appropriate scale. We take this as ample indication that basal roughness can survive downstream propagation, and await further evidence or modelling to better understand this process.
5. Groove-Ploughing Predictions
In order to facilitate evaluation or falsification of the groove-ploughing hypothesis, we make predictions of the nature of the ice-stream base and the geomorphology that should arise from groove ploughing and may be preserved in the record of ice-stream footprints.
-
1. MSGL should only occur downstream of regions in which ice basal-roughness elements are produced. Although we primarily expect basal roughness of the ice to be produced from contact with bedrock, other mechanisms may also exist that can generate appropriate bumps. Strong flowline convergence, for example, may produce subvertical shear planes within the ice mass, producing an uneven ice base.
-
2. Transverse roughness of the ice base and geomorphology should greatly exceed roughness in the longitudinal direction.
-
3. Transverse groove spacing should be related to the spatial frequency of upstream bedrock roughness.
-
4. Transverse spacing of grooves should change in proportion to the amount of convergence of the ice stream. In the wider convergence zone of the ice stream, spacing should be greater than in the main trunk zone.
-
5. When ice keels plough through underlying sediment, they will be susceptible to a reduction in size, so we expect the resultant groove depth and width to lessen in a downstream direction. Under conditions of fast flow velocities and weak sediments, keel degradation may be minimal such that grooves maintain a nearly constant geometry downstream. This may be exacerbated by a “pressure bow wave” effect whereby increased pressure in front of keels raises pore-water pressures, further weakening sediment strength and prolonging the life of keels. So we predict that the amplitude of basal roughness should either stay constant or decrease in the downstream direction.
-
6. Sediment discharge from ice-stream termini should reflect the volume of sediment carved out by the grooving process.
-
7. Sedimentary structures may be preserved in between grooves, and in the cores of ridges, but shearing and glaciotectonic structures may occur close to the groove interface. Material squeezed laterally into intervening ridges may show evidence of deformation, and till-fabric (macro and micro) analysis may record lateral flow of sediment into the ridges.
-
8. The shear strength of till should determine the form of MSGLs. For the wet and slippery (easily deformed) case, in addition to grooves, till should have been squeezed laterally and upwards into intervening high points producing ridges. For the drier and stronger tills, it may be that only keel ploughing occurs, and that lateral mobilization is minimal. In these cases, we would expect just grooves cut into a planar surface, with no intervening ridges. Subglacial cavities may well have existed during this process, with the potential for movement of water and fluvial sedimentation processes.
-
9. When ice keels pass downstream from grounded ice, through the grounding line to floating ice, we predict that ice keels and MSGLs could show a sharp transition in planform shape. The exactly straight and parallel grooves may show a discordance at the grounding line, and as floating ice is less laterally constrained, there may be some sinuosity and directional shifts in groove pattern downstream from here.
-
10. If basal roughness in the ice is preserved for the whole distance of an ice stream, then the keel structures should propagate into the proximal reaches of floating ice shelves.
Some of these predictions provide sharper tests than others, 1, 2, 3, 4, 5, 7, 9 are the most powerful, and in particular we await observations of the morphology of ice-shelf bases (prediction 10) immediately distal to active ice streams, because such observations are likely to be made over the next 5 years.
6. Observational Tests of the Hypothesis
True verification can only occur once geophysical observations can be made at sufficient resolution and with large enough spatial coverage to observe the process in operation. Until this time, we rely on the limited number of observations from contemporary ice streams, and focus on the geomorphological record of known palaeo-ice streams. We have examined all known data and observations on MSGL (Reference LemkeLemke, 1958; Reference Bluemle, Lord and HunkeBluemle and others, 1993; Reference ClarkClark, 1993, Reference Clark1994; Reference EvansEvans, 1996; Reference DaviesDavies and others, 1997; Reference Longva and ThorsnesLongva and Thorsnes, 1997; Reference Shipp, Anderson and DaviesShipp and Anderson, 1997; Reference Rise, Sættem, Fanavoll, Thornes, Ottesen and BøeRise and others, 1999; Reference Shipp, Anderson and DomackShipp and others 1999; Reference Canals, Urgeles and CalafatCanals and others, 2000; Reference Clark, Knight and GrayClark and others, 2000; Reference Shaw, Faragini, Kvill and RainsShaw and others, 2000; Reference Clark and StokesClark and Stokes, 2001; Reference Polyak, Edwards, Coakley and JakobssonPolyak and others, 2001; Reference Wellner, Lowe, Shipp and AndersonWellner and others, 2001) and compare these to the predictions outlined above.
In Figure 2, all known examples of MSGLs are plotted, and we note that, in every case, exposed bedrock exists immediately upstream of their occurrence (prediction 1). For cases in Canada, this has been determined by reference to the surficial map of Canada (Reference FultonFulton, 1995) which locates areas of drift cover and exposed bedrock. For the examples surrounding Antarctica, Reference Shipp, Anderson and DaviesShipp and Anderson (1997), Reference Shipp, Anderson and DomackShipp, and others (1999), Reference Canals, Urgeles and CalafatCanals, and others (2000) andReference Wellner, Lowe, Shipp and AndersonWellner and others (2001) all describe crystalline bedrock immediately upstream of the MSGL, and Reference Longva and ThorsnesLongva and Thorsnes (1997) describe the same for the Norwegian example. It remains to be established if there is sufficient roughness in the bedrock and at the appropriate wavelengths for MSGL production (prediction 3).
In North Dakota, U.S.A., in between the towns of Velva and Drake, a small field of MSGLs exists covering an area of just 400 km2, recording ice flow towards the southeast. The lineations exhibit lengths of up to 20 km and elongation ratios of around 60 : 1, and early investigations reveal them to be steep-sided and angular in appearance with heights of 2–25 m (Reference LemkeLemke, 1958). A small part of this field is illustrated in Figure 8, where it is easy to envisage grooves of varying widths, which have pushed sediment up into much narrower intervening ridges. Preliminary investigation of the composition of these landforms (Reference LemkeLemke, 1958) indicates that the area is mostly of stratified sands and gravels, but with till flanking the sides and tops of the ridges. This composition is exactly as might be expected arising from groove ploughing, whereby keels carve into the pre-existing stratified sediment, and till is squeezed up into high points between the keels (prediction 7). Furthermore, in a cut section across one of the ridges, Reference Bluemle, Lord and HunkeBluemle and others (1993) report deformation and thrust structures that have resulted in the bedding being inclined away from the axis of the ridge, and they conclude that the material was emplaced laterally by squeezing from adjacent grooves into the ridge. This accords well with the groove-ploughing prediction of lateral squeezing of sediment as a keel passes through the system. However, the authors do not interpret it in this way and prefer to invoke a basal cavity where the ridge now resides, into which sediment was squeezed. Immediately upstream of the lineations is a large bend in the Souris River which lies orthogonal to the ice-flow direction. It is presumed that as ice traversed this major valley, the roughness of the ice base was generated (prediction 1) from undulations in the valley flanks. The groove system runs for at least 40 km down-ice from here.
On the continental shelf, north of the Antarctic peninsula, marine geophysical investigations (reported in Reference Canals, Urgeles and CalafatCanals and others, 2000) discovered a remarkable ice-stream imprint that we regard as the best record of an ice-stream bed yet revealed. This palaeo-ice stream was around 100 km long and 25 km wide, and is thought to have drained ice from the north Antarctic Peninsula during retreat from the Last Glacial Maximum, when ice cover was much more extensive than today. Figure 9 displays visualizations of the swath bathymetry data, in which the nature of the MSGLs and the appearance of ridge–groove structures are clearly seen. Individual grooves can be traced for the length of the ice stream, and overall the pattern displays the converging flow and abrupt margins that are characteristic of ice streams (cf. Reference Stokes and ClarkStokes and Clark, 1999, Reference Stokes and Clark2001). Seismic investigation (Reference Canals, Urgeles and CalafatCanals and others, 2000) reveals that the sea-floor is covered in a drape, presumed to be postglacial hemipelagic sediments, and that for most of the area this drape closely mirrors the morphology of the underlying corrugated till surface. With a small degree of uncertainty, we can thus treat the bathymetric data as recording the morphology of the ice-stream bed, and perform measurements of groove dimensions and relief.
Visualizations of the submarine bed imprint of the Western Bransfield Basin palaeo-ice stream (cf. Reference Canals, Urgeles and CalafatCanals and others, 2000). (a) Three-dimensional overview of the ice stream and its topographic setting (water depths 1500–150 m). (b) Enhanced view of the geomorphologic imprint illustrating groove structures. Simulated solar shading from the west. Note how some of the grooves pinch out within the first third of the ice stream, whilst others extend the whole length. The images are constructed from Simrad EM12S swath bathymetry data, resampled to a 50 m grid.

The furrowed surface (Fig. 9) records grooves and ridges up to 100 km long, but with many of the features pinching out over distances of 30 km. Wavelength data were acquired by extracting 13 topographic profiles positioned orthogonal to ice flow and at approximately equal distances downstream. After detrending, these profiles were subjected to spectral analysis to reveal the dominant wavelengths. From these data, wavelengths were found to vary between 451 and 705 m, with an average of 625 m (transect distance sampled ∼100 km). Amplitudes were measured for seven of the transects, yielding an average ridge–groove amplitude of 14 m with a minimum of 2 m and a maximum of 60 m.
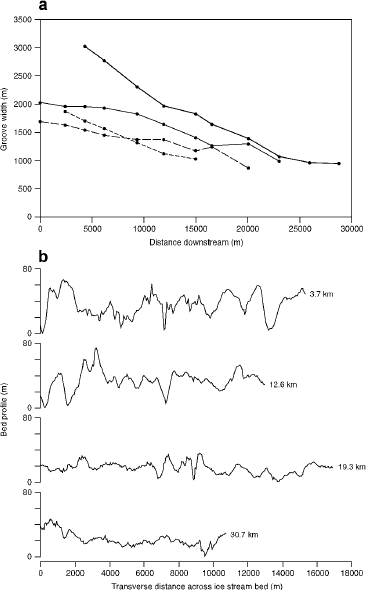
Examination of the visualizations of the bed topography (Fig. 9) reveals that many of the grooves decrease in width and depth downstream and gradually disappear. For four of the easier-to-measure and wider grooves, Figure 10a demonstrates systematic groove narrowing in the downstream direction (prediction 5). Reduction in groove depth is illustrated in Figure 10b, where it can be seen that bed amplitude decreases downstream (prediction 5).
Downstream change in groove morphology. Measurements extracted from swath bathymetry data of the Western Bransfield Basin palaeo-ice stream (Fig. 9). (a) Measured groove width plotted against distance downstream. In accordance with predictions from groove-ploughing theory, individual grooves progressively narrow downstream as the ice keels become degraded in size. (b) Bed elevation profiles transverse to ice flow, at four distances downstream. As predicted, bed amplitude is found to decrease downstream. Graph is vertically exaggerated by 46.
Oil and gas exploration in the Skagerrak trough, immediately offshore of the south coast of Norway (Fig. 2), has revealed a suite of MSGLs at 500 m depth (Reference Longva and ThorsnesLongva and Thorsnes, 1997, fig. 3.14b). These were produced by the Norwegian Channel palaeo-ice stream (Reference Sejrup, Larsen, Landvik, King, Haflidason and NesjeSejrup and others, 2000). Multibeam echo sounder imagery indicates that the MSGLs exhibit an amplitude of around 10 m (Reference Rise, Sættem, Fanavoll, Thornes, Ottesen and BøeRise and others, 1999), wavelengths of 100–300 m and lengths of >20 km. Figure 11 illustrates their nature, and what is remarkable is that in the downstream direction their geometry changes from straight and parallel lineations, typical of MSGL, into sinuous and occasionally cross-cutting groove structures typical of iceberg ploughmarks. This is of great diagnostic value as the distal structures are unequivocally produced by groove ploughing as evidenced by their resemblance to iceberg ploughmarks (e.g. Reference Dowdeswell, Villinger, Whittington and MarienfeldDowdeswell and others, 1993; Reference DaviesDavies and others, 1997) and the fact that individual grooves dissect earlier-produced structures (see Reference Rise, Sættem, Fanavoll, Thornes, Ottesen and BøeRise and others, 1999, fig. 6). These sinuous grooves are directly trace-able to the upstream MSGL (Fig. 11), thus demonstrating that the primary mechanism for MSGL production is by groove ploughing, rather than amplification of relief solely by some form of accretion or deformation into upstanding ridges. Individual grooves extend for at least 45 km, and the abrupt change from linear to sinuous after 20 km is interpreted as recording the grounding-line position of the ice stream. Keels at the ice-stream base ploughed and deformed the till into MSGL, and the ice keels survived to beyond the grounding line where floating ice was less constrained laterally within an ice shelf, or as large icebergs, and permitted groove ploughing to continue but in a more sinuous manner. These findings satisfy prediction 9. By tracing the MSGLs upstream it is apparent that individual grooves can be observed emanating from specific bedrock roughness elements (personal communication from D. Ottesen, 2001), further supporting prediction 1.
MSGLs of −20 km length, found in the Skagerrak trough, immediately offshore of the south coast of Norway. Flow is towards the west-southwest. After 20 km, the perfectly straight geometry of the MSGLs abruptly changes to a sinuous and occasionally cross-cutting pattern. This break is interpreted as the former grounding line, whereupon ice keels producing the groove ploughing became less laterally restricted in floating ice. (a) MSGL grading into classical iceberg ploughmarks. Simulated solar shaded rendition of multibeam echo sounder data. Image is ∼48 km across. Ship track lines are visible, oriented northeast–southwest. (b) Groove structures mapped from above image illustrating dramatic change in geometry. (c) Oblique visualization of data, viewed in the downstream direction, showing change in groove pattern across the grounding line.

For the first time (Reference Polyak, Edwards, Coakley and JakobssonPolyak and others, 2001), MSGLs have been discovered on a submarine rise in the Arctic Ocean (Fig. 12). These must have been produced by localized grounding of a thick ice shelf and not by iceberg ploughing, as they occur at water depths of nearly 1000 m. Grounded ice was restricted to the crest of the rise, with floating shelf ice surrounding it, and thus the subglacial system was effectively open. This setting excludes formative theories that require confining pressures to permit build-up of high pore-water pressures in basal sediments, leading to sediment deformation (e.g. Reference Boulton, Menzies and RoseBoulton, 1987; Reference HindmarshHindmarsh, 1998a, Reference Hindmarshb). Production by floodwater discharges (e.g. Reference Shaw, Faragini, Kvill and RainsShaw and others, 2000) is also excluded as they were formed in the deep ocean. Rather it is easier to envisage that roughness at the base of the ice shelf simply impinged on the submarine rise carving the observed grooves. This is supported by an indication from the chirp-sonar record (Fig. 12b) and discussion in Reference Polyak, Edwards, Coakley and JakobssonPolyak and others (2001), that the grooves are erosional in nature. Truncation of strata at the summit of the rise indicates >50 m of erosion, and downstream from here a 20 m thick lens of sediment that descends down the flank appears to be reworked debris arising from the erosion of the grooves. These observations considerably favour the groove-ploughing theory and provide strong evidence for bedform production by an erosional mechanism.
MSGLs at least 20 km long, discovered by geophysical observations from a nuclear submarine beneath Arctic ice cover (Reference Polyak, Edwards, Coakley and JakobssonPolyak and others, 2001). These are located on the Lomonosov Ridge (87° N, 145° E) in water depths of nearly 1 km, and were produced by localized grounding of a thick Arctic ice shelf. (a) Swath sonar image illustrating MSGLs positioned along the crest of the rise; (b) chirp-sonar image illustrating morphology of the rise, position of the erosional grooves, and downstream lens of draped sediment that is interpreted as a lobe of debris derived from erosion of the surface and the grooves. Water depths as indicated.

7. Discussion
7.1. Plausibility of groove ploughing
Given that initial modelling indicates that basal roughness in ice can survive downstream propagation, and that we have demonstrated examples of basal roughness at the appropriate scale beneath Antarctic ice streams, then the groove-ploughing hypothesis can be regarded as physically plausible. Half of the predictions arising from groove ploughing are validated by observations of the geomorphology and geology of now-exposed ice-stream beds. Of particular note are that all occurrences of MSGL lie distal to exposed bedrock, that grooves are found to shallow and narrow downstream, that MSGLs are found to grade downstream into groove structures that resemble classical iceberg ploughmarks, and that grooves have been eroded from a submarine rise and the resultant sediment found immediately downstream. Based on observations presented in this paper, we conclude that MSGLs are formed by erosion and moulding by roughness elements in the ice base.
One of the most difficult aspects for any theory of how subglacial bedforms are generated is the initial amplification of relief. Once abumpy till surface has been created, it is easy to understand how the upstanding elements can be streamlined or drumlinized to produce the characteristic shapes. Most theories of bedform creation are weak or have no explanation of how the relief is created from a flat till surface. Reference HindmarshHindmarsh (1998a, Reference Hindmarshb) provides an exception to this and explains relief amplification by a kinematic wave instability that may arise when ice and (viscous) till flow are coupled. The strong appeal of the groove-ploughing theory is that relief amplification is so readily explained: it is simply inherited from the ice bumpiness, which in turn is inherited from the natural bumpiness of bedrock surfaces. There is no requirement for the till to behave viscously, which has been a recent source of debate (Reference HindmarshHindmarsh, 1997; Reference MurrayMurray, 1997; Reference Tulaczyk, Kamb and EngelhardtTulaczyk and others, 2000a, Reference Tulaczyk, Kamb and Engelhardtb, Reference Tulaczyk, Scherer and Clark2001).
7.2. Relationship to other subglacially produced bed-forms
MSGLs have been previously regarded as the largest in a family of subglacial bedforms that includes drumlins, flutes and ribbed (rogen) moraine (Reference ClarkClark, 1993). As MSGLs are formed by the process outlined above, then what of these other distinctive types? As mentioned earlier, the toughest problem is the amplification of relief from a presumably flat till surface. We speculate that MSGL may be the most important, “seeding” stage of bedform production (i.e. relief amplification) which can then be modified by subsequent ice flow. It may be that once the bed has been moulded into the strongly furrowed morphology, subsequent ice flow locally deforms sediments such that the original MSGL pattern is gradually broken down into a less coherent structure. After enough elapse of time and with localized sediment deformation, till transport and streamlining, the end result may be that of a drumlin field whereby stronger parts of the ridges have become drumlin cores. Groove ploughing might therefore be the first part of the answer to the long-standing drumlin problem.
7.3. Implications for ice-stream functioning
Ice streams still present something of an enigma with regard to how they function. Firstly, in spite of low surface slope and driving stress, they are observed to flow at fast velocities (e.g. for Ice Stream B, a driving stress of only 15 kPa produces speeds of 800 m a−1; Reference Whillans, Bentley, van der Veen, Alley and BindschadlerWhillans and others, 2001). This is explained by efficient lubrication at the ice base, and/or extremely weak tills that shear and deform. Given this, the second mystery is what supports the downstream weight of ice streams and regulates their flow to within current bounds (i.e. stops them flowing faster)? Reference Kamb, Alley and BindschadlerKamb (2001) and Reference Raymond, Echelmeyer, Whillans, Doake, Alley and BindschadlerRaymond and others (2001) provide a good synthesis of this problem. Ice-stream weight must be balanced by forces of drag from the bed, from the margins and via longitudinal forces within the ice stream. As it is known that the latter are minimal (Reference Raymond, Echelmeyer, Whillans, Doake, Alley and BindschadlerRaymond and others, 2001), resistive drag from friction at the bed and the shear margins of ice streams is the main candidate.
Our understanding of the resistive drag of ice streams, developed during the 1980s, was based around the concept that the underlying till behaved as a viscous fluid (Reference Alley, Blankenship, Bentley and RooneyAlley and others, 1986, Reference Alley, Blankenship, Bentley and Rooney1987; Reference Boulton and HindmarshBoulton and Hindmarsh, 1987). The viscous till model assumed that the gravitational shear stress, which drives ice-stream motion, is fully balanced by the basal shear stress arising during viscous till deformation (Reference Alley, Blankenship, Bentley and RooneyAlley and others, 1987). Thus, ice-stream velocity was thought to be fully determined by the magnitude of driving stress, till thickness and its viscosity. Since this time, it has been realized that side drag from the slower-moving adjacent ice can contribute a large part of resistance (typically 50% according to Reference Raymond, Echelmeyer, Whillans, Doake, Alley and BindschadlerRaymond and others, 2001). In addition, the viscous till model may be inappropriate. Experimental and modelling investigations (cf. Reference Tulaczyk, Kamb and EngelhardtTulaczyk and others, 2000a, Reference Tulaczyk, Kamb and Engelhardtb; Reference Kamb, Alley and BindschadlerKamb, 2001) indicate that till does not behave viscously, but with a plastic rheology, with the corollary that basal resistance to ice motion is not dependent on ice velocity. This has far-reaching implications with regard to the regulation and stability of ice streams. Although still hotly debated (Reference HindmarshHindmarsh, 1997; Reference MurrayMurray, 1997; Reference Tulaczyk, Kamb and EngelhardtTulaczyk and others, 2000a, Reference Tulaczyk, Kamb and Engelhardtb, Reference Tulaczyk, Scherer and Clark2001), if till does behave plastically at the scale of ice-stream beds, there are a number of problems with our understanding of ice-stream functioning with regard to their underlying soft beds. These are addressed below and we propose that a bumpy ice base and the groove-ploughing mechanism reconcile many of these.
In order to understand why ice streams do not flow faster than they do, there has been a search for components responsible for resistive drag. As mentioned earlier, it has recently been realized that side drag is a major component. Another proposed mechanism was “sticky spots” (Reference AlleyAlley, 1993) in the basal till (possibly controlled by lower porewater pressures) which act as resistive patches that could, in part, support the downstream weight of ice streams. If till behaves plastically, then this idea is less appropriate, and we are left with the problem of how weak tills can provide enough resistive drag to balance the force budget. Groove ploughing may be part of the answer. Firstly, a bumpy ice base presents a greater surface area and hence frictional drag in the case of basal sliding across till. More importantly, in our model, we expect larger ice keels to penetrate through the till layer into the stronger underlying substrate (Fig. 4). Such ice keels dragging through unlithified older glacial or glaciomarine sediments typical of Antarctic ice streams would thus provide greater resistance to ice motion. If enough keels of ample size exist, or the till is thin enough, it may be that resistive drag by this means is sufficient to play a part in regulating ice-stream velocity and stability.
If, as Reference Raymond, Echelmeyer, Whillans, Doake, Alley and BindschadlerRaymond and others (2001) suggest, side drag is the dominant resistive force on Siple Coast ice streams (typically 50% and up to 100%), and bed drag is subservient to this, then this may impose a control on potential ice-stream width. If well lubricated at the bed, a steady-state ice stream (i.e. not a transitory surge) cannot widen any further because bed drag is not sufficient to support it. This implies a physical limit to ice-stream width. The groove-ploughing mechanism, however, may exert basal drag under ice streams of any width. It might therefore be possible to have wider ice streams where basal drag by groove ploughing is the dominant resistive force and margin drag much less so. Thus, there may be no limit to the width of ice streams other than those imposed by underlying (streaming-susceptible) geology and ice catchment area. Indeed it is remarkable that the palaeo-examples so far discovered are often much wider than all known Antarctic ice streams. The Dubawnt Lake palaeo ice stream in Arctic Canada, for example, has a width of 140–200 km (Reference StokesStokes, 2000; Reference Stokes and ClarkStokes and Clark, 2003), compared with Siple coast ice streams which are of the order of 30–80 km wide (Reference Raymond, Echelmeyer, Whillans, Doake, Alley and BindschadlerRaymond and others, 2001). The Dubawnt Lake ice stream has well-defined MSGL (see Fig. 1). We speculate that the groove-ploughing process permitted it to grow so wide and play such an important role in deglaciation of the Laurentide ice sheet. These ideas have important implications for ice-sheet stability, as they suggest that, given the appropriate conditions, ice streams may grow substantially in width and dramatically increase in ice discharge.
If an ice stream is to operate in steady-state, and till is a crucial lubricating agent, then sediment discharged from the system must be replaced. So how does till replenish itself such that ice streams may function for long periods of time? In the viscous till model, it was assumed that the mobile deforming layer actively eroded and incorporated material from the underlying sediments. If pervasive viscous deformation to the depth of till thickness does not occur (recent arguments favour only a thin deforming layer), then we have lost the mechanism of till replenishment. As argued above, in the groove-ploughing model it is expected that large keels will erode into underlying sediments (Fig. 4), and herein lies a means of acquiring new lubricating sediment to sustain ice flow and generate the widespread tills that are observed. Reference Tulaczyk, Scherer and ClarkTulaczyk and others (2001) estimated the rate of erosion that is required for keels to maintain steady state and concluded that it is comparable with bedrock erosion rates underneath a surging glacier.
One of the appeals of the viscous till model is that it has successfully explained much that is observed in the geological record. The model predicts high sediment flux, because a significant depth of the deforming till is constantly mobile. Where geological evidence has revealed large sediment volumes, such as trough mouth fans on continental shelves (Reference ElverhøiElverhøi and others, 1995; Reference King, Haflidason, Sejrup and LøvlieKing and others, 1998), these have been used to invoke viscous sediment deformation as the conveyor. This association is no longer necessary, as we can drop the assumption of viscous rheology and yet still maintain high sediment fluxes by the groove-ploughing mechanism. When basal roughness elements plough through till, mobilization will occur laterally away from the compressional zone in front of the keel and into the zone of extension behind it. The net result of this localized deformation is downstream till transport. Whilst unlikely to arise in such high estimates of till transport as by pervasive deformation, groove ploughing with its localized deformation predicts high sediment discharge from ice streams (e.g. ∼88 m3 a−1 per metre width of ice stream, as estimated in Reference Tulaczyk, Scherer and ClarkTulaczyk and others, 2001). The process of till flow around ice bumps generates a viscous-like distribution of deformation in a plastic till (Reference Tulaczyk, Mickelson and AttigTulaczyk, 1999), and this may explain many of the geological observations of deformed tills.
8. Summary and Conclusions
Where found, MSGLs can be taken as reliable indicators of former ice-stream activity. We propose that large-scale roughness elements in basal ice are responsible for their formation. Bumps in the ice base are generated by ice contact with bedrock and are then transported downstream onto weak tills. The groove-ploughing process carves elongate grooves and deforms sediment up into intervening ridges. The plausibility of this mechanism comes from consideration of ice physics and numerical modelling which indicate that basal roughness can survive downstream flow beneath ice streams. Our modelling indicates that in addition to bedrock protuberances shaping the ice base, it may be required that the ice-stream surface is shaped into longitudinal ridges and depressions (flow stripes) which exert a control on the survivability of basal ice roughness. Geophysical observations beneath Antarctic ice streams affirm that basal roughness at a scale appropriate for MSGL production exists.
A range of predictions are made relating to the nature of the ice-stream base, and the consequent geomorphology that groove ploughing should produce. Observations from palaeo-ice-stream imprints are reported, which fail to falsify the hypothesis and provide significant validation of the proposed mechanism. On the basis of these, we conclude that MSGLs were produced by the groove-ploughingmechanism. Future challenges lie in attempting to verify or falsify this theory. Particular attention could be directed at observing whether the proximal parts of ice shelves exhibit basal roughness, whether bedrock roughness in onset zones matches the scale of variation of downstream MSGL, and whether sedimentary indicators of strain (e.g. till fabric) match that predicted by lateral deformation away from grooves.
The groove-ploughing mechanism has far-reaching implications for our understanding of ice-stream mechanics, and we argue that it resolves a number of existing problems. Given weak and easily deformed sub-ice-stream tills, there has been uncertainty as to how enough basal drag can be generated to regulate flow velocities to those that are observed. The answer may lie with ice keels penetrating through the till layer into stiffer sediment beneath, providing frictional drag that may be sufficient to regulate ice-stream velocity. Furthermore, as we now have a means of providing effective basal drag, this implies that there is less dependence on side drag and therefore that ice-stream widths are less constrained by this factor. With groove ploughing providing basal drag, ice streams may therefore grow to widths much greater than currently experienced in Antarctica. We speculate that it is this mechanism that permitted palaeo ice streams to reach great widths (∼140–200 km) and play such an effective role in rapid deglaciation of the great mid-latitude ice sheets. If so, this mechanism has important implications for the stability of contemporary ice sheets, because ice-stream width (and discharge) could increase.
In light of the existing uncertainty with regard to a flow law for till (viscous vs plastic), we note that groove ploughing does not require till to behave with a specified rheology. A major problem in the rheology debate is that ice streams are known to discharge large volumes of sediment, and presumably must continually replenish the bed with newly acquired material. Groove ploughing provides the means both to acquire new sediment (keel erosion into underlying sediments) and to transport large volumes downstream (localized deformation around keels results in a net downstream flux).
We do not suppose that groove ploughing always occurs under ice streams, but that on occasions, under the appropriate conditions, it plays a crucial role in producing resistive drag to support the downstream weight of ice. It may enable ice streams to widen under steady-state conditions. The mechanism explains landforms produced beneath ice streams and high sediment discharge from them, and does not require the till to deform viscously.
Acknowledgements
We are grateful to L. Polyak and D. Ottesen for useful discussions and for allowing us to use their data on submarine occurrences of MSGL. The Royal Society enabled C.D.C. to travel to the International Union for Quaternary Research (INQUA) Drumlin Symposium in Poland, where this work was first presented. M.C. acknowledges support from the Spanish COHIMAR (ref. REN2000-0896/ANT) and the joint U.S.A.–Spanish GEMARANT (ref. 99120) research projects. The Consolidated Research Group on Marine Geosciences is funded by the autonomous Catalan government. Grants from the U.S. National Science Foundation (OPP-0096302 and EAR-9819346) supported the involvement of S.T. in this research. Comments provided by J. Kleman, T. Murray, M. Sturm and R. Ferguson are gratefully acknowledged.



