I. INTRODUCTION
Ni-based single crystal superalloys are widely used in manufacture of aero engines turbine blades due to their excellent high temperature performance. Reference Reed, Tao and Warnken1–Reference Sato, Yeh, Kobayashi, Yokokawa, Harada, Murakumo and Zhang6 Microstructural stability during thermal exposure plays a very important role in controlling the mechanical properties of Ni-based single crystal superalloys, which includes the precipitation of topologically close-packed (TCP) phase and the stability of γ′ phase. In the third generation superalloys, the total amount of refractory elements reaches up to 20 wt%. Therefore, it is likely that these refractory elements are prone to enrich in the local area of γ matrix leading to the precipitation of TCP phase which will cause decrease in high temperature performance. Reference Rae and Reed7–Reference Walston, O'Hara, Ross, Pollock, Murphy, Kissinger, Deye, Anton, Cetel, Nathal, Pollock and Woodford11
Re, W, Mo, and Cr are four necessary alloying elements in Ni-based single crystal superalloys. Among them, Re, W, and Mo as solution strengthening elements play a significant role in high temperature mechanical properties, Reference Sato, Harada, Yen, Kawagishi, Kobayashi, Koizumi, Yokokawa, Zhang, Reed, Green, Caron, Gabb, Fahrmann, Huron and Woodard12–Reference Nathal and Ebert22 and Cr could greatly improve high temperature oxidation and corrosion resistance. Reference Walston, Cetel, Mackay, O'Hara, Duhl, Dreshfield, Green, Pollock, Harada, Howson, Reed, Schirra and Walston5,Reference Chen, Zhao, Feng, Cao and Sun23–Reference Caron and Khan26 In the third generation alloys, the microstructural stability significantly decreases with increasing Re content. To improve the microstructural stability, Ru is introduced into these alloys and its role becomes the key point of research, but the price of Ru is very high leading to sharp increase of the alloy cost. Reference Koizumi, Koguchi, Yokokawa, Kobayashi, Osawa, Kimura and Harada27–Reference Carroll, Feng, Mansfield and Pollock29 Therefore, it is very important to research and understand the effects of Re, W, Mo, Cr and their interaction on microstructural stability for improving microstructure stability, optimizing alloy compositions and reducing alloy cost.
However, up to date, there are few investigations about effect of W, Mo, and Cr on microstructural stability of Re containing single crystal superalloys. In this present study, the effect of these elements and their interaction on γ′ phase morphology and TCP phase precipitation are systematically investigated by changing the contents of Re, W, Mo, and Cr of the experimental alloys.
II. EXPERIMENTAL PROCEDURE
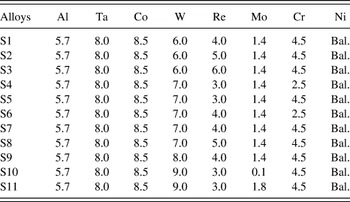
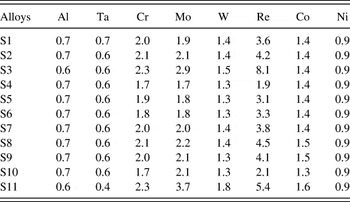
The nominal compositions of the studied single crystal superlloys with different Re, W, Mo, and Cr contents are listed in Table I. The single crystal bars with 7 mm diameter and 80 mm length were produced by a seeding technique in a directional solidification vacuum furnace with a thermal gradient of 250 °C/cm and withdrawal rate of 100 μm/s.
Nominal compositions of eleven kinds of investigated alloys (wt%).

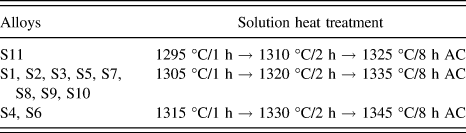
The alloys were subjected to three different solution treatments that are presented in Table II. Thereafter, an aging treatment was performed at: 1170 °C/4 h air cooling (AC) → 870 °C/24 h AC. After solution and aging treatment, thermal exposure was performed at 1000 °C for 100, 200, 500, and 1000 h. Besides, an aging treatment was performed at 1240 °C/4 h → 1140 °C/4 h (cooling rate is 10 °C/h) AC → 870 °C/24 h AC to make γ′ phases grow up to 1 μm or more for ensuring the accuracy and reliability of the data determined by electron probe micro analyzer (EPMA).
Solution heat treatment schedules of eleven kinds of investigated alloys.

The samples were cut perpendicularly to [001] crystallographic growth direction and etched in a solution of 1HNO3:2HF:4C3H8O3. A NETZSCH-STA409CD differential scanning calorimetry (DSC; NetzschGerätebau GmbH, Selb, Germany) was used to determine the liquidus (T l), solidus (T s), and solvus (T γ′) temperature of γ′ phase. Before 1000 °C, the heating rate is 20 °C/min, and then is 15 °C/min from 1000 to 1450 °C. The weight of DSC samples was about 14 mg. Each alloy was tested twice in a purged high-purity argon atmosphere and with high-purity alumina crucibles. A JEOL JAX-8100 EPMA (JEOL Ltd., Tokyo, Japan) was used to analyze the compositions of γ and γ′ phase. The mappings were taken at a 15.0 kV acceleration voltage and 10.0 nA beam current by using a minimum beam size (1 μm) for each point. As analysis crystals, rubidium acid phthalate (RAP) for Al, LiF for Cr, Co, Ni, Ta, and pentaerythritol (PET) for Mo, W, Re were used. To ensure statistically significant mean values, at least five measurements were taken within the γ′ phase and γ matrix. A Tecnai F30 G2 transmission electron microscope (TEM; FEI Company, Eindhoven, The Netherlands) equipped with energy dispersive spectrometer (EDS) was used to identify the TCP phase. To characterize the microstructure of these alloys, a ZEISS SUPRA 55 field emission scanning electron microscope (SEM; Carl Zeiss, Oberkochen, Germany) was used. Furthermore, the mean size and volume fraction of γ′ phase after aging treatment were measured by a quantitative metallographic technique where at least 300 particles were used.
III. RESULTS
A. Microstructure after aging treatment
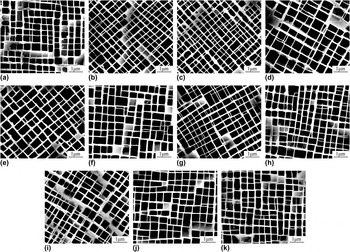
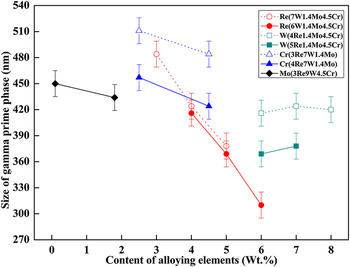
Figure 1 shows the typical microstructures of the studied alloys after aging treatment. It is evident that only γ and γ′ phases are present in the microstructures. The volume fraction of γ′ phase in all alloys falls in 70–75%. Typical cuboidal shape γ′ phase is present in all alloys. These indicate that the content of Re, W, Mo, and Cr have little effect on the γ′ phase morphology and volume fraction in Re containing alloys. However, the average size of γ′ phase changes with increasing the content of alloying elements. The mean sizes of γ′ phase in eleven kinds of alloys are shown in Fig. 2. It can be seen that the size of γ′ in S3 (6Re6W4.5Cr) alloy is the smallest while largest in S5 (3Re7W2.5Cr) alloy. Furthermore, the γ′ size decreases obviously with increasing Re content, and decreases slightly with increasing Cr and Mo content. However, it does not change with respect to W.
Typical microstructures of alloy S1 (a), alloy S2 (b), alloy S3 (c), alloy S4 (d), alloy S5 (e), alloy S6 (f), alloy S7 (g), alloy S8 (h), alloy S9 (i), alloy S10 (j), and alloy S11 (k) after aging treatment.

Plot of γ′ size after aging treatment with alloying elements content.

B. The precipitation of TCP phase during thermal exposure
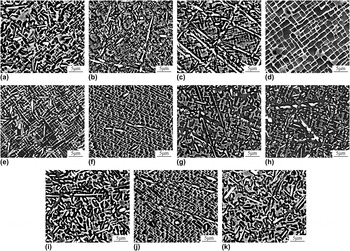
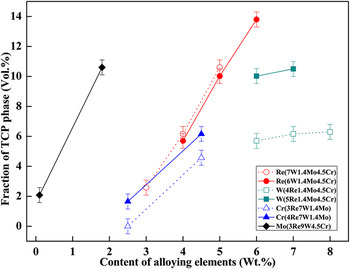
The precipitation of TCP phase during thermal exposure is a very important factor determining in mechanical properties. Reference Reed, Cox and Rae30,Reference Popova, Kuznetsov, Lesnikov, Popov and Konakova31 The precipitation of TCP phase in eleven kinds of alloys after the thermal exposure at 1000 °C for 1000 h is shown in Fig. 3. TCP phase has three different morphologies, namely acicular, rod-like, and blocky shape. The volume fraction of TCP phase after thermal exposure at 1000 °C for 1000 h is shown in Fig. 4. It is evident that S3 (6Re6W4.5Cr) alloy possesses maximum volume fraction while S4 (3Re7W2.5Cr) alloy does not contain any TCP phase. Moreover, the effect of different alloying elements on the TCP phase precipitation can be observed easily. The volume fraction of TCP phase dramatically increases with increasing Re or Mo content. For example, the TCP phase volume fraction of S5 (3Re7W4.5Cr) alloy is only 2.6% and reaches up to 10.6% in S8 (5Re7W4.5Cr) alloy. It is only 2.1% in S10 (3Re9W0.1Mo) alloy and increases to 10.6% in S11 (3Re9W1.8Mo) alloy. It means the volume fraction of TCP phase increases by approximately 4% with increasing 1% Re or Mo content. With increasing Cr content, the volume fraction of TCP phase is also increased. For example, the volume fraction of TCP phase increases from 1.6% in S6 (4Re7W2.5Cr) alloy to 6.0% in S7 (4Re7W4.5Cr) alloy. That means the volume fraction of TCP phase increases by approximately 2.2% with increasing 1% Cr content. It is interesting that the volume fraction of TCP phase is increased slightly with increasing W content. For example, the volume fraction of TCP phase increases from 5.7% in S1 (4Re6W4.5Cr) alloy to 6.3% in S9 (4Re8W4.5Cr) alloy. It indicates that TCP phase increases by only 0.3% with adding 1% W.
Morphology of TCP phase in alloy S1 (a), alloy S2 (b), alloy S3 (c), alloy S4 (d), alloy S5 (e), alloy S6 (f), alloy S7 (g), alloy S8 (h), alloy S9 (i), alloy S10 (j), and alloy S11 (k) after thermal exposure at 1000 °C for 1000 h.

Plot of TCP phase volume fraction after thermal exposure at 1000 °C for 1000 h with alloying elements content.

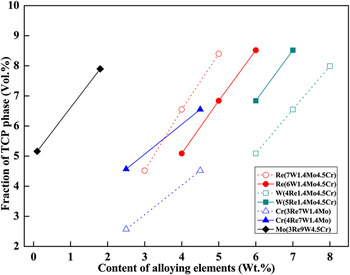
Besides, the TCP phase volume fraction of eleven kinds of alloys at 1000 °C calculated by using thermodynamic software JMatPro is shown in Fig. 5. Compared with measured value of TCP phase volume fraction in Fig. 4, it can be found that: firstly, the increasing trend of TCP phase volume fraction with the increase of Re, Mo, and Cr is coincident with experimental data. However, the calculated result shows that W also dramatically promotes TCP phase precipitation which has a distinct difference with experimental result. Secondly, the calculated data are relatively centralized and the variation amplitude is smaller, which is caused by the element segregation not considered in calculation process of JMatPro. In general, the increasing trends of TCP phase volume fraction measured by experiment are similar to the results calculated by JMatPro except the result about W.
The TCP phase volume fraction of eleven kinds of alloys at 1000 °C calculated using thermodynamic software JMatPro.

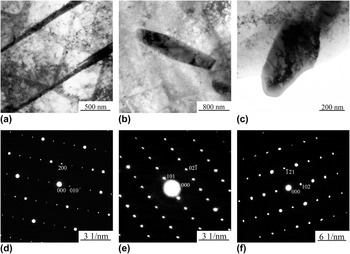
Figure 6 shows the morphology and corresponding selected area diffraction patterns (SADP) of TCP phase of S3, S6, and S9 alloy after thermal exposure for 1000 h. Some acicular-shaped TCP phases with uniform distribution are visible [Fig. 6(a)]. On the other hand, some randomly distributed TCP phases with rod-like and blocky shape are also visible in γ matrix [Figs. 6(b) and 6(c)]. SADPs show that acicular-shaped TCP phase in Fig. 6(a) is σ phase, rod-like TCP phase in Fig. 6(b) is R phase, and blocky TCP phase in Fig. 6(c) is μ phase. Furthermore, EDS analysis shows that three TCP phases basically have the same compositions.
TEM micrograph [(a), (b), and (c)] and the corresponding SADP [(d), (e), and (f)] of σ phase in alloy S3, μ phase in alloy S6, and R phase in alloy S9, respectively.

IV. DISCUSSION
A. Effect of W, Re, Cr, and Mo on the size of γ′ phase
There are three reasons for having different sizes of γ′ phase in Ni-based single crystal superalloys after aging treatment. Temperature and holding time of aging treatment is reported to be the first reason Reference Nathal and Ebert32 ; γ′ solvus temperature of alloy appears to be the second reason Reference Nathal and Ebert22,Reference Lifshitz and Slyozov33 ; and the diffusivity of alloying elements during aging treatment is third. Reference Wagner34 In this study, eleven kinds of alloys are subjected to the same aging treatment, so that the γ′ solvus temperature and diffusivity of alloying elements should be the main reasons resulting in the difference in γ′ size.
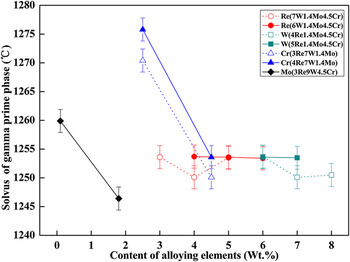
The γ′ solvus temperatures of eleven kinds of alloys determined by DSC are shown in Fig. 7. It can be seen that the γ′ solvus temperature of S4, S6, S10, and S11 alloys is 1270 °C, 1276 °C, 1260 °C, and 1246 °C, respectively, and γ′ solvus temperature of the other alloys is nearly 1253 °C, which indicates that the γ′ solvus temperature is obviously decreased by Cr and Mo addition, but basically has no change on Re and W addition.
Plot of γ′ solvus temperature with alloying elements content.

Higher solvus temperature results in earlier precipitation of γ′ phase during cooling process after the solution treatment. In other words, it provides a longer time for γ′ phase to grow and hence the size of γ′ phase before aging treatment will become larger. Reference Nathal and Ebert22 Besides, it is well known that the diffusion rate of Re is very slow in Ni matrix, and thus the diffusion rate of other alloying elements are also reduced by adding Re. The diffusion rate of W, Mo, and Cr is much faster compared to Re, and their contents do not obviously affect the diffusion rate of other alloying elements. Reference Karunaratne, Cox, Carter, Reed, Pollock, Kissinger, Bowman, Green, Mclean, Oison and Schirra35 Therefore, the size of γ′ phase decreases by Re addition as Re effectively restrains the diffusion rate of alloying elements during aging treatment. In addition, the size of γ′ phase decreases by the addition of Mo or Cr because Mo and Cr obviously reduce the γ′ phase solvus temperature of alloys. However, W neither changes the solvus temperature of γ′ phase nor the diffusion rate of other alloying elements, thereby it could not affect the size of γ′ phase.
B. Effect of W, Re, Cr, and Mo on TCP phase
Two aspects should be taken into consideration in discussing the TCP phase precipitation in Ni-based single crystal superalloys: (i) partitioning of alloying elements. It is well known that after aging treatment, alloying elements Re, Mo, Cr, and W enrich in γ matrix, while Al and Ta enrich in γ′ phase. Reference Liu, Liu, Zhang, Yang, Zhang and Fu36 During thermal exposure, with growing up the γ′ phase, more and more Al and Ta (γ′ phase forming elements) further enrich in γ′ phase while a growing number of Re, W, Mo enrich in γ matrix. Reference Tian, Wang, Li, Qian and Xie37 When the enrichment of Re, W, Mo in local area exceeds their solubility limits and make γ matrix supersaturated, consequently, these elements will precipitate as TCP phase. Reference Karunaratne, Rae and Reed8 (ii) segregation of alloying elements. Alloying elements Re, W, and Cr are prone to segregate in dendrite core, especially after Re content is increased to 4–6 wt% in the third generation alloys, and the segregation degree in as-cast alloy is further aggravated. In addition, the diffusion rates of Re and W are very low. Therefore the segregation could not be eliminated completely after solution heat treatment, and there are still W and Re segregation in dendrite cores. As a result, the content of refractory elements in dendrite core is much higher than that in interdendritic regions, which leads to the γ matrix in dendrite core to more easily reach supersaturation state and precipitate TCP phase. It can be inferred that TCP phase is most easy to precipitate in dendrite γ matrix of alloy. Therefore, the composition of γ matrix in dendrite core after aging treatment is very important to evaluate if the alloy will precipitate TCP phase.
Table III shows the elemental partitioning ratio of γ and γ′ phases in dendrite core of eleven kinds of alloys after solution and aging treatment. It can be seen that the partitioning ratios of Al, Ta, Co, and Ni have no obvious change. Therefore, the partitioning ratios of Cr, Mo, and Re are focused in the following discussion. Firstly, it can be found that with increasing Re from 4% to 6%, the partitioning ratios of Cr, Mo, and Re in 6% W containing alloys are obviously increased, and especially the partitioning ratio of Re is increased from 3.6 to 8.1. With increasing Re from 3% to 5%, the change of partitioning ratios in 7% W containing alloys is similar to that in 6% W containing alloys. Secondly, the partitioning ratios of Cr, Mo, and Re in 3 and 4% Re contained alloys are both increased with increasing Cr from 2.5% to 4.5%. Thirdly, the partitioning ratios of Cr, Mo, and Re in 3% Re and 9% W containing alloys are increased with increasing Mo from 0.1% to 1.8%, and especially the partitioning ratio of Mo itself is increased from 2.1 to 3.7, and partitioning ratio of Re is also increased from 2.1 to 5.4. These results show that the addition of Re, Mo, and Cr can increase the alloying element enrichment in varying degrees, in which, Re and Mo intensively promote the enrichment, but the effect of Cr is smaller. Therefore, the volume fraction of TCP phase is dramatically increased with increasing Re or Mo content, and relatively fewer increased with increasing Cr content.
Elemental partitioning ratios of eleven kinds of investigated alloys after aging treatment.

It should be noted that the partitioning ratio of W is very small (only 1.4) and almost has no change, either with increasing Re, Mo, and Cr or with increasing itself, which indicates the enrichment of W in γ matrix is not very intense and not changed. Besides, the partitioning ratios of Cr, Mo, and Re in 4 and 5% Re contained alloys are both only slightly increased with increasing W from 6% to 8%, which indicates that the addition of W has no obvious effect on the enrichment of other elements. Therefore, the volume fraction of TCP phase is not obviously increased with W addition.
Besides, the phase computation (PHACOMP) method, New PHACOMP method and radius–electronegativity–number (REN) method were mainly used to predict the precipitation tendency of TCP phase for Ni-based single crystal superalloys.
Reference Murphy, Sims and Beltran38–Reference Chen, Han, Zhong, Wei and Yan40
The PHACOMP was proposed based on the electron vacancy concept. In this method, the tendency of TCP phase is determined by a magnitude of the average electron vacancy number N
v, which is the number of vacancies or electron holes in the metal d band above the Fermi level. The new PHACOMP was developed on the basis of theoretical calculation of electronic structures. In this method, when the average value of M
d which correlates with electronegativity of element becomes large than a certain value, the TCP phase precipitation takes place. The calculation results of
 ${\bar N_{\rm{v}}}$
and
 ${\bar M_{\rm{d}}}$
of eleven kinds of alloys are listed in Table IV. By comparing the value of
 ${\bar N_{\rm{v}}}$
and
 ${\bar M_{\rm{d}}}$
and the TCP phase volume fraction, it can be seen that the values of
 ${\bar N_{\rm{v}}}$
and
 ${\bar M_{\rm{d}}}$
can reflect the change of TCP phase volume fraction caused by the addition of Re, W, Cr, and Mo. However, many alloys with lower value than the critical value (
 ${\bar N_{\rm{v}}}$
< 2.32,
 ${\bar M_{\rm{d}}}$
< 0.985) have precipitated TCP phase, and there are great differences between the predicted results and the experiment data of alloys with higher Re, Mo, and W content.
 ${\bar N_{\rm{v}}}$
,
 ${\bar M_{\rm{d}}}$
, and ΔS of eleven kinds of investigated alloys calculated using PHACOMP, New PHACOMP and REN method.

Based on solid solubility theory, REN method comprehensively takes into account the effects of electronegativity, atomic size, and electron concentration on solid solubility. In addition, the phase composition of γ and γ′ phase used for calculating solid solubility limit of Ni matrix and total content of alloying elements in γ matrix are experimentally measured in this study. Therefore, REN method should have the maximum prediction accuracy on the TCP phase precipitation. Solid solubility limitation of Ni matrix at 870 °C can be calculated using the following Equation proposed by Chen et al. Reference Chen, Han, Zhong, Wei and Yan40 :
 $${S_{870\,^\circ {\rm{C}}}} = 44.78448 - 68.5517\Delta R - 3.4853\Delta {N^2} - 31.9337\Delta {E^{{1 \mathord{\left/ {\vphantom {1 3}} \right. \kern-\nulldelimiterspace} 3}}}\quad ,$$
where ΔR and ΔN are the differences of atomic radius and electronegativity between solute element and Ni element, respectively, and ΔE 1/3 is the difference of cubic root of electron number in outer shell between solute element and Ni element. Then ΔS is calculated by using Eq. (2):
 $$\Delta S = {S_{\rm{g}}} - {S_{870\,^\circ {\rm{C}}}}\quad ,$$
where S g is the total content of alloying elements in γ matrix. It illustrates that when ΔS > 0, TCP phase will precipitate, and when ΔS < 0, no TCP phase is found.
According to REN method, the precipitation of TCP phase is influenced by two factors: (i) solid solubility limitation of γ matrix at aging temperature, S 870 °C; (ii) actual content of alloying elements in γ matrix, S g. Chen et al. Reference Chen, Han, Zhong, Wei and Yan40 believed that the increase in low solid solubility alloying elements, such as Al, Ta, W, and Re could reduce the solid solubility limitation, whereas, the increase of Co and Ru content as high solid solubility alloying elements could increase the solid solubility limitation of γ matrix. It can be seen from Table III that the enrichment of alloying elements, especially Re in γ matrix is dramatically increased with increasing Re, Cr, and Mo content, but which just slightly increased with increasing W content. Besides, the REN calculation results show that the solid solubility limit of γ matrix is slightly increased with increasing Cr and Mo, and it does not change with increasing Re and W. Therefore, ΔS of the studied alloys is obviously increased with the addition of Re, Cr, and Mo, and increased slightly with W addition.
Table IV lists the calculation results of ΔS for eleven kinds of alloys. A higher value indicates a higher quantity of TCP phase. For example, the S3 alloy which precipitates maximal TCP phase has highest (1.93) and S4 alloy, which does not precipitate TCP phase, has lowest (−0.82) ΔS. The ΔS (0.99) of S11 alloy containing 1.8% Mo is higher than that (0.21) of S10 alloy containing 0.1% Mo, and the TCP phase volume fraction in S11 alloy is greater than that in S10 alloy. The ΔS (1.22) of S7 alloy containing 4% Re is higher than that (0.36) of S5 alloy containing 3% Re, correspondingly, the TCP phase volume fraction in S5 alloy is greater than that in S3 alloy. The value of ΔS indirectly reflects the intensity of TCP phase precipitation, which is well consistent with the experiment result as shown in Figs. 3 and 4.
Finally, it can be seen from Fig. 3 that acicular, rod-like and blocky TCP phase coexist at the later stage of thermal exposure in alloys. Figure 6 illustrates that TCP phase with different morphology has the different type, while other works indicate that the TCP phase with different morphology may be has same type. Reference Wen, Li, Liu, Chen and Jin41,Reference Qin, Guo, Yuan, Yang, Zhou and Ye42 In another word, TCP phase with the same morphology may be the σ phase, or μ phase, or R phase. Thereby an indirect relationship between alloying elements content and the morphology, or the type of TCP phase is not disclosed. In addition, the morphology and the type of TCP phase will transform during thermal exposure, Reference Rae and Reed7 therefore it needs further study to explain these phenomena.
V. CONCLUSION
The effects of W, Re, Cr, and Mo additions on the elemental partitioning, the morphology of γ′ phase and the precipitation of TCP phase were investigated in eleven kinds of Ni-based single crystal superalloys. The main conclusions can be summarized as follows:
-
(1) The enrichment of Re, Mo, and Cr, especially Re was dramatically increased in γ matrix with increasing Re, Cr, and Mo content, but it does not change with increasing W content.
-
(2) The morphology and volume fraction of γ′ phase were not changed with increasing Re, Mo, and Cr, but the size of γ′ was significantly decreased with increasing Re and slightly decreased with increasing Cr and Mo. However, W neither affected the morphology and volume fraction nor changed the size of γ′ phase.
-
(3) The precipitation of TCP phase was dramatically increased with increasing Re or Mo content, and its volume fraction was increased approximately 4% with adding 1% Re or Mo content. With increasing 1% Cr content, the volume fraction of TCP phase was greatly increased about 2.2%. With increasing 1% W content, the volume fraction of TCP phase was only slightly increased 0.3%.
-
(4) TCP phases formed after thermal exposure for 1000 h were identified as σ, μ, and R phases.
ACKNOWLEDGMENTS
This work was supported by the National High Technology Research and Development Program of China (2012AA03A511), National Natural Science Foundation of China (51472200, 51272211, 51002122, 51331005), Research Fund of the State Key Laboratory of Solidification Processing in NWPU (93-QZ-2014, 132-QP-2015), Project of Shaanxi Provincial Youth Science and Technology Star Plan (2015KJXX-08), and Fundamental Research Funds for the Central Universities (G2015KY0002).