Implications
Various programmes were developed to provide tools to assess welfare and to ultimately implement a farm classification system. Such classification may have an economic impact for the farms, since an increasing number of food retailers requires that products meet welfare standards. Therefore, the objectivity of animal-based measures and their consistency within various environments are key elements for an accurate assessment of animal welfare.
Introduction
Animal care assessment programmes have been developed in several European and North-American countries to ensure that farm animal welfare is not compromised (Welfare Quality®, 2009; Canadian Pork Council, 2010). Animal-based measures, such as lameness, stereotypies and reaction to humans, are commonly used for on-farm animal care assessment, since they are known to directly reflect the welfare state of the animal (Johnsen et al., Reference Johnsen, Johannesson and Sandøe2001). The objectivity of animal-based measures, as well as their validation, are key elements for an accurate welfare assessment. Within the validation process, it is important to determine the extent to which a measurement actually measures what it intends to measure (Martin and Bateson, Reference Martin and Bateson2007). Among other criteria, the measurement must give consistent results within various environments (Edwards, Reference Edwards2007). For instance, postural behaviour which could be used as an indicator of lameness can also be affected by space allowance (Salak-Johnson et al., Reference Salak-Johnson, DeDecker, Horsman and Rodriguez-Zas2012). Other lameness measures such as sow walking speed, stride length and stepping behaviour have been shown to be promising quantitative indicators of lameness and may be easily measured on farm (Ringgenberg et al., Reference Ringgenberg, Bergeron and Devillers2010; Grégoire et al., Reference Grégoire, Bergeron, D’Allaire, Meunier-Salaün and Devillers2013). Recording the presence of stereotyped behaviours requires the performance of animal observations, which can disturb the sow and interrupt the abnormal behaviour (Keeling, Reference Keeling2009). Recording the presence of saliva foam around the mouth has been suggested as an alternative (Fraser and Broom, Reference Fraser and Broom1990). Finally, most of the work on development of methods to assess sow reactivity to humans or lameness was done under experimental conditions without being validated under commercial conditions (Clouard et al., Reference Clouard, Meunier-Salaün and Devillers2011; Grégoire et al., Reference Grégoire, Bergeron, D’Allaire, Meunier-Salaün and Devillers2013). Therefore, the objectives of this study were to evaluate under commercial conditions several indicators related to three components of sow welfare (sow lameness, oral stereotypies and reactivity to humans) and to determine whether or not rearing conditions, sow parity and stage of gestation might affect these indicators.
Material and methods
Farms and animals
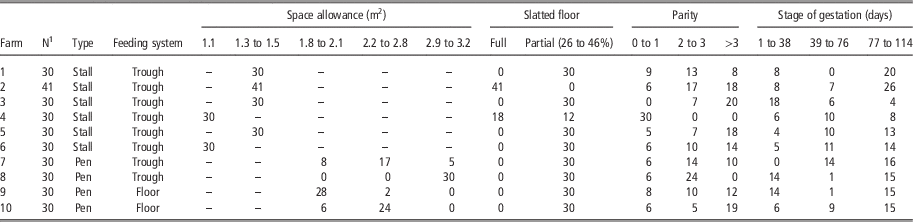
Three hundred and eleven gestating sows from 10 farms were assessed with 30 to 41 sows randomly selected per farm. Housing, flooring and feeding systems for each farm as well as parity and stage of gestation of sows are reported in Table 1. Pen-housed sows were always in small stable groups of 4 to 8 sows. The experimental protocol was approved by an institutional animal care committee in accordance with the Canadian Council on Animal Care guidelines (CCAC, 2009).
Description of the 10 visited farms and parity and stage of gestation of the selected sows

1 Number of gestating sows studied.
Data collection
Lameness, oral stereotypies and reactivity to humans were assessed on all farms by the same two trained observers, within a 2-day period for each farm. All observations for a single sow were done on the same day and each type of measure was always done by the same observer in the same order.
Assessment of lameness
Different measures were recorded for each selected sow. At morning feeding, the number of steps of rear legs, defined as the sow lifting the hoof off the ground and putting it back down (Ringgenberg et al., Reference Ringgenberg, Bergeron and Devillers2010), was recorded for 30 s per sow while they were standing and eating. The posture of the sow (standing, lying or dog-sitting) was noted every 15 min for the first hour after food delivery to evaluate its latency to lie (⩽30 min after feeding, between 30 and 60 min after feeding, >60 min after feeding). In the afternoon, the same sows were walked individually at a steady pace in a corridor and their gait was assessed, using a 4-point gait score adapted from the 6-point scale of Main et al. (Reference Main, Clegg, Spatz and Green2000) for mobile sows (0: even strides and no gait problem observed, 1: abnormal stride length, stiffness in movements, not obviously lame, 2: stride shortened, lameness detected, swagger of caudal body, 3: affected limb not in contact with the floor). The sow stride length and walking speed were calculated by dividing the length of the path (5.1±0.27 m) by the number of steps or the duration of the walk, respectively. At the end of the day, a stand-up test was performed, which consisted in recording the ease of movement of a sow lying down, when gently encouraged to stand up (stand up: stands up without hesitation; hesitate: takes more than 5 s to stand up, changes position or lies down before standing up; refuse: refuses to stand up or stays in a sitting position).
Assessment of oral stereotypies
Stereotyped behaviours were recorded one hour after the morning food delivery according to the Welfare Quality® method. Each sow was observed for 15 s to note the presence of stereotypies, but the period was extended to 1 min when the observer was unsure whether the sow was performing stereotyped behaviour or not (Welfare Quality®, 2009). The stereotypies considered were sham chewing, fixture biting (chains, feeder, drinker and bars), tongue-rolling and floor licking. In the afternoon, the presence of saliva foam in the environment and around the mouth of sows was noted.
Assessment of reactivity to humans
In the afternoon, approach and handling tests were performed, according to previously validated methods (Clouard et al., Reference Clouard, Meunier-Salaün and Devillers2011). These methods were slightly different depending on the housing type. For both housing designs, data recorded during the approach test were the presence or absence of (1) posture change, (2) behaviour reaction (either escape, aggressive, or avoidance behaviour before the approach or after the attempt to touch the head), (3) hand contact with the head of the sow between the ears and (4) vocalisation. The number of attempts to approach the sow (1 attempt, more than 1 attempt) was also recorded for sows in pens. During the handling test for sows in stalls, the reaction to door opening (exit, partial exit, or no exit), the number of interventions (use of a paddle) required to empty the stall (0, 1, 2, >2), the presence or absence of step back or stops, and vocalisation, and the latency to exit the stall were recorded. During the handling test for sows in pens, the time required to isolate the sow (in a corner of the pen using two boards), the duration of the isolation (10 s,<10 s, no isolation), the presence of exploration during isolation, vocalisation during the attempt to isolate and during isolation, and attempt to escape during isolation were recorded.
Statistical analyses
The experimental unit was the sow. The majority of the animal-based measures were categorical with the exception of stride length, walking speed, number of steps and latency to exit the stall and to isolate the sow. Each of these continuous variables were grouped into three or more categories with a similar percentage of sows in each category.
The associations between measures within and between each welfare component were tested using χ 2 and Cochran–Mantel–Haenszel tests of association for ordinal categories. The presence and direction of an association were indicated by the row mean score statistic (i.e. location shift in the mean score of the response variable (column) across the levels of the factor variable (row)). Associations between housing design variables (housing system, feeding system in pens only, space allowance, floor type in stalls only) or sow characteristics (parity and stage of gestation) and the measures from the three welfare components were also analysed using χ 2 and Cochran–Mantel–Haenszel tests of association. Analyses were performed separately for sows housed in stalls or in pens.
When an association was found between variables within a welfare component, a threshold value was determined for these measures above or below which the animal would be correctly classified as presenting a welfare issue, such as lameness. To evaluate the accuracy of a measure in diagnosing a disease, the method described by Parikh et al. (Reference Parikh, Mathai, Parikh, Chandra Sekhar and Thomas2008) was used. The method consists in comparing the classification of the sows obtained with a specific measure (e.g. stride length) with the one from a gold standard (e.g. gait score) and then to assess the ability of the specific measure to correctly classify, for example, an individual as lame (sensitivity) or non-lame (specificity). For continuous variables a threshold value had to be determined for categorisation. To select the best threshold value, sensitivity, specificity and the positive predictive value (PPV, e.g. the probability that the animal is actually lame when the indicator is present) were calculated for several threshold values. A threshold was considered to be the most efficient in correctly classifying animals with minimal errors when the sum of sensitivity, specificity and PPV was the highest. The negative predictive value (NPV, e.g. the probability that the animal is actually sound when the indicator is absent) of the indicators was also calculated (Parikh et al., Reference Parikh, Mathai, Parikh, Chandra Sekhar and Thomas2008).
For the reactivity to humans component, the measures from the approach and handling tests were analysed separately for stalls and pens, because the test procedures and therefore variables were different. A discrimination index (D-value) was calculated to evaluate the discriminant power of each measure to identify low and high reactive sows, as described by Clouard et al. (Reference Clouard, Meunier-Salaün and Devillers2011). For continuous variables (latency to exit the pen or to isolate the sow), the inter-sow coefficient of variation was used to assess the discriminant power of the measure in association with the D-value (Clouard et al., Reference Clouard, Meunier-Salaün and Devillers2011).
Results
Lameness
Of the 287 sows for which a gait score was obtained, 48.8% scored 0; 35.5%, 1; 13.6%, 2; and only 2.1%, 3. Due to the low percentage of sows with a score of 3, scores 2 and 3 were combined for subsequent analyses (score 2+).
Association between gait score and other lameness measures
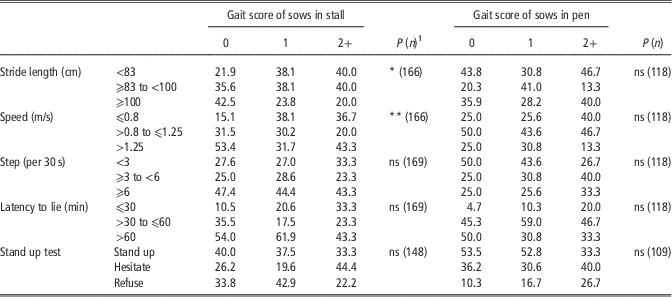
Gait score was associated with walking speed (P<0.01) and stride length (P<0.05) only in sows housed in stalls: more sows with a score of 0 walked faster and had a longer stride length (Table 2). The best threshold value identified for the stride length was of 83 cm, a value lower than 83 cm indicating a lame sow (scores 1 and 2+), with a sensitivity of 0.39, specificity of 0.78, a PPV of 0.69 and a NPV of 0.50. The best threshold value identified for the walking speed was of 1m/s, a value lower than 1m/s indicating a lame sow, with a sensitivity of 0.57, specificity of 0.71, a PPV of 0.72 and a NPV of 0.55. There were no associations between gait score and stepping behaviour and the stand-up response (Table 2, P>0.10).
Associations between gait score and other measures used to assess lameness

Values represent the percentage of sows in each category for different measures of lameness, according to the gait score (100% in column). The P-value corresponds to the Cochran–Mantel–Haenszel test (column mean score difference).
1 P value: *P<0.05, **P<0.01, ns: non-significant; values in bracket represents the effective sample size for the statistical test.
Association between housing design and lameness measures
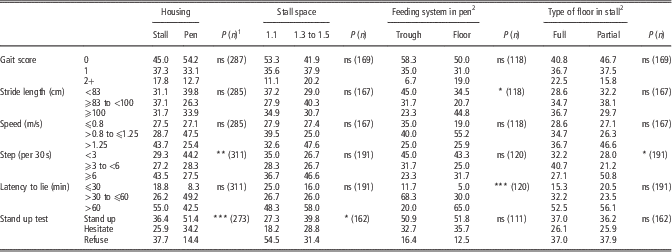
Housing system was associated with stepping behaviour (Table 3, P<0.01) and stand-up response (Table 3, P<0.001), with more stall-housed sows in the high stepping category, and more pen-housed sows standing-up during the test. There were no associations between housing system (stall and pen) and gait score, stride length and latency to lie (Table 3, P>0.10).
Associations between housing design and lameness measures

Values represent the percentage of sows for each category of lameness measures (100% in column). The P-value corresponds to the Cochran–Mantel–Haenszel test (column mean score difference).
1 P values: *P<0.05; **P<0.01; ***P<0.001, ns: non-significant; values in bracket represents the effective sample size for the statistical test.
2 Feeding systems in stalls and types of floor in pens were not analysed since there was only one type in each.
In sows housed in pens, stride length and latency to lie were associated with feeding system, with a greater proportion of sows fed on the floor showing a long stride length (P<0.05) and a high latency to lie down (P<0.0001, Table 3). There was an association between stepping behaviour and floor type in stall-housed sows (Table 3, P<0.05). However, stepping data were collected on the rear legs which were, in both flooring systems, on slatted floor. For the stand-up test, there was also an association with the space allowance in stalls (P<0.05): more sows housed in stalls of 1.1 m2 refused to stand up compared with sows housed in stalls of 1.3 to 1.5 m2 (Table 3). There were no associations between measures and space allowance in pens (P>0.10, data not shown). The distribution of sows within categories of gait score and walking speed was not associated with any of the variables related to the housing design (Table 3, P>0.05).
Association between parity, stage of gestation and other lameness measures
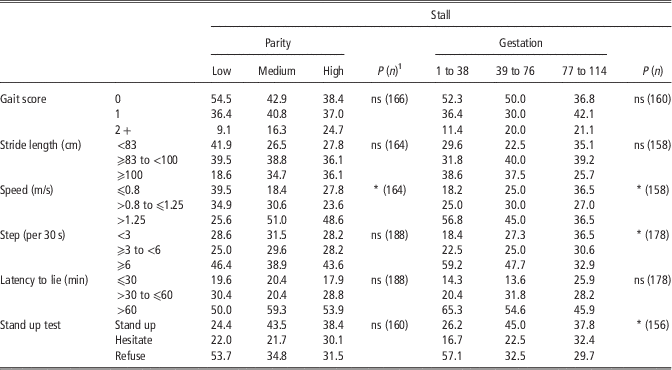
For sows in stalls, parity was only associated with walking speed (P<0.05), with more sows in the low parity group walking at a slower speed (Table 4). Stage of gestation was only related to walking speed, stepping and stand-up categories (P⩽0.05). A greater percentage of sows in early gestation walked faster, performed more stepping, and refused to stand-up (Table 4). In pen-housed sows, no associations were observed between stage of gestation or parity and any of the lameness variables (P>0.10, data not shown).
Associations between sow characteristics (parity and stage of gestation) and categories of lameness measures in stall

Values represent the percentage of sows (100% in column). The P-value corresponds to the Cochran–Mantel–Haenszel test (column mean score difference).
1 P value: *P<0.05, ns: non-significant; values in bracket represents the effective sample size for the statistical test.
Stereotyped behaviours
Saliva foam in the environment was only seen in a few stalls (16 sows). Saliva foam around the mouth was observed on a greater percentage of sows in stalls than in pens (44% v. 20.8% respectively; P<0.0001, n=311). A similar proportion of sows were seen licking the floor whether they were in stalls (13.6%) or in pens (12.5%; P>0.10). The percentage of sows sham chewing, tongue-rolling and biting the fixtures was higher in stalls than in pens (sham chewing: 59.7% v. 45.8%, P<0.05; tongue-rolling: 14.7% v. 5.0%, P<0.01; fixture biting: 22.5% v. 0.8%, respectively; P<0.0001, n=311).
The percentage of sows with foam around the mouth was higher among sows that were sham chewing and fixture biting than in among those not performing these behaviours (40.8% v. 28.2% for sham chewing, P<0.05; 50.0% v. 32.6% for fixtures biting, P<0.05). When the presence of saliva foam around the mouth was considered as an indicator of oral stereotypies, the sensitivities, specificities, PPV and NPV were 0.41, 0.72, 0.63 and 0.50 for sham chewing, and 0.50, 0.67, 0.20 and 0.89 for fixture biting, respectively.
In stalls and pens, there were no associations between parity or stage of gestation and any of the measures of stereotyped behaviours, except that the percentage of sows licking the floor decreased with the stage of gestation in stall-housed sows (1 to 38 days, 24.5%; 39 to 76 days, 11.4%; 77 to 114 days, 5.9%; P=0.01, n=178).
Reactivity to humans
Approach test
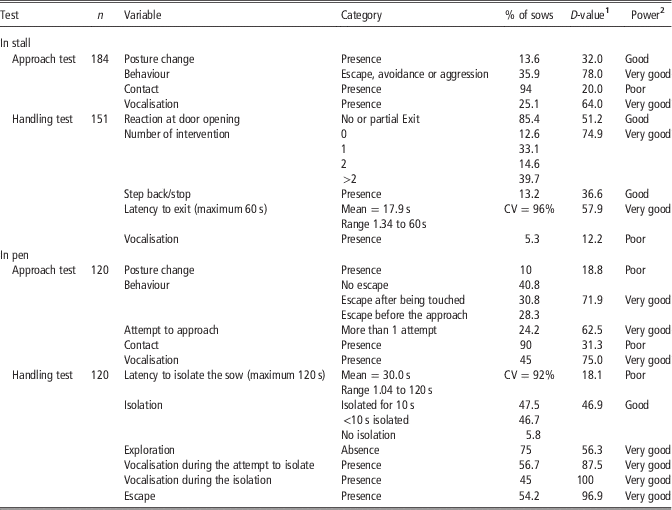
In both housing systems, the experimenter was able to touch more than 90% of the sows between the ears. The discrimination index revealed that the behaviour (aggression, avoidance or escape) and vocalisation were very good indicators of sow reactivity (Table 5).
Discrimination index for measures taken during reactivity to humans tests

1 Discrimination index.
2 Poor=above 80% of sows for one score or D-value lower than 30, good=between 20% and 80% of sows in the different scores or D-value between 30 and 50, very good=D-value higher than 50.
Handling test
In stalls, the majority of sows did not move after the door was opened (85.4%). The number of interventions needed to make the sow exit the stall and the latency to exit the stall were very good indicators of sow reactivity to humans based on the discrimination index (Table 5). In pens, vocalisations during approach and isolation, exploration and attempt to escape after being isolated were also very good indicators of sow reactivity to humans (Table 5).
Association between housing design and measures of reactivity to humans
In stalls, the percentage of sows trying to escape or being aggressive decreased with increased space allowance (1.1 m²: 57.4%, 1.3 to 1.5 m²: 26.9%, P<0.001, n=184). More sows in the 1.1 m² group required >2 interventions (1.1 m²: 61.1%, 1.3 to 1.5 m²: 30.8%, n=184, P<0.0001) and more time to exit the crate (1.1 m²: 31.5% with 16 to 60s and 20.4% with >60s; 1.3 to 1.5 m²: 18.4% with 16 to 60s and 6.2% with >60s; n=184, P<0.0001).
In pens, the percentage of sows needing more than 1 attempt to be approached increased with increasing space allowance (1.8 to 2.1 m²: 16.7%, 2.2 to 2.8 m²: 18.6%, 2.9 to 3.2 m²: 40%; P<0.05, n=120), but housing design was not associated with the behavioural response of sows during the handling test (P>0.10, data not shown).
Association between parity, stage of gestation and measures of reactivity to humans
Stage of gestation was not associated with any of the variables in the approach or handling tests whether in stalls or in pens (P>0.10, data not shown). In return, there was an association in stalls between parity and the percentage of sows trying to escape or being aggressive (low: 54.7%, medium: 30.8%, high: 26.3%; P<0.01, n=181), and vocalising (low: 37.7%, medium: 23.1%, high: 18.4%, P<0.05, n=181) during the approach test. Also in stalls, there was an association between parity and the number of intervention required to exit the stall (P<0.05, n=181): more sows in low parity group required more interventions to exit the stall (low: 3.8% needed no intervention, 26.4% one intervention, 20.8% two interventions, 49.1% >2 interventions; medium: 17.3%, 36.5%, 13.5% and 32.7%, respectively; high: 14.5%, 32.9%, 15.8% and 36.8%, respectively). In pens, the percentage of sows vocalising during approach in the handling test increased with parity (low: 38.5%, medium: 54.7% and high: 70.7%; P<0.05, n=120), with no differences for vocalisation during isolation (P>0.10, data not shown).
Association between welfare components
There were no associations between the behaviour of the sows during the approach test and other measures involving the presence of humans such as the stand-up test and the walking speed (P>0.10, data not shown). In stalls, responses to the stand-up test and the handling test were associated. Sows that refused or hesitated to stand up required more interventions to exit the stall (stand up: 15.3% needed no intervention, 37.3% one intervention, 20.3% two interventions, 27.1% >2 interventions; hesitate: 9.8%, 26.8%, 24.4% and 39.0%, respectively; refuse: 6.9%, 31.0%, 10.3% and 51.7%, respectively; P<0.05, n=158). Sows that stood up exited the stall more quickly (stand up: 42.4% left the crate in <8s, 37.3% in 8 to 16s, 17.0% in 16 to 60s, 3.4% in >60s; hesitate: 29.3%, 36.6%, 29.3% and 4.9%, respectively; refuse: 31.0%, 24.1%, 27.6% and 17.2%, respectively; P<0.05, n=158).
Discussion
The purpose of this pilot study was to evaluate on-farm measures of lameness, oral stereotyped behaviours and reactivity to humans, on sows reared under different housing designs. It is important to emphasise that this study was not designed to compare the welfare level of sows, but rather to assess the potential influence of the environmental factors and sow characteristics (parity and stage of gestation) on the outcome of these measures. Indeed, to avoid misinterpretation in terms of welfare, it is important to ensure that a measurement reflects what it intends to measure. The small number of farms for each housing factor in our study precludes the generalisation of the present results to a housing system. However, potential effects of environmental factors on welfare indicator outcomes were identified and this, independently of their actual effects on sow welfare. For example, it has been shown that a sow could walk slowly to avoid slips and falls on a fouled floor, without any relationship with lameness (Von Wachenfelt et al., Reference Von Wachenfelt, Pinzke and Nilsson2009).
Visual gait score
Even though gait assessment by visual observation is subjective, it has been used in several studies and is often considered as the reference method to evaluate lameness in animals (Flower and Weary, Reference Flower and Weary2009). Considering all sows from the different farms, very few had a score of 3, corresponding to sows that did not place affected limb on the floor. This low percentage may not reflect the true prevalence of lameness on farms, but may actually be due to the fact that very lame sows had already been culled at the time of our visit or had been placed in hospital pens that were not selected for the study. No differences were observed in the prevalence of lameness between stalls and pens in the present study. Discrepancies are also found in the literature on the influence of housing systems (stall v. group housing) on the occurrence of lameness, and this may partly be confounded by other factors such as the floor type and the possibility to exercise and walk, which have an impact on sows lameness (Harris et al., Reference Harris, Pajor, Sorrells, Eicher, Richert and Marchant-Forde2006; Schenck et al., Reference Schenck, McMunn, Rosenstein, Stroshine, Nielsen, Richert, Marchant-Forde and Lay2008).
Comparison of lameness measures and associations with housing, stage of gestation and parity
Using automated methods such as kinematics, Grégoire et al. (Reference Grégoire, Bergeron, D’Allaire, Meunier-Salaün and Devillers2013) demonstrated that lame animals had reduced stride length and walking speed compared with sound animals. It was suggested that this reduction in speed and stride length was a way to reduce pain by decreasing the load on the affected leg.
In stalls, the probability that a sow was lame when it presented a short stride length or a low speed was high (69% and 72%, respectively), which suggests that these two variables might be good indicators of lameness. However, these were not sensitive enough to detect every lame sow in a herd, as shown by the low sensitivity values (0.39 and 0.57 for stride length and speed, respectively). Lameness is caused by several conditions affecting muscle, bone, joints and claws (Dewey et al., Reference Dewey, Friendship and Wilson1993), and depending on the pathogenesis, animals will exhibit different clinical signs such as stiffness during walk, avoidance of weight bearing or weight shifting during standing period (Jørgensen, Reference Jørgensen2000). Therefore a multi-criteria approach is essential to detect all lame animals. Also, when considering walking speed and stride length as indicators of lameness, the stage of gestation and parity must be considered.
In sows reared in pens, the lack of association between the gait score, stride length and walking speed may be due to the fact that they had greater opportunity to exercise and had to walk to access food and water, even with a lame limb. A longer walking distance than the one used in our study (>5 m) for the measurement of these indicators might increase precision and help discriminating lame from non-lame sows when housed in pens.
An increase in stepping behaviour when an animal is standing (e.g. during feeding) can indicate a lame animal that is transferring weight from a weak leg to another leg (Grégoire et al., Reference Grégoire, Bergeron, D’Allaire, Meunier-Salaün and Devillers2013). However, no associations were observed in the present study between stepping and gait-score categories, but this may be related to the data collection method. Indeed, to measure the stepping behaviour of the 30 sows all within the first 15 min after feeding, each sow was observed for only 30 s. This short period of time may not be long enough to accurately reflect the stepping behaviour of a sow. Other studies (Ringgenberg et al., Reference Ringgenberg, Bergeron and Devillers2010; Grégoire et al., Reference Grégoire, Bergeron, D’Allaire, Meunier-Salaün and Devillers2013) used a longer period per sow (30 to 60 min) and reported an association which may indicate that a longer observation period is required if stepping behaviour is to be used as an indicator, but this would be more difficult to implement.
Studies have shown that lame animals change their posture behaviour in order to reduce the pain of standing on an affected leg. For example animals will have longer lying bouts (Chapinal et al., Reference Chapinal, de Passillé, Weary, von Keyserlingk and Rushen2009) or will lie down quickly after feeding (Grégoire et al., Reference Grégoire, Bergeron, D’Allaire, Meunier-Salaün and Devillers2013). In the present study, the latency to lie down in the hour following feeding did not seem to accurately reflect lameness. Environmental bias (e.g. food on the floor, space allowance) and social context may have influenced the lying down behaviour of the sow as shown by Salak-Johnson et al. (Reference Salak-Johnson, DeDecker, Horsman and Rodriguez-Zas2012). For instance, penned sows were slower to lie down when fed on the floor, possibly due to a greater exploratory behaviour compared with sows fed in a trough. The stand-up test was not successful either in adequately categorising sows according to their degree of lameness (gait score), but it appeared to be related to movement restriction, since there were more refusals in stalls than in pens. This on-farm trial clearly indicates an influence of the housing and movement restriction on the sow response to encouragements to stand-up. Moreover, it may be difficult to differentiate between a lack of willingness and a difficulty to stand up (Buddle et al., Reference Buddle, Madec and Fourichon1994). Grégoire et al. (Reference Grégoire, Bergeron, D’Allaire, Meunier-Salaün and Devillers2013) suggested that the reactivity to humans (or fear of human) can be a potential bias for the stand-up test. In our study, sows that refused to stand-up also needed more interventions and took more time to exit the stall in the handling test (more fearful), which corroborates the hypothesis of an influence of reactivity to humans on the response to the stand-up test.
In summary, methods and measures that are useful to describe lameness in a standardised research environment do not seem to be directly applicable to on-farm detection of lameness irrespective of the housing design. Indeed, most variables were either not associated to the commonly used gait score method, or were associated only under certain housing conditions. In stalls, methods based on walking speed and stepping behaviour remain promising but would require further validation to be useful for the detection of lame sows. Moreover, the use of multiple and different measures is essential to correctly detect the prevalence of lame sows in a herd.
Stereotyped behaviours
Stereotyped behaviours have negative implications for welfare (Bergeron et al., Reference Bergeron, Badnell-Waters, Lambton and Mason2006). In our study, an observation of 15 s to 1 min per sow was enough to detect differences in behaviour between housing systems. There were more oral stereotyped behaviours (sham chewing, tongue-rolling, biting of fixtures) in stalls than in pens, as reported in a previous study (Hulbert and McGlone, Reference Hulbert and McGlone2006). In the same way, there were more sows having saliva foam around the mouth in stalls than in pens. The probability that a sow presented a sham chewing stereotyped behaviour when saliva foam around her mouth was observed was moderate (63%) and observation of the saliva foam alone was not enough to detect all stereotyping sows (only 41%). However, these two measures were collected at a different time of the day in our study. Having observed them at the same time might have resulted in a higher association. Nevertheless, observation of saliva foam around the mouth would be an easier alternative to detect oral stereotyped behaviours in sows in comparison to direct observations, if it could be further validated (Tuyttens, Reference Tuyttens2007). In contrast to other studies (Cronin and Wiepkema, Reference Cronin and Wiepkema1984; Broom et al., Reference Broom, Mendl and Zanella1995), gestation and parity did not seem to be associated with stereotyped behaviours in stalls or in pens.
Reactivity to humans
Approach and handling tests are described in the literature as promising tests to measure reactivity to humans in research (Clouard et al., Reference Clouard, Meunier-Salaün and Devillers2011) and potentially in a farm environment (Scott et al., Reference Scott, Laws, Courboulay, Meunier-Salaün and Edwards2009). The aim of this study was to test these methods on a large number of sows housed under different conditions and to determine, by the calculation of a discrimination index, which measures within a test would better discriminate between low and high reactive sows. For the approach test, the experimenter was able to have contact with almost all sows, which corresponds to a poor discrimination index. In contrast, the occurrence of vocalisations appeared to be a particularly good indicator for sows reared in stalls and in pens, for both tests (approach and handling). This is consistent with the use of vocalisations to classify sows as more or less reactive in association with withdrawal behaviours (Mosnier et al., Reference Mosnier, Dourmad, Etienne, Le Floc’h, Père, Ramaekers, Sève, Van Milgen and Meunier-Salaün2009). In general, the discrimination indexes and coefficient of variation values corroborate the findings of Clouard et al. (Reference Clouard, Meunier-Salaün and Devillers2011). However, the housing conditions seemed to influence the response of sows to humans. For instance, in the approach test in pen, the space allowance influenced the number of attempts to approach the sow since it gave the sow more chance to escape when the observer approached. In the present experiment, parity also influenced the reactivity to humans, as mentioned by Hemsworth et al. (Reference Hemsworth, Brand and Willems1981). For instance, older sows in stalls appeared to be less fearful, since fewer sows tried to escape or to be aggressive during the approach test, and they needed fewer interventions to exit the stall in the handling tests.
In conclusion, this on-farm study showed that the interpretation of a measure is dependent on the housing system, sow parity and stage of gestation, and therefore it is necessary to consider these factors when assessing welfare. More work would be necessary to determine objective measures that can be used regardless of the housing design to ensure the validity of such measures. Moreover, the establishment of a threshold value for each potential indicator is essential, especially when there is no gold standard method as is the case with lameness.
Acknowledgements
The authors would like to thank the producers who participated in this study and gave access to their farm and animals. This research was funded by the Fédération des Producteurs de Porcs du Québec and the Agriculture and Agri-Food Canada Matching Investment Initiative. The authors also thank Claire Corriveau, Marjolaine St-Louis and Josyane Gauthier for their invaluable technical assistance and Steve Méthot for assistance with statistical analysis.