Implications
Data from this study are the first to reveal the effects of different available phosphorus (P) levels in Longissimus dorsi gene expression related to oxidative phosphorylation and its implications on pig performance. Moreover, this study showed the effects of high temperatures on the expression of these genes and how this may alter the physiological response to P. This information will contribute to better understand the role of P in energy metabolism and will bring new insights into the comprehension of the effects of high temperatures on nutritional requirements and mitochondrial function.
Introduction
Dietary manipulations and nutritional strategies are key tools for influencing pig production. Nutrigenomics and nutritional genomics are sciences that examine the effects of nutrition on gene expression (Swanson et al., Reference Swanson, Schook and Fahey2003). It is currently believed that this science will provide new nutritional or management strategies for controlling the key metabolic processes in livestock by managing gene expression rather than looking only at the animal performance response. Nutrigenomics studies in livestock are still rare, but they are become important as we develop an understanding about the relationship between nutrition, tissue growth and performance.
In meat-producing animals, skeletal muscle, mainly Longissimus dorsi (LD), is one of the tissues of major economic importance. Energy metabolism of skeletal muscle should be assessed for a better understanding about how nutrients, or their dietary levels affect the expression of mitochondrial genes. Among nutrients, phosphorus (P) is of particular interest, because of its connection to the energy metabolism (storage and transfer through adenosine triphosphate (ATP)) and also because it is important for the growth of muscle tissue, which quantitatively constitutes the second largest body reserve (Stahly, Reference Stahly2007).
Several studies have indicated that P requirements in pigs selected for high-lean deposition differ across different growth phases (Hendricks and Moughan, 1993; Stahly et al., Reference Stahly, Lutz and Clayton2000; Saraiva et al., Reference Saraiva, Donzele, Oliveira, Abreu, Silva and Santos2009). However, little has been published on the analyses of gene expression when studying dietary levels of available phosphorus (aP) for pigs. Only two studies have shown that the need of aP is genotype specific (Hittmeier et al., Reference Hittmeier, Grapes, Lensing, Rothschild and Stahl2006; Alexander et al., Reference Alexander, Qu, Cutler, Mahajan, Lonergan, Rothschild, Weber, Kerr and Stahl2008).
In addition, it is important to investigate the effects of the thermal environment on the regulation of gene expression, especially in tropical countries, where high temperatures persist throughout the year. Several studies have demonstrated that high temperatures have negative effects on the performance of pigs during most phases of production (Quiniou et al., Reference Quiniou, Dubois and Noblet2000; Collin et al., Reference Collin, Lebreton, Fillaut, Vicent, Thomas and Herpin2001a; Renaudeau et al., Reference Renaudeau, Gourdine and Pierre2011), but there is little information about the changes in muscular energy metabolism in heat-stressed pigs (Rinaldo and Dividich, Reference Rinaldo and Dividich1991; Collin et al., Reference Collin, van Milgen, Dubois and Noblet2001b) or on the interaction between dietary levels of aP and the thermal environment to which the animals are submitted.
Therefore, this study was realized to evaluate the expression of genes encoding electron transport chain proteins in the Longissimus dorsi (LD) muscle of pigs from a high-lean meat deposition line at two different growth phases: 15 to 30 kg and 30 to 60 kg, submitted to two thermal environments and fed different aP levels.
Material and methods
All methods involving animal handling were realized in accordance with the regulations approved by the Institutional Animal Welfare and Ethics/Protection commission from the Universidade Federal de Viçosa, Brazil.
Experimental design and pig management
Two trials were carried out using 48 high-lean growth pigs from two different growth phases: 24 pigs from 15 to 30 kg (phase 1) and 24 pigs from 30 to 60 kg (phase 2). Their average initial weights were 15±0.41 and 30.19±0.30 kg, respectively. A randomized block experimental design in a 2×3 factorial arrangement (2 environmental temperatures×3 levels of dietary aP) were used. Four replicates were used in each trial. BW and kinship of pigs were used as criteria in the blocks formation. Pigs from growth phase 1 were submitted either to a thermoneutral (24ºC and RH at 76%) or to a heat stress (34ºC and RH at 70%) environment as described by Coffey et al. (Reference Coffey, Parker and Laurent2000). In each environment animals were fed with three different levels of dietary aP (0.107%, 0.321% or 0.535%). Pigs from growth phase 2 were submitted either to a thermoneutral (22ºC and RH at 77%) or to a heat stress (32ºC and RH at 73%) environment as described by Coffey et al. (Reference Coffey, Parker and Laurent2000). In each environment the animals were fed with three different levels of dietary aP (0.116%, 0.306% or 0.496%).
Pigs were housed in a climatic-controlled room equipped with suspended metal cages with slatted flooring and mesh sides. Each cage was equipped with semi-automatic feeders and nipple drinkers. Internal room temperature was kept steady, through the use of six heaters in two parallel rows, about 40 cm above floor. These heaters were coupled to a thermostat apparatus regulated for the desirable heat stress temperature and two air conditioners (18 000 BTU each) were also linked to a thermostat regulated for the desirable thermoneutral temperature. The thermostat as well as other environmental-measuring equipment (maximum and minimal temperature thermometers, dry and humid bulbous thermometers, and black globe thermometer) were kept halfway up in an empty cage in the center of the room. Instrumental readings were taken three times a day (0800 h, 1200 h, and 1700 h). Throughout the experiment in the climatic room the environmental temperature and RH were controlled within ±1.2ºC and ±6%, respectively. The experimental diets were mainly composed of corn/soybean meal supplemented with minerals, vitamins and industrial amino acids to meet the requirements of castrated male pigs selected for high-lean meat deposition for each growth phase, as recommended by Rostagno et al. (Reference Rostagno, Albino, Donzele, Gomes, Oliveira, Lopes, Ferreira and Barreto2005), for all the nutrients, except aP. Industrial amino acids were added to diets to keep the relationship among digestible lysine and the other digestible amino acids according to the ideal protein concept for each growth phase, as recommended by Rostagno et al. (Reference Rostagno, Albino, Donzele, Gomes, Oliveira, Lopes, Ferreira and Barreto2005). Dietary concentrations of dicalcium phosphate, limestone and kaolin per treatment were adjusted to achieve concentrations of aP near those recommend by Rostagno et al. (Reference Rostagno, Albino, Donzele, Gomes, Oliveira, Lopes, Ferreira and Barreto2005) for each growth phase. For growth phase 1 the three levels (%) of total P analyzed/available were: 0.344/0.107 (aP1), 0.546/0.321 (aP2), 0.782/0.535 (aP3). In the same way, for growth phase 2 the three different levels were respectively: 0.344/0.116 (aP4), 0.534/0.306 (aP5), 0.724/0.496 (aP6), more details are shown in the supplementary Table 1 and 2 (Appendix 1). Pigs from both growth phases had free access to feed and water throughout the entire experimental period. Pigs were weighed at the beginning and at the end of the experimental period to calculate average daily feed intake (ADFI), average daily gain (ADG) and feed conversion ratio (FCR).
RNA extraction and cDNA synthesis
Muscle samples from the LD were collected during slaughter and immediately immersed in tubes containing 15 ml of RNAHolder® (BioAgency, São Paulo, Brazil) and stored at −20°C for subsequent RNA extraction. The total RNA from each LD sample was isolated using ∼40 mg of tissue previously stored in RNAHolder®. The samples were homogenized in buffer RLT containing 1% β-mercaptoethanol (RNeasy Mini Kit; Qiagen, Valencia, CA, USA) and lysed with a tissue ruptor (Qiagen) homogenizer. The total RNA from the LD muscle samples was extracted with the RNeasy Mini Kit following the manufacturer’s recommendations. Additional treatment with DNase was performed on the columns using the RNase-free DNase Set (Qiagen), according to the manufacturer’s recommendations. RNA concentrations were checked by NanoVue Plus Spectrophotometer (GE Healthcare, Munich, Germany) with an optimal 260/280 ratio between 1.8 and 2.1. Purity and integrity were determined with an Agilent RNA 6000 Nano Kit using the Agilent 2100 Bioanalyzer (Agilent Technologies Inc., Ontario, Canada).
The ProtoScript M-MuLV First Strand cDNA Synthesis Kit (New England, BioLabs Inc., Ipswich, Massachusetts, USA) was used to produce cDNA immediately after the RNA extraction. The reactions were performed with 6 μg of total RNA and 2 μl of 50 μM oligo(dT)23VN primer, following the manufacturer’s recommended protocol. The cDNA concentrations from the samples were estimated on a NanoVue Plus spectrophotometer (GE Healthcare). Finally, the single-stranded cDNA samples were stored at –20ºC for analysis.
Quantitative real-time polymerase chain reaction (qRT-PCR)
From the 10 analyzed genes, seven were chosen based on Lin et al. (Reference Lin, Sun, Liu, Yang, Chang, Cheng, Mao and Huang1999), and their sequences were obtained from the National Center for Biotechnology Information database (http://www.ncbi.nlm.nih.gov; Accession No. AF034253). The sequences based on Lin et al. (Reference Lin, Sun, Liu, Yang, Chang, Cheng, Mao and Huang1999) consisted of seven subunits from enzymatic complexes in the mitochondrial respiratory cascade: ND1, NADH dehydrogenase subunit 1, and ND2, NADH dehydrogenase subunit 2, both from the NADH ubiquinone oxidoreductase (complex I); CYTB, Cytochrome b, from the ubiquinone cytochrome c reductase (complex III); COX1, Cytochrome oxidase subunit 1; COX2, Cytochrome subunit 2; and COX3, Cytochrome subunit 3; from Cytochrome c oxidase (complex IV); and ATP6, ATPase subunit 6, from the F1F0 ATPase complex (complex V).
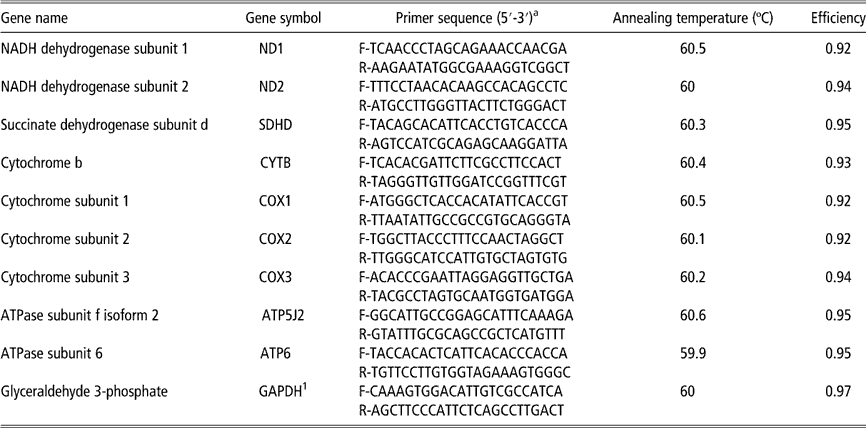
The other three genes, succinate dehydrogenase subunit d (SDHD), which is part of the succinate ubiquinone reductase complex (complex II); ATP5J2, ATPase subunit f, isoform 2 (complex V); and glyceraldehyde 3-phosphate dehydrogenase (GAPDH), were obtained from the nuclear genome of Sus scrofa (Accession No. NM_001097516.1, NM_001097464.1 and AF017079.1, respectively). The primers for the 10 genes were designed using PrimerQuest (www.idtdna.com/Scitools/Applications/PrimerQuest), provided by Integrated DNA Technologies Inc. (Coralville, IA, USA). GAPDH gene was used as the reference gene for normalization, as it showed higher efficiency and less variation across treatments than β-actin (data not shown). The primer pairs and amplification efficiencies of each target are listed in Table 1.
Gene names, primer pair sequences, annealing temperatures and amplification efficiencies of each target

a F=forward; R=reverse.
1 Reference gene.
qRT-PCR reactions were performed using the GoTaq® qPCR Master Mix (Promega Corporation, Madison, WI, USA) following the manufacturer’s instructions in an ABI Prism 7300 Sequence Detection System thermocycler® (Applied Biosystems, Foster City, CA, USA). The reaction consisted of an initial step at 95ºC for 10 min, a second step of 40 cycles with the same temperature for 15 s and a final extension step at 60ºC for 60 s. After the amplification cycles, an additional gradient step from 60ºC to 95ºC was used to obtain a melting curve. The measurement in qRT-PCR experiment is expressed in cycles to threshold (C t) of PCR; a relative value that represents the cycle number at which the amount of amplified cDNA reaches the threshold level. The efficiency of each reaction was assessed in order to choose the best combination of cDNA and primer concentration in the subsequent reactions. Once the slope of a linear regression, established between the cDNA log and the C t value, for each primer concentration was obtained, the PCR efficiency (E) was calculated using the following formula: E=10(--1/slope). The amplification efficiency for all tested genes varied from 0.92% to 0.97% (Table 1). All reactions were done in duplicate and the coefficient of variation (CV) of C t values from replicates within each sample was low, <5%, indicating acceptable accuracy and reproducibility (not shown).
Statistical analyses
Performance data were analyzed as factorial arrangement of six treatments in a randomized block design using the GLM procedures of SAS software, with four animals per treatment in each growing phase. Means were compared by the test of Tukey to the level of 5%. Statistical analysis of C t data in each growing phase was realized using %QPCR_MIXED macro SAS® (https://www.msu.edu/~steibelj/JPfiles/QPCR.html) developed to generate codes in SAS PROC MIXED suitable to analyze data from qRT-PCR, assuming independent random effects for reference and target genes in each biological replicate (Steibel et al., Reference Steibel, Poletto, Coussens and Rosa2009). This statistical method is more accurate, powerful and flexible than existing alternatives for analysis of relative quantification qRT-PCR data, and it is especially useful in more complex experimental designs, involving more than two treatments or time points and multiple experimental factors. The following model was used:
 $$y_{{gikr}} \,=\,TG_{{gi}} \,{\plus}\,{\rm }C_{{gik}} \,{\plus}\,D_{{ik}} \,{\plus}\,b\,(W_{{ik}} - \,\bar{W}\,)\,{\plus}\,e_{{gikr}} $$
where y gikr corresponds to the C t value obtained from the thermocycler software for the gth gene (reference or targets) from the rth well, which corresponds to the kth animal submitted to the ith treatment (environmental temperatures and aP level combination); TG gi the effect of the ith treatment on the expression of gene g; C gik~N(0,  $$\sigma _{{\rm C}}^{{\rm 2}} $$
) the gene-specific random effect of the kth animal; D ik~N(0,
 $$\sigma _{{\rm D}}^{{\rm 2}} $$
) the sample-specific random effect (common to reference and target genes); W ik the covariate slaughter weight of the kth animal submitted to the ith treatment;
 $$\overline{{ W}} $$
the mean of the slaughter weight; b the regression coefficient; and e gikr~N(0,
 $$\sigma _{{\rm e}}^{{\rm 2}} $$
) the residual term. The treatments, inside each growth phase, consisted of combination of two factors and the sub-index i=1, 2, …, 6 corresponds respectively to: aP1+24°C, aP2+24°C, aP3+24°C, aP1+34°C, aP2+34°C, aP3+34°C in phase 1. For the growth phase 2, the sub-index i corresponds respectively to: aP4+22°C, aP5+22°C, aP6+22°C, aP4+32°C, aP5+32°C, aP6+32°C.
The fold change values were estimated with the  $2^{{{\minus}\Delta C_{{\rm t}} }} $
method (Livak and Shmittgen, Reference Livak and Shmittgen2001). The ΔC t are estimates of comparison of C t values between treatments for the normalized target genes. For each target gene, the comparison of C t values across treatments, inside each phase, was performed by CONTRAST statement of the GLM procedure (SAS software) using Student’s t-test to the level of 5%. Once the efficiency (E) of the qRT-PCR reaction was close 100%, one PCR cycle of difference between two samples means twice as much expression in the first sample in comparison with the second. Also, understanding that higher C t values means lower transcriptional expression of a specific gene for a specific sample relatively to others, negative values of ‘estimates’ indicate a positive fold change (relative expression change) of the first sample relative to the second.
Results
Pig performance
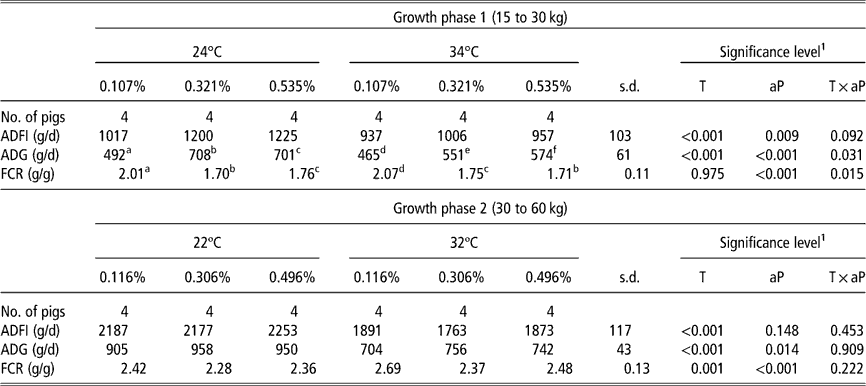
There was no interaction between environmental temperature and dietary aP levels on ADFI at both growth phases (Table 2). Pigs from growth phase 1 housed in the 34ºC environment decreased ADFI (P<0.001) compared with pigs housed at 24°C. Likewise, pigs from growth phase 2 kept in the heat stress (32°C) had lower ADFI (P<0.001). There was interaction between environmental temperature and dietary aP levels on ADG and FCR in pigs from growth phase 1. Table 2 shows that in the 24°C environment pigs from phase 1 fed 0.321% aP diet had greater ADG and FCR (P<0.05) than those fed the 0.107% or 0.535%. In the heat stress, pigs fed the 0.535% aP had greater ADG and feed conversion than pigs fed 0.321% or 0.107%. As shown in Table 2, no temperature×dietary aP levels interaction was detected for ADG and FCR in pigs from growth phase 2. At both environmental temperatures pigs fed the 0.306% aP had higher ADG (P<0.05) and greater feed conversion (P<0.05) compared with pigs receiving the 0.116% or 0.496%.
Effects of ambient temperature and levels of dietary aP on pig performance (least squares means)
ADFI=average daily feed intake; ADG=average daily gain; FCR=feed conversion ratio.
1 Effects of ambient temperature (T), levels of dietary aP (aP) and their interaction (T×aP).
a,b,c,d,e,fMeans in the same row with different superscripts letters are statistically different (P<0.05).
qRT-PCR
Relative expression changes (fold change) results, inside each growth phase, were interpreted by contrast comparison pairwise within each factor: aP levels or environmental temperatures, since interaction between these factors was observed for the gene expression analysis in both growth phases. The entire statistical results for each contrast across treatments are shown in the supplementary Tables 3 and 4 (Appendix 1). The results for qRT-PCR analysis in LD of pigs from phase1 showed higher expression of ND1, ND2, CYTB, COX3, ATP5J2 and ATP6 genes in the thermoneutral environment, when compared with the heat stress (Figure 1). There were no differences in expression of COX1, COX2 and SDHD genes between thermal environments, irrespective of aP levels. Likewise, the results for qRT-PCR analysis in LD of pigs from phase 2 revealed higher expression of ND2, CYTB, COX2, COX3, ATP5J2 and ATP6 genes in the thermoneutral environment, when compared with the heat stress (Figure 1). There were no differences in expression of ND1, COX1 and SDHD genes between thermal environments, irrespective of dietary aP levels.
Relative expression (fold change) values between the thermal environments within each level of available phosphorus (aP) in growth phase 1 (a) and growth phase 2 (b) for each target gene. Bars above the origin means higher expression at thermoneutral relative to the heat stress for each level of aP evaluated. *P<0.05; **P<0.01; ***P<0.001.
Pigs from phase 1 kept in the thermoneutral environment had higher expression of the ND1 (P<0.05), ND2 (P<0.05), COX3 (P<0.05), CYTB (P<0.05), ATP5J2 (P<0.01) and ATP6 (P<0.05) genes when fed the 0.321% aP diet compared with pigs fed the 0.535% aP diet. None of the studied genes showed differential expression to the contrast 0.107% v. 0.321% aP in the thermoneutral environment. The ND2 gene revealed (P<0.01) lower expression in pigs fed 0.321% compared with those fed 0.535% aP kept under heat stress (Figure 2). This same gene exhibited (P<0.01) lower expression in pigs fed 0.107% than in pigs fed 0.535% aP (Figure 2). No difference in the expression of the SDHD, COX1 and COX2 genes to the contrast: 0.321% v. 0.535% aP and 0.107% v. 0.535% aP in the thermoneutral environment was observed. The CYTB (P<0.01), COX3 (P<0.05), ATP5J2 (P<0.01) and ATP6 (P<0.05) genes had higher expression in pigs fed the 0.107% compared with pigs fed 0.535% aP in the thermoneutral environment (Figure 2). There were no differences in the expression of the ND1, SDHD, COX2, COX3, CYTB, ATP5J2 and ATP6 genes for any contrast between aP in pigs kept under heat stress.
Relative expression (fold change) values for six genes that exhibited differential expression between 0.321% and 0.535% aP (a) or between 0.107% and 0.535% aP (b) within each thermal environment in pigs from growth phase 1. Bars above the origin means higher expression at first level relatively to second. *P<0.05; **P<0.01.
None of the studied genes showed differential expression to the contrast 0.116% v. 0.496% aP. Only the COX3 gene exhibited higher expression (P<0.05) in pigs fed the 0.306% compared with those fed the 0.116% aP in the thermoneutral environment (Figure 3). This same gene revealed (P<0.05) higher expression in pigs fed the 0.306% compared with those fed 0.496% aP under thermoneutral temperature (Figure 3). There were no differences in the expression for the other studied genes to the contrast: 0.306% v. 0.116% and 0.306% v. 0.496% aP in the thermoneutral environment. In heat stress, only the ND2 gene exhibited higher expression (P<0.05) in pigs fed the 0.306% aP diet compared with those fed the diet with 0.116% aP. This gene also had higher expression (P<0.01) in pigs fed the diet with 0.306% aP than in pigs fed the 0.496% aP diet (Figure 3).
Relative expression (fold change) values for two genes that exhibited differential expression between 0.306% and 0.116% aP (a) or between 0.306% and 0.496% aP (b) within each thermal environment in pigs from growth phase 2. Bars above the origin means higher expression at first level relatively to second. *P<0.05; **P<0.01.
Discussion
Effects of the heat stress on the electron transport chain gene expression
Our performance results are in accordance with several studies which demonstrated negative impacts of high temperatures on pig performance in growing and finishing pigs (Quiniou et al., Reference Quiniou, Dubois and Noblet2000; Collin et al., Reference Collin, Lebreton, Fillaut, Vicent, Thomas and Herpin2001a; Renaudeau et al., Reference Renaudeau, Collin, Yahav, Basilio, Gourdine and Collier2012), including reduced voluntary daily feed intake and daily weight gain (Collin et al., Reference Collin, van Milgen, Dubois and Noblet2001b; Kerr et al., Reference Kerr, Yen, Nienaber and Easter2003; Renaudeau et al., Reference Renaudeau, Gourdine and Pierre2011). In contrast, very little has been published on the effects of the thermal environment on the regulation of genes involved in energy metabolism. This is the main point of the present work.
Considering that the activity of the electron transport chain (ETC) is closely related to the levels of gene expression encoding subunits of each complex, it is possible to associate the decrease in the ETC activity, induced by heat stress, with lower expression of specific protein subunits within each ETC complex. In the present study, heat stressed pigs exhibited lower expression for ETC genes, when compared with those in thermoneutral environment. Our results provide evidence of high environmental temperatures effect on the reduction of the oxidative metabolism (oxidative phosphorylation), throughout adaptive physiological mechanisms in order to reduce metabolic heat production. This observation is consistent with results from Nicol and Johnston (Reference Nicol and Johnston1981), Rinaldo and Dividich (Reference Rinaldo and Dividich1991) and Collin et al. (Reference Collin, Lebreton, Fillaut, Vicent, Thomas and Herpin2001a) who revealed that enzymes involved in oxidative metabolism and glycolysis in muscle have reduced activity in heat stressed pigs.
In the present study, heat stressed pigs from growth phase 2 showed lower expression for ND2, CYTB, COX2, ATP6 genes (Figure 1) than pigs from growth phase 1, demonstrating the modulation of age and BW on the effect of thermal environment. Consistent with results for gene expression analysis, it can be observed that pigs from growth phase 2 had higher reduction on ADG and worst feed conversion under heat stress than pigs from growth phase 1 (Table 2). Our findings also indicated that exposure to high temperatures resulted in reduced expression of ND1 and COX3 genes in phase 1 when fed diets containing 0.107% and 0.321% aP and reduced ND2 gene expression when fed 0.535% aP. Similarly, exposure of pigs in phase 2 to heat stress also reduced the expression of the ND2, COX2 and COX3 genes, regardless of aP levels and reduced expression of the COX1 gene in pigs fed 0.306% aP. ND1 and ND2 are part of the P module of the NADH : ubiquinone oxidoreductase complex (complex I), which is responsible for pumping protons through the mitochondrial inner membrane (Brandt, Reference Brandt2006). Therefore, changes in these genes must be critical for proper functioning of the ETC and mitochondrial efficiency. COX1, COX2 and COX3 are essential proteins of the Cytochrome c oxidase complex (complex IV) and are responsible for electron transfer and proton pumping. They are extremely important for mitochondrial efficiency and thus for ATP production (Scheffler, Reference Scheffler1999). The CYTB gene demonstrated the largest expression reduction in response to heat stress either in phase 1 or 2, irrespective of dietary aP levels. CYTB is an essential subunit of the functional center of the ubiquinol-cytochrome-c reductase complex (complex III) and catalyzes the transfer of electrons from ubiquinol to cytochrome c (Yu et al., Reference Yu, Tian, Zhang, Deng, Shenoy, Yu, Xia, Kim and Deisenhofer1999). Therefore, it has been widely used to evaluate mitochondrial activity (Carper et al., Reference Carper, Sun, Iwata, Sigler, Ibaraki, Lin and Reddy1999; Iqbal et al., Reference Iqbal, Pumford, Tang, Lassiter, Wing, Cooper and Bottje2004). In addition, we also observed reduced expression of the ATP6 gene in heat stressed pigs from phase 2, irrespective of dietary aP levels (Figure 1). ATP6 is a key component of the proton channel of the F1F0-ATPase complex (Nagley, Reference Nagley1988).
Effects of dietary P levels on electron transport chain gene expression
Nutrigenomics approaches have been used to provide a molecular understanding of how common dietary components and nutritional strategies effect animal growth and tissue development by altering the gene expression (Costa et al., Reference Costa, Mc Gillivray, Bai, Wood, Evans and Chang2004; Byrne et al., Reference Byrne, Wang, Lehnert, Harper, Mc Willian, Bruce and Reverter2005). Nutrigenomics studies in pigs are still rare, but they are become important as we develop an understanding about the relationship between nutrition, tissue growth and performance.
Few studies have been done to elucidate the effects of dietary P levels on gene expression (Hittmeier et al., Reference Hittmeier, Grapes, Lensing, Rothschild and Stahl2006; Alexander et al., Reference Alexander, Qu, Cutler, Mahajan, Lonergan, Rothschild, Weber, Kerr and Stahl2008). The results obtained in our study revealed that different aP levels in the diet altered the expression of the electron transport chain genes. Phosphate (Pi) has been demonstrated to directly influence dehydrogenases and other enzymes involved in the oxidative phosphorylation (Rodrigues-Zavala et al., Reference Rodrigues-Zavala, Pardo and Moreno-Sánchez2000). In addition, Bose et al. (Reference Bose, French, Evans, Joubert and Balaban2003) studied the effects of Pi on various steps of the oxidative phosphorylation in pig cardiac mitochondria and showed that Pi regulated oxidative phosphorylation at several levels, including the generation of NADH, the formation of the proton electrochemical gradient and directly as a substrate for ATP formation by the F1F0-ATPase.
During phase 1, the expression of ND1, ND2, CYTB, COX3, ATP5J2 and ATP6 genes were higher in pigs fed 0.321% aP compared with those receiving 0.535% aP in the thermoneutral environment (Figure 2). It can be postulated that the lower gene expression observed in pigs receiving 0.535% compared with those that received 0.321% aP is related to the aP intake. This is in agreement with the performance results of pigs fed different aP levels and kept under thermoneutral environment, reported by Alebrante et al. (Reference Alebrante, Donzele, Oliveira, Saraiva, Guimarães and Ferreira2011a) who verified that aP levels above 0.461%, which corresponded to a daily aP intake of 5.45 g, affected negatively the performance of the pigs. Thus, pigs receiving 0.535% aP consumed above the requirement compromising the ETC gene expression. Furthermore, this is consistent with the performance results of pigs fed 0.321% aP, which showed a better ADG and feed conversion than pigs receiving 0.535% or 0.107% aP. In the present study, therefore it was evidenced that pigs are susceptible to inappropriate levels of P in the diet.
Interestingly, we observed higher expression of CYTB, ATP6, ATP5J2 and COX3 genes in pigs fed the diet with 0.107% aP compared with those fed 0.535% aP in the thermoneutral environment (Figure 2), indicating that feeding sub-optimal aP levels may be less harmful to the expression of the ETC genes in comparison to excess. This is in agreement with Fernández (Reference Fernández1995), who evaluated the implications of increased aP intake on growing pigs, and found that increased aP consumption did not result in higher P utilization for metabolism. On the contrary, pigs reduced bone reabsorption and increased urinary P excretion in response to increased intake of this nutrient.
Our results indicated a higher expression of the ND2 gene for the pigs fed 0.535% aP, compared with pigs fed 0.107% and 0.321% aP in the heat stress environment. These results showed the effects of heat stress which decreased voluntary feed intake and, therefore, pigs that received 0.535% aP in the diet consumed 5.12 g/day aP, in contrast to animals kept under thermoneutral temperature with daily aP intake of 6.55 g, which is closer to the requirements (0.475% aP) determined in the performance study conducted by Alebrante et al. (Reference Alebrante, Donzele, Oliveira, Saraiva, Guimarães and Ferreira2011b). This is confirmed by performance results of pigs fed 0.535% aP that showed an improved ADG and feed conversion when compared with pigs fed 0.107% and 0.321% aP.
During phase 2, we observed higher expression of COX3 gene in the pigs fed 0.306% aP compared with pigs fed 0.116% and 0.496% aP in the thermoneutral environment (Figure 3). These findings are in agreement with the performance results of pigs fed 0.306% aP that showed an improved feed conversion and higher ADG when compared with pigs fed 0.116% and 0.496% of aP in the thermoneutral environment. Similarly, the diet with 0.306% aP led to an increased ND2 gene expression compared with the other diets in the heat stress environment.
These results support that higher gene expression is associated with better respiratory chain function, resulting in improved ATP production efficiency. The association between oxidative phosphorylation and animal performance found in our study is consistent with studies that compared the performances of beef cattle (Archer et al., Reference Archer, Richardson, Herd and Arthur1999; Castro-Bulle et al., Reference Castro-Bulle, Paulino, Sanches and Sainz2007) and poultry (Bottje et al. Reference Bottje, Iqbal, Tang, Cawthon, Okimoto, Wing and Cooper2002; Bottje and Carstens, Reference Bottje and Carstens2009) with mitochondrial function. For instance, Bottje et al. (Reference Bottje, Iqbal, Tang, Cawthon, Okimoto, Wing and Cooper2002) suggested that the differences in performance of genetically similar animals might be partially due to mitochondrial inefficiency, as the mitochondria are responsible for 90% of the cellular production of ATP.
Conclusion
Results of the present study reveal that exposing pigs to high temperatures results in reduction on voluntary daily feed intake, which reflected in decreased ETC gene expression and also in their enzymatic activities. These findings indicate physiological and biochemical adaptations to reduce metabolic heat production, during heat stress, which may be linked to the heat-induced increase in ROS. To confirm this hypothesis, further studies are being conducted by our team to assign expression profiles of genes encoding mitochondrial antioxidant systems that neutralize ROS. We also showed that different amounts of aP alter ETC gene expression. However the actual mechanisms responsible for the distinct patterns of gene expression cannot be determined from the present study, but this may indicate that the ETC genes are differentially affected by dietary aP levels. This might reflect in different function of each enzymatic complex, according to environmental temperature or nutrition effects. However, we can state that in general, in pigs from phase 1 the level of 0.321% aP under thermoneutral environment and the level of 0.535% aP for heat stressed pigs led to higher ETC gene expression reflecting better pig performance, while for pigs in growth phase 2 was the level of 0.306% aP at both thermal environment. All together, these data reveal strong evidence that the nutrient P, as well as environmental temperature, are key factors regulating oxidative phosphorylation with direct implications on animal performance.
Acknowledgments
The authors gratefully acknowledge CNPq, FAPEMIG, INCT-CA, CAPES and the European Commission under LowInputBreeds, FP7-project No. KBBE 222 632 for their support to this research.