To prevent parturient paresis, cows are fed anionic salts (AS) in combination with total mix rations for the last 3 weeks before parturition (Staufenbiel, Reference Staufenbiel2000; Oetzel, Reference Oetzel, Kaske, Scholz and Höltershinken2002). AS activate calcium metabolism as a response to the induced metabolic acidosis (Block, Reference Block1984). To fulfil the optimal effect, a high level of feeding management is necessary. A reduction of feed intake, which results in lower AS intake and therefore no prophylactic effect at all, must be avoided (Oetzel & Barmore, Reference Oetzel and Barmore1993). To calculate the amount of AS needed, the dietary cation-anion difference (DCAD) of the diet has to be determined. DCAD commonly is measured as mEq/kg dry matter (DM), comprising the amounts of the major cations, sodium and potassium, reduced by the amounts of the major anions, chloride and sulphate (Oetzel, Reference Oetzel, Kaske, Scholz and Höltershinken2002). DCAD is the common parameter to monitor the correct mixing of AS to guarantee the metabolic effect in cows (Horst et al. Reference Horst, Goff and Reinhardt1994). The DCAD of a total mix ration (TMR) including AS has to be considerably lower than zero (Kamphues, Reference Kamphues1996), indicating a surplus of anions in the ration. Intake of AS is poor, because of their low palatability and therefore transition cows should be monitored to ensure an adequate intake of AS. Commonly, urine pH is considered as an adequate parameter for monitoring AS intake of cows (Oetzel, Reference Oetzel, Kaske, Scholz and Höltershinken2002). Urine pH values should be between 6 and 7 (Fürll et al. Reference Fürll, Läkel, Bauerfeld and Groppel1996). Recent work has shown that both DCAD and urine pH are not appropriate parameters for monitoring the effective use of AS (Gelfert et al. Reference Gelfert, Zarrath, Eustermann and Staufenbiel2004). In that study, although feed analysis confirmed the correct mixing of AS, DCAD did not drop below zero and urinary pH showed only marginal decreases, remaining in physiological ranges. On the other hand, net acid-base excretion (NABE) in urine of those cows was low and calcium excretion via the kidneys was increased. These findings indicate that feed, containing AS and having a positive DCAD, induces a metabolic acidosis and activates calcium mobilization as an effect of compensation. Bender et al. (Reference Bender, Gelfert and Staufenbiel2003) made similar observations previously. It should be emphasized that results of such field studies have to deal with fluctuations in the composition of feed and feed intake of cows (Goff et al. Reference Goff, Ruiz and Horst2004) and reliable results are dependent on optimal feeding management (Husband et al. Reference Husband, Green and Jonsson2002). Unnoticeable acidogenic effects would result in similar effects regarding urine composition (Owens et al. Reference Owens, Secrist, Hill and Gill1998). Besides this problem of an undetected acidosis in field studies, there is the problem of clinical acidosis induced by feeding AS. Clinical acidosis occurs when the dosage of AS is too high or the resulting DCAD is too low (Gelfert et al. Reference Gelfert, Klein, Montag, Passmann and Staufenbiel2006a). A certain level of acidosis is necessary to activate calcium metabolism. There is discussion of whether the different AS have different impacts on ABB and calcium metabolism (Vagnoni & Oetzel, Reference Vagnoni and Oetzel1998; Goff et al. Reference Goff, Ruiz and Horst2004). Vagnoni & Oetzel (Reference Vagnoni and Oetzel1998) did not find any differences between six different AS in their impact on ABB. According to the results of their study, Goff et al. (Reference Goff, Ruiz and Horst2004) stated that chloride salts have a greater impact on ABB than sulphate salts. The present study design was established to monitor the effect of various AS on ABB and calcium metabolism of cows. To ensure complete intake of feed and AS, rumen fistulated cows were used. During feeding, AS were administered via rumen cannula, simulating a synchronous intake of food and anionic salts and guaranteeing the complete intake of the AS. The use of dry, non-pregnant cows can be justified by the assumption that their response to the AS may only differ from that of pregnant cows in quantitative but not in qualitative terms.
Materials and Methods
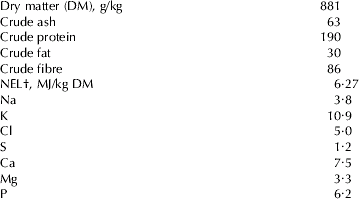
Ten mature, non-lactating, non-pregnant, Holstein-Friesian crossbred cows, 5–10 years old, were used. Cows were housed individually in tie stalls at the Clinic for Ruminants and Swine of the Free University of Berlin. They were kept on a concrete floor and provided with straw bedding. After a period of adjustment, the cows received a permanent rumen fistula, according to the method by Goetze (Reference Götze and Aehnelt1934). After insertion of the fistula a 4-week adaptation followed. For the entire duration of the study, the daily diet consisted of 8 kg hay and 2·5 kg of routinely used concentrate and 300 g CaCO3. The concentrate mixture (Table 1) was formulated so that the whole diet met or exceeded the requirements of non-pregnant and non-lactating dairy cows (DLG, 2006). Addition of 300 g CaCO3 guaranteed a daily intake of 120–150 g calcium to meet the needs of cattle receiving AS (Oetzel et al. Reference Oetzel, Olson, Curtis and Fettman1988; Byers, Reference Byers1994; Beening, Reference Beening1998; Staufenbiel, Reference Staufenbiel2000). Water and feed were provided individually. Eating of the straw bedding would have been possible but is unlikely to have been great enough to influence the study. For monitoring of DCAD, hay was analysed by commercial laboratories (Analytical Labor for Agriculture and Environment, Parchim, Germany) every 14 d. After the adjustment period, the cows were assigned to one of nine different batches of AS or combinations of AS. Three chloride salts, four sulphate salts and two combinations of one chloride and one sulphate salt were used (Table 2). Deionized water served as control. All sources of anions were food or reagent grade and at least 97% pure. Dehydrated CaSO4 and dehydrated CaCl2 were provided by Sigma-Aldrich Laborchemikalien, Seelze; all other salts by Merck KG, Darmstadt. Salts and control were assigned in a 10×10 Latin square design. This model was used to randomize the distribution and sequence of the anionic salts tested to avoid any side effects on the parameters tested due to the sequence of the AS. Amounts of AS corresponded to 2 Eq/day (Table 2). One half of the dose was given at each feeding time. All AS were diluted using 2 l twice-deionized water. Water-soluble chloride salts were applied as an infusion via rumen cannula for 1·5 h. Poorly water-soluble sulphate salts and salt combinations were applied as water-suspension via rumen cannula. Control cows received 2 l deionized water as infusion.
Chemical composition of the concentrate (g/kg dry matter unless stated otherwise)

† Net energy for lactation
Amounts of different anionic salts (AS) required to provide a daily dose of 2 Eq

† Amount corresponds to 2 Eq
‡ Natural calcium sulphate with grain size=10 μm
§ Equal equivalents of both AS
Each treatment period (TP) lasted 14 d and was discontinued to the following TP by a washout period (WOP) of the same duration. During every TP and WOP, blood and urine samples were taken 2 h after the morning feeding. Samples were taken on day zero before the first application of AS and on days 4, 7, 11 and 14 of TP and on day 4 of WOP. A midstream urine sample was taken by provoking micturition by manually stimulating the vulva. Blood was collected anaerobically from the jugular vein into a heparinized 2-ml syringe; each syringe was capped, placed on ice and tested for Base excess (BE), bicarbonate concentrations and pH (ABL5, Radiometer, Copenhagen, Denmark). For serum analysis, blood was transported in tubes containing kaolin. Blood was allowed to clot and was centrifuged, within 2 h, at 4000 g for 10 min. Then the serum was transferred into vials and stored at −20°C until the determination of macrominerals was possible. For analysis of calcium, serum was diluted 1:40 and analysed via atomic absorption spectrophotometry (ABL5, Radiometer, Copenhagen, Denmark). The same method was used for analysis of urine samples. A control serum sample and a control urine sample containing defined concentrations of minerals were used to validate the calibration. Urine samples were tested for pH using a pH-meter and the NABE was measured via titration described by Kutas (Reference Kutas1965) and modified by Lachmann (Reference Lachmann1981). Under physiological conditions, NABE is positive with values between 107 and 193 mmol/l (Rossow et al. Reference Rossow, Jacobi, Schäfer, Lippmann, Furcht, Slanina, Vrzgula and Ehrentraut1987). When NABE decreases, it indicates an increased reabsorption of HCO3− due to an increased [H+] secretion in the case of an acidosis. An increase of NABE represents the regulative work of the kidneys in the case of an alkalosis.
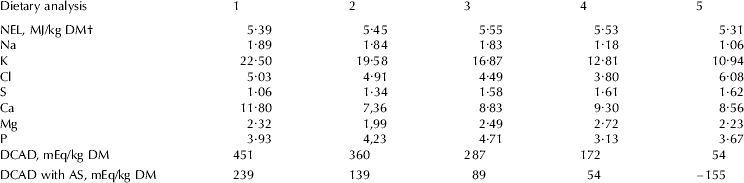
Statistical analysis was performed using SPSS 11.0 (SPSS, Chicago IL, USA). In a first multivariate analysis of variance, DCAD, AS and TP-day served as independent variables. Significant interactions between DCAD and AS (P<0·001) were found. Analysis of the graphs showed that ABB and calcium metabolism reacted similarly to the feeding of AS when DCAD of the single TP were similar. Therefore, DCAD of the ten periods were divided into five groups according to a cluster analysis (Table 3). All following analyses were made for these five DCAD-groups separately. A second multivariate analysis of variance was performed for each DCAD-group separately with AS and TP-day as independent variables. All blood and urine analyses showing a significant effect were used in a repeated measure ANOVA (Littell et al. Reference Litell, Henrz and Ammermann1998) to look for changes in blood and urine parameters over time, using day zero, TP-days 4, 7, 11, 14 and WOP-day 4. AS served as innersubject factor. The cows serving as control were excluded from these analyses. A post hoc Bonferroni test compared the single AS and the single treatment day. Level of significance was fixed at P=0·05.
Concentration (g/kg dry matter uness stated otherwise) of minerals and dietary cation-anion difference (DCAD) in the five DCAD groups before adding the anionic salts (AS)

† Dry matter
All procedures of the study including the cows used accorded with the legal regulations and were approved by Regional Authorities for Employment Protection, Health Protection and Technical Security, Berlin, Germany.
Results
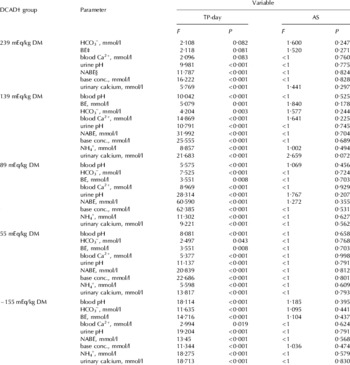
The first multivariate analysis of variance showed that TP-day, AS and DCAD had significant influences on ABB and calcium metabolism. Furthermore, interactions between DCAD and AS occurred (P<0·001). Since the single AS showed similar effects on ABB and calcium metabolism when DCAD were similar, a cluster analysis was performed to create homogenous groups differing in their DCAD. The DCAD of these five groups varied widely from +239 mEq/kg DM to −155 mEq/kg DM when anionic salts were added (Table 3). Only in one group was DCAD below zero. The repeated measures ANOVA revealed that TP-day had a significant influence on the parameters tested (Table 4). No interactions between TP-day and AS were found (P>0·05). AS failed to show a significant effect in all groups (P>0·05).
Test statistics of the Repeated Measure ANOVA with anionic salts (AS) as innersubject factor

† Dietary cation-anion difference
‡ Base excess
§ Net acid-base excretion
Changes in acid-base balance (ABB)
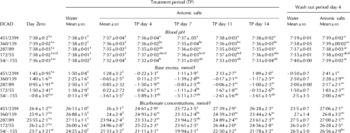
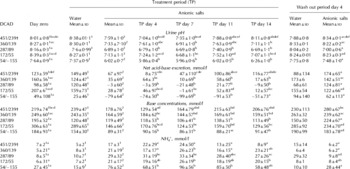
In DCAD group 1 (239 mEq) changes in ABB over time were only seen in urine (P<0·05). However, remarkable changes were restricted to the first week of TP (Tables 5–6). In the second week, urine parameters of ABB turned back towards initial values, showing no acid load at the end of TP. Concerning time, no significant changes in blood were detectable during the entire TP (P>0·05). BE, SBC and pH remained nearly unaffected and within normal ranges.
Blood pH, base excess and bicarbonate concentrations in cows fed different anionic salts or water in feed with varying dietary cation-anion difference (DCAD). Values are means±sd for n=10

† The first value is the DCAD for the control diet, the second value characterizes the DCAD dropped by the anionic salts
1,2 Mean values with different superscripts differed significantly (P<0·05) between day Zero and TP-days
a,b,c,d Mean values without a common superscript letter differed significantly (P<0·05) between the single day during TP and day zero
Urine pH, Net acid-base excretion (NABE) and ammonium concentrations in cows fed different anionic salts or water with varying dietary cation-anion difference (DCAD). Values are means±sd for n=10

† The first value is the DCAD for the control diet, the second value characterizes the DCAD dropped by the anionic salts
1,2 Mean values with different superscripts differed significantly (P<0·05) between day zero and TP-days
a,b,c,d,e,f Mean values without a common superscript letter differed significantly (P<0·05) between the days during TP
In the DCAD groups 2–4, changes in urine were more pronounced than in the first group. NABE and base concentrations dropped significantly on most TP-days. In DCAD group 2 (139 mEq) urine pH showed strong and significant reactions on TP-days 7 and 14 and on all TP-days in DCAD groups 3 (89 mEq) and 4 (55 mEq). In those three DCAD-groups a slight trend towards initial values was visible in all parameters on day 11, which was not visible anymore on TP-day 14. SBC and pH in blood showed significant changes during TP in these three groups. Changes in ABB lasted the entire TP and were more pronounced than in DCAD group 1 (239 mEq). For urine parameters, changes were not as distinct on TP-day 11. Compared with the changes in urine, blood parameters varied only slightly and blood pH remained within normal ranges in DCAD groups 2, 3 and 4.
In DCAD group 5 (−155 mEq), parameters in urine were clearly outside the physiological ranges on all TP-days, reflecting the high acid load. At TP-day 11 the same trend was visible as in the other DCAD-groups. It also continued on TP-day 14, resulting in smaller deviations than in the first week of the TP. Blood parameters reacted significantly (P<0·05) to AS applied, showing values outside the physiological ranges as well.
Comparing the five DCAD groups showed that the values of the parameters measured differed on day zero, reacting to the decreasing DCAD with signs of acidosis. Especially in DCAD group 5 (−155 mEq) urine pH, NABE and ammonium concentrations were outside their physiological ranges, representing the acid load, whereas pH values in blood were at their lower limit, although no animal received AS on that day. The acidosis remained at this level during TP in the control cows (Tables 5–6). In cows receiving AS, changes in ABB parameters were more evident and the values of the single parameters were clearly outside their physiological ranges.
On WOP-day 4 all parameters returned to initial values (Tables 5–6) and no signs of acidosis were detectable in DCAD groups 1–4. In DCAD group 5 (−155 mEq) NABE, ammonium concentrations and urine pH did not reach the initial values of day zero although there was a strong trend towards them. However, these differences were not significant (P>0·05) compared with day zero.
Changes in calcium metabolism
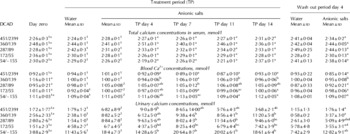
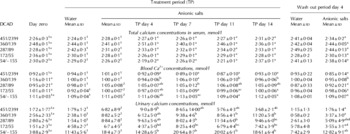
In DCAD group 1 (239 mEq) total calcium concentrations and Ca2+ concentrations did not show any significant reaction (P>0·05) due to TP-day (Table 7) or intake of AS. Only on TP-day 4 the urine calcium concentrations differed significantly (P<0·05) from day zero. On the remaining days of TP, urine calcium concentrations decreased steadily. No significant changes due to AS intake were detectable (P>0·05).
Concentrations of calcium and ionized calcium in serum and urine of cows fed different anionic salts or water in feed with varying dietary cation-anion difference (DCAD). Values are means±sd for n=10
† The first value is the DCAD for the control diet; the second value characterizes the DCAD dropped by the anionic salts
1,2 Mean values with different superscripts differed significantly (P<0·05) between day zero and TP days
a,b,c,d Mean values without a common superscript letter differed significantly (P<0·05) between the days during TP
Total calcium concentrations in serum did not show any significant reactions in the remaining four groups as well. Ca2+concentrations showed different reactions in DCAD groups 2–5. In DCAD group 2 (139 mEq/kg) Ca2+ concentrations were lower on TP-days 4, 11 and 14 than on day zero. On day zero, Ca2+ concentrations were very high (1·16 mmol/l). In DCAD groups 3–5, Ca2+ increased slightly on TP-day 7 (Table 7), but it was only significantly different from day zero in group 3. Again, Ca2+ concentrations did not show different reactions in response to different AS (P>0·05). In the DCAD groups 2–5, urine calcium concentrations increased and differed significantly from day zero (P<0·001). Highest concentrations were measured on TP-day 7. The reaction of ABB on TP-day 11 was accompanied by a slight reduction of calcium concentrations in the urine. In DCAD groups 2 and 4, calcium excretion increased again on TP-day 14 whereas in the other two groups (3 and 5) the decrease continued moderately and remained at an elevated level.
On WOP-day 4, calcium concentrations in urine had returned to their initial values in all but one group. In DCAD group 5 (−155 mEq), calcium excretion in urine was still elevated on WOP-day 4 although it was not significantly different from day zero (P<0·05).
Discussion
Feeding AS is a common method of preventing peripartal hypocalcaemia and parturient paresis. The influence of AS on ABB in cows is controversial in the literature (Oetzel et al. Reference Oetzel, Fettman, Hamar and Olson1991; Goff et al. Reference Goff, Ruiz and Horst2004). Many authors did not observe significant changes of ABB in blood samples (Tucker et al. Reference Tucker, Hogue, Waterman, Swenson, Xin, Hemken, Jackson, Adams and Spicer1991a, Reference Tucker, Hogue, Adams, Aslam, Stim and Morgan1992; Fürll et al. Reference Fürll, Schäfer, Amin and Kirchbach1994; Vagnoni & Oetzel, Reference Vagnoni and Oetzel1998). The main reason for this effect is the organism's immediate regulative response to any acid load, resulting in the different outcomes in such studies and the small differences between the test and control groups in some of them (Tucker et al. Reference Tucker, Hogue, Adams, Aslam, Stim and Morgan1992; Vagnoni & Oetzel, Reference Vagnoni and Oetzel1998). Other reasons for the different observations might be the variability in AS tested, the amounts of AS fed, the study design and the feeding behaviour of the cows. In field studies, other causes of acidosis cannot be excluded completely (Gelfert et al. Reference Gelfert, Zarrath, Eustermann and Staufenbiel2004). DCAD also seems to have an impact on the ability of AS in changing ABB. Therefore, the present trial included a controlled feeding regime in the investigation of the influence of anionic salts on the metabolism of dairy cows. Statistical analysis showed an interaction of DCAD and AS. For a better understanding of the changes induced by AS, we decided to compare the impact of the single AS in groups varying in their DCAD. During the entire experiment, the monitoring of ruminal fluid showed no ruminal acidosis (data not shown) and no other causes of metabolic acidosis were detected.
The first interesting results were the reactions of ABB and calcium metabolism after AS application even though DCAD was still and clearly positive. The reactions of ABB followed the same direction in all DCAD groups. Decreasing DCAD in the diet without AS was mainly associated with a reduction in the concentrations of potassium in the different batches of hay (Table 3). The application of AS causes a sudden change in the ratios of cations and anions. To maintain electrical neutrality the organism generates more [H+] reducing BE, SBC and provoking a compensating response of the kidneys. This reaction differed between the five DCAD groups with respect to the amplitude of parameter changes in blood and urine and the length of time the acidosis was detectable. In all DCAD groups, the strongest reactions occurred on TP-day 7. Changes were lower on TP-day 11 than on day 7. In DCAD group1 (239 mEq), these reduced reactions of the parameters continued and no acidosis was measurable on TP-day 14. Furthermore, significant changes of ABB were detectable in urine (pH, NABE, base concentrations) only. However, pH in blood remained unaffected and so did the other blood parameters. Delaquis & Block (Reference Delaquis and Block1995) monitored changes in ABB in cows fed a diet with a high DCAD and containing AS. They found no reaction of urinary pH. On the other hand, recent studies found a definite response of ABB to AS in cows fed a diet with a positive DCAD (Bender et al. Reference Bender, Gelfert and Staufenbiel2003; Gelfert et al. Reference Gelfert, Zarrath, Eustermann and Staufenbiel2004). The authors describe a definite reaction of ABB and calcium mobilization, detectable through the decrease of NABE and the increase of calcium concentrations in urine. However, the authors also state that due to the field conditions of their studies other reasons for the reactions in urine parameters (e.g. subclinical rumen acidosis) could have been possible, although not detected. From the present findings, it can be concluded that the application of AS induced an acidosis regardless the DCAD value reached. This acidosis was completely compensated when DCAD was still positive. Moreover, it disappeared completely after a certain time in DCAD group 1 as if the organism had learned to deal with the supply of AS without using compensating mechanisms.
In the other four DCAD groups, the changes of ABB were more pronounced, lasting throughout the trial. Acidosis was also visible in the blood parameters. Tucker et al. (Reference Tucker, Xin and Hemken1991b) found similar results. They fed different amounts of calcium chloride to non-pregnant and non-lactating dairy cows for 3 weeks and compared the alterations of ABB among the different groups. Feeding the highest concentrations caused the lowest DCAD and the strongest effects on ABB. Roche et al. (Reference Roche, Dailey, Moate, Grainger, Rath and O'Mara2003a) monitored the impact of AS in a similar study. According to their results, DCAD must be lower than 160 mEq/kg DM to affect ABB and calcium mobilization sufficiently, which confirms the observations seen in DCAD group 2 (139 mEq) of the present study. A meta-analysis using data from 21 studies was made to predict pH in urine from the DCAD of the diet (Spanghero, Reference Spanghero2004). Values of urinary pH measured in the studies and those calculated by the meta-analysis were similar to those obtained in the present study. However, in our study urinary pH was below seven, even when DCAD was still positive which is contrary to the calculations made by Spanghero (Reference Spanghero2004). Tucker et al. (Reference Tucker, Xin and Hemken1991b) found that the amount of AS fed must be limited to prevent detrimental effects on ABB. Our results agree with theirs for we found a very strong reaction of NABE, base and ammonium concentrations in DCAD group 5. A negative NABE is an indicator for a non-compensated acidosis (Bender et al. Reference Bender, Gelfert and Staufenbiel2003). In that case, the risk of a breakdown of the compensating capacity and resulting clinical acidosis is increased. The cows stop eating (Gelfert et al. 2006a), which leads to a severe negative energy balance followed by an increased risk of ketosis and fatty liver.
Another interesting result of our study is the dynamic of the changes of ABB parameters in the second week of TP. On TP-day 11, effects of AS seemed to be smaller than on TP-days 7 and 14. In the study of Tucker et al. (Reference Tucker, Xin and Hemken1991b) slight reductions in [H+] concentrations in the second week of a 3-week feeding experiment could be seen in the charts but were not analysed. In another study, AS were fed for 5 weeks (Gelfert et al. Reference Gelfert, Löptien, Montag, Baumgartner and Staufenbiel2006b). The authors also described dynamic changes in ABB in the second week of feeding AS.
In dealing with the acid load, the organism generates HCO3− from bone (Lunn & McGuirk, Reference Lunn and McGuirk1990) which is accompanied by an increased release of calcium (Delaquis & Block, Reference Delaquis and Block1995; Goff & Horst, Reference Goff and Horst1998). In doing so, the organism is able to remove the increased [H+] concentration. However, this would not explain the renewed reaction of ABB on TP-day 14. Contrary to blood pH, NABE and urinary pH showed the anionic load throughout the whole TP. These inconsistent effects on ABB remain unclear and further investigations are needed. A possible adaptation of the organism to AS would inhibit the prophylactic effect and calcium metabolism would not be activated at parturition. Up to now, similar effects are not described in the literature. The feeding periods of AS in similar studies were shorter than 14 d (Oetzel et al. Reference Oetzel, Fettman, Hamar and Olson1991; Goff et al. Reference Goff, Ruiz and Horst2004) or samples were taken only at the end of the treatment period (Tucker et al. Reference Tucker, Hogue, Waterman, Swenson, Xin, Hemken, Jackson, Adams and Spicer1991a).
Parallel to the changes of ABB, calcium metabolism also showed reactions to the feeding of AS. Through the differing results in the five DCAD groups, the present findings indicate an activation rate of calcium metabolism dependent on the level of acidosis. Accordingly, changes in calcium concentrations were lower in DCAD group 1 than in the other groups. In all five groups, no significant changes were seen in serum concentrations of total calcium, which is confirmed by other reports (Takagi & Block, Reference Takagi and Block1991; Tucker et al. Reference Tucker, Hogue, Waterman, Swenson, Xin, Hemken, Jackson, Adams and Spicer1991a, Reference Tucker, Hogue, Adams, Aslam, Stim and Morgan1992; Vagnoni & Oetzel, Reference Vagnoni and Oetzel1998; Leite et al. Reference Leite, Andriguetto, de Paula and Rocha2003). Due to the strong, hormonal regulation of calcium metabolism (Martens, Reference Martens1995; Hartmann & Brand, Reference Hartmann and Bandt2000), the steady state of calcium concentrations in blood is not surprising. Significant changes in total calcium concentrations were only observed in studies on pregnant cows (Block, Reference Block1984; Oetzel et al. Reference Oetzel, Olson, Curtis and Fettman1988; Moore et al. Reference Moore, van de Haar, Sharma, Pilbeam, Beede, Buchholtz, Liesman, Horst and Goff2000). Takagi & Block (Reference Takagi and Block1991) obtained similar results in calcium concentrations by simulating a greater calcium loss by an EDTA infusion.
In all five DCAD groups, calcium concentrations in urine increased and differed significantly from day zero. On TP-day 7, concentrations reached their maximum, and following the dynamic of ABB, a slight decrease was visible on TP-day 11. The increase of calcium concentrations in urine is described by others (Freeden et al. Reference Freeden, DePeters and Baldwin1988; Vagnoni & Oetzel, Reference Vagnoni and Oetzel1998; Bender et al. Reference Bender, Gelfert and Staufenbiel2003; Roche et al. Reference Roche, Dailey, Moate, Grainger, Rath and O'Mara2003b). Except for DCAD group 1, the calcium concentrations in urine exceeded the recommended threshold value of 5 mmol/l (Bender et al. Reference Bender, Gelfert and Staufenbiel2003). It remains questionable what happened in DCAD group 1 in the second week of TP. Calcium concentrations in urine remained elevated although no acidosis was detected in blood and urine in spite of the AS applied. This increased calcium excretion could be a result of the oversupply due to the feeding of 300 g lime to fulfil the need for calcium when AS are fed (Byers, Reference Byers1994; Beening, Reference Beening1998). This oversupply with calcium increases the rate of passive absorption in the intestine, resulting in an oversupply of calcium in the blood, which is regulated by the kidney (Wang & Beede, Reference Wang and Beede1992; Hartmann & Bandt, Reference Hartmann and Bandt2000). This may mean that in DCAD group 1 no active mobilization of calcium occurred at this time.
Because the cows we used were not pregnant, any statement about a sufficient activation of calcium metabolism to prevent parturient paresis is not possible and was not the purpose of our study. NABE and calcium concentrations in urine met the target ranges (NABE <50 mmol/l, Ca >5 mmol/l) when AS were fed to dairy cows (Bender et al. Reference Bender, Gelfert and Staufenbiel2003). However, the question remains unsolved, whether the increased excretion of calcium was the result of an activated calcium mobilization being strong enough to prevent cows from severe hypocalcaemia in the peripartal period. According to the results of Roche et al. (Reference Roche, Dailey, Moate, Grainger, Rath and O'Mara2003a), the DCAD reached in groups 2–4 was adequate for a sufficient activation of calcium metabolism. However, Moore et al. (Reference Moore, van de Haar, Sharma, Pilbeam, Beede, Buchholtz, Liesman, Horst and Goff2000) stated that adding AS to the cows feed must result in a DCAD below zero to lower the incidence of parturient paresis. The reduction of urine pH to 7·3 was not sufficient according to their results. Takagi & Block (Reference Takagi and Block1991) found that an active reabsorption of calcium in the intestine did not occur until DCAD was below zero. Translating the results of Moore et al. (Reference Moore, van de Haar, Sharma, Pilbeam, Beede, Buchholtz, Liesman, Horst and Goff2000) to our study, the changes of urine pH in DCAD groups 2–4 would not be sufficient. It remains unknown whether the changes monitored in our study were the result of an active calcium mobilization. It is possible that an activation of calcium mobilization does not occur when the acidosis is compensated and no changes of blood pH are visible. Unfortunately, we were not able to monitor any hormones involved in the regulation of the calcium homeostasis. However, the loss of calcium via the kidneys as seen in our study in four of the five DCAD groups would itself activate PTH (Block, Reference Block1994). Further studies with pregnant cows are clearly needed.
The changes of ABB and the increase of urinary calcium concentrations did not differ between the different AS, confirming earlier findings (Oetzel et al. Reference Oetzel, Fettman, Hamar and Olson1991; Vangoni & Oetzel, Reference Vagnoni and Oetzel1998). Others found differences in ABB between chloride and sulphate salts, with chlorides having a stronger impact on ABB than sulphates (Goff et al. Reference Goff, Ruiz and Horst2004). However, these differences were not consistent in all feeding groups. It also occurred that ABB was more strongly affected by sulphate salts. Feeding calcium sulphate in a daily dose of 1500 mEq resulted in a stronger decrease of urinary pH (P<0·05) than did the same dose of calcium chloride (Goff et al. Reference Goff, Ruiz and Horst2004). Tucker et al. (Reference Tucker, Hogue, Waterman, Swenson, Xin, Hemken, Jackson, Adams and Spicer1991a) found slightly stronger reactions of ABB when chloride salts were fed, but the differences were not significant. Wang & Beede (Reference Wang and Beede1992) compared the impact of NH4Cl and MgSO4 on ABB and state that MgSO4 is less acidogenic because of the weaker reactions of ABB monitored. Vagnoni & Oetzel (Reference Vagnoni and Oetzel1998) tested different AS and were not able to show any significant differences in the relative changes of ABB parameters in blood and urine.
The present results show that AS changed ABB significantly although DCAD was positive in four of the five DCAD groups. This confirms the statement of Block (Reference Block1994) that DCAD ‘does not determine the acidogenic or alkalogenic properties of feed but can affect metabolic processes in the animal by the absorption and metabolism of these ions’ The purpose of our study was to screen the different AS for their potential to affect ABB under different DCAD. Further investigations should be carried out to look for the potential of AS to prevent parturient paresis in diets with a high DCAD.
Conclusions
The resulting DCAD, after adding AS to the cows' diet, is an important factor for a sufficient effect of AS on ABB. Even a high DCAD (>200 mEq/kg DM) does not totally inhibit a reaction of ABB. However, the induced changes are compensated within 1 week, even though the feeding of AS is going on. If DCAD is <150 mEq/kg DM, the effects of ABB are stronger and visible on all days of TP. Changes of NABE are reliable indicators for monitoring the use of AS, reflecting the induced metabolic acidosis. Urinary calcium concentrations also increased during the feeding of AS. However, it remains questionable whether this increase was the result of an active calcium mobilization in those cows fed diets including AS and having a positive DCAD. If further studies using pregnant cows confirm our results, new possibilities would arise for using AS in grassland regions, where high potassium concentrations in the feed limit the use of this preventive method. Furthermore, the use of AS in lower concentrations would reduce the risk of severe acidosis with detrimental effects on feed intake and the health of the cows. As seen in the group with the lowest DCAD (−155 mEq/kg DM), the reactions of NABE show that the acid load was not fully compensated. Further investigations should be initiated to find out if the different effects of AS on ABB in diets with varying DCAD will successfully prevent severe hypocalcaemia and periparturient paresis, to minimize the risk of negative side effects from using AS in the prevention of periparturient paresis in dairy cows.
We thank Mag. Tichy, Institute for Medical Physics and Biostatistics, Veterinary University Vienna for statistical advice. We are indebted also to Susan Bandilla for checking the text for linguistic errors.