


1. Introduction
Credibility theory plays a crucial role in insurance pricing by allowing insurers to strike a balance between the industry experience and the individual policyholder’s claims history. As the pioneering work in modern credibility theory, Bühlmann (Reference Bühlmann1967) developed a Bayesian model for claim amounts that constrains the prediction of future losses to be a linear function of past observations. This model provides the optimal linear Bayesian estimate of future losses, also known as the individual mean or hypothetical mean, under the quadratic loss function. The estimate is expressed as a linear combination of the population mean and individuals’ sample mean, with the weight assigned to the sample mean referred to as the credibility factor. Bühlmann’s Bayesian model for claim amounts laid the foundation for credibility theory and provided a robust framework for estimating future losses based on past observations.
Over time, credibility theory has evolved significantly and found extensive application in nonlife actuarial science in insurance companies (cf. Wen et al., Reference Wen, Wu and Zhou2009; Gómez-Déniz, Reference Gómez-Déniz2016; Yan and Song, Reference Yan and Song2022). However, with the changing times and the development of the insurance industry and actuarial technologies, actuaries have encountered situations where the factors influencing risks in commercial insurance plans are highly complex (cf. Bauwelinckx and Goovaerts, Reference Bauwelinckx and Goovaerts1990; Dhaene and Goovaerts, Reference Dhaene and Goovaerts1996; Yeo and Valdez, Reference Yeo and Valdez2006; Deresa et al., Reference Deresa, Van Keilegom and Antonio2022). Interested readers can refer to some typical situations presented in Chapter 7 of Bühlmann and Gisler (Reference Bühlmann and Gisler2005). Therefore, theories on multidimensional credibility are in urgent need.
For the first time, Jewell (Reference Jewell1973) introduced the concept of multidimensional credibility, making a decisive contribution to history of credibility theory. After that, Hachemeister (Reference Hachemeister and Kahn1975) introduced the credibility theory for regression models. These two works are believed as the pathbreaking contributions generalizing the credibility techniques into higher dimensions (cf. Bühlmann et al., Reference Bühlmann, Gisler and Kollöffel2003). Besides, Jewell (Reference Jewell1974) established exact multivariate credibility Footnote 1 model under certain conditions when the linear exponential family of likelihoods together with their natural conjugate priors are considered. Since then, credibility estimates for future losses in multivariate scenarios have been widely applied in premium pricing and liability reserve estimation in nonlife actuarial science. For example, Frees (Reference Frees2003) proposed theoretically optimal insurance prices using a multivariate credibility model and demonstrated significant economic differences in premium pricing methods with and without considering the covariance between different components. Englund et al. (Reference Englund, Guillén, Gustafsson, Nielsen and Nielsen2008) studied a generalization of the Bühlmann–Straub model, which allows for the age of claims to influence the estimation of future claims. Poon and Lu (Reference Poon and Lu2015) investigated a Bühlmann–Straub-type credibility model with dependence structure among risk parameters and conditional spatial cross-sectional dependence. Further generalizations of the multivariate credibility model can be found in Englund et al. (Reference Englund, Gustafsson, Nielsen and Thuring2009), Thuring et al. (Reference Thuring, Nielsen, Guillén and Bolancé2012), Pechon et al. (Reference Pechon, Denuit and Trufin2021), Gómez-Déniz and Calderín-Ojeda (Reference Gómez-Déniz and Calderín-Ojeda2018, Reference Gómez-Déniz and Calderín-Ojeda2021), Schinzinger et al. (Reference Schinzinger, Denuit and Christiansen2016), and related references.
However, the multivariate credibility estimates proposed by Jewell (Reference Jewell1973) have a rather complex form due to the matrix-based credibility factor, making them challenging to understand and implement. Moreover, the credibility factor matrix in the traditional multivariate credibility model involves numerous structural parameters, resulting in an increasing number of unknown parameters as the dimension of the risk vector (denoted by p) increases. Consequently, as the dimension of the risk vector increases, it suffers from the issue of the “curse of dimensionality.” In this context, when p is large,Footnote 2 these estimates become difficult to apply in actual insurance pricing processes.
To address these issues, this paper proposes a new multivariate credibility approach based on the joint distribution function. The study proceeds in two steps. First, instead of directly estimating the conditional mean of the risk random vector
 $\textbf{Y}=(Y^{(1)},\cdots,Y^{(p)})$
given the risk profile
 $\boldsymbol{\Theta} $
, we focus on estimating the conditional joint distribution function, denoted as
 $F( \left. y^{(1)},\cdots,y^{(p)}\vert \boldsymbol{\Theta} \right)$
, by constraining it to a linear combination of indicator functions labeled on the past claims. Utilizing the principles of credibility theory, the optimal linear Bayesian estimator of the conditional joint distribution function is then derived under the integral quadratic loss function. Second, employing the plug-in methodFootnote 3, multidimensional credibility estimates for the hypothetical mean, process variance, and risk premiums under various premium principles are obtained. Compared to the traditional multivariate credibility estimator in Jewell (1973), the credibility factor in the proposed approach is no longer a matrix but a scalar. It is shown to be an increasing function of the sample size and satisfies the essential principles of credibility. Moreover, the credibility factor involved in the new estimator is easy to estimate and can be naturally applied in premium pricing for multidimensional risks. Overall, our proposed approach addresses the limitations of traditional multivariate credibility models and provides a more straightforward and computationally efficient solution for credibility estimation in high-dimensional scenarios.
It should be mentioned that, for the case of one dimension
 $p=1$
, Cai et al. (Reference Cai, Wen, Wu and Zhou2015) applied the nonparametric method to develop the credibility estimation of distribution functions, which differs in nature compared with the present work. Our proposed multidimensional credibility estimator can be employed to predict premiums for aggregate claims in insurance portfolios, while the results in Cai et al. (Reference Cai, Wen, Wu and Zhou2015) for the one-dimensional case only deal with a single business line.
The novel contribution of our study is summarized as follows:
-
(i) We focus on the credibility estimation of multivariate joint distribution functions and plug in the estimator into the hypothetical mean and process covariance matrix, generating a new multidimensional credibility model.
-
(ii) The traditional multidimensional credibility model introduced in Jewell (Reference Jewell1973) suffers from severe difficulty in estimating the process covariance matrix (or even the population covariance matrix), rendering it impractical for use in insurance practice. Our proposed multidimensional credibility estimator overcomes this drawback and has the advantage of computational effectiveness, making it directly applicable to insurance premium prediction problems.
-
(iii) The proposed estimators can be applied for estimating various premium principles, which is in sharp contrast with the traditional multidimensional credibility that can only estimate the hypothetical mean.
The article is structured as follows: In Section 2, we present some pertinent notations and review the traditional multivariate credibility models. Additionally, we re-obtain the multivariate credibility estimation using the orthogonal projection method. In Section 3, we present the credibility estimation of the conditional joint distribution function and derive the corresponding credibility estimations for the hypothetical mean vector, process covariance matrix, and various premium principles and also study some statistical properties. In Section 4, we compare and demonstrate the performances of our proposed multidimensional credibility estimator and the traditional approach introduced by Jewell (Reference Jewell1973). Finally, we analyze two real applications, one from an insurance company mentioned in Bühlmann and Gisler (Reference Bühlmann and Gisler2005) and the other from the R package “insuranceData.” Section 5 concludes the paper. The proofs and derivations of the main results are delegated to the Supplementary Materials.
2. Preliminaries and review of traditional multivariate credibility models
Consider a portfolio of insurance policies with interdependence between risks. The losses associated with these risks are represented by a p-dimensional random vector
 $\textbf{Y}=(Y^{(1)},\ldots, Y^{(p)})^{\prime }$
, where p denotes the number of policies (or business lines). Given
 $\boldsymbol{\Theta} =\boldsymbol{\theta} $
, the conditional joint distribution function of
 $\textbf{Y}$
is denoted as:
 \begin{equation*}F\!\left( \textbf{y}\vert \boldsymbol{\theta} \right) =\mathbb{P}\!\left( \textbf{Y}\leq \textbf{y}\vert \boldsymbol{\Theta} =\boldsymbol{\theta} \right) =\mathbb{P}\!\left(Y^{(1)}\leq y^{(1)},\cdots, Y^{(p)}\leq y^{(p)} \vert \boldsymbol{\Theta} =\boldsymbol{\theta} \right), \end{equation*}
where
 $\boldsymbol{\Theta} $
, named as the risk profile, encompasses all factors influencing the risk of the insurance policy portfolio. Typically, due to the diversity of risks,
 $\boldsymbol{\Theta} $
is assumed to be a p-dimensional random vector, characterized by a certain prior density function
 $\pi ({\cdot})$
. The conditional mean (or hypothetical mean) and conditional (co-)variance (or process covariance) of the risk vector
 $\textbf{Y}$
are defined as:
 \begin{equation*}\boldsymbol{\mu }\!\left( \boldsymbol{\Theta} \right) =\mathbb{E}\!\left( \textbf{Y}|\boldsymbol{\Theta} \right) \quad\mbox{and}\quad \Sigma \!\left( \boldsymbol{\Theta} \right) =\mathbb{V}\!\left( \textbf{Y}|\boldsymbol{\Theta} \right) .\end{equation*}
For simplicity, let us denote
 \begin{equation}\boldsymbol{\mu } _{0}=\mathbb{E}\!\left[ \boldsymbol{\mu }\!\left( \boldsymbol{\Theta} \right) \right],\quad T=\mathbb{V}\!\left[ \boldsymbol{\mu }\!\left( \boldsymbol{\Theta} \right) \right], \quad\Sigma _{0}=\mathbb{E}\!\left[ \Sigma \!\left( \boldsymbol{\Theta} \right) \right] .\end{equation}
We assume that both
 $\Sigma _{0}$
and T are invertible matrices.Footnote 4
Since
 $\boldsymbol{\Theta} $
is unobserved, both
 $\boldsymbol{\mu }\!\left(\boldsymbol{\Theta} \right) $
and
 $\Sigma \!\left( \boldsymbol{\Theta} \right) $
are unobservable random vectors which require estimation based on available information. In the estimation process, we have access to two types of claim information. First, we have the prior information
 $\pi ({\cdot})$
of the risk profile
 $\boldsymbol{\Theta} $
, and second, we have past sample information
 $\textbf{Y}_{1},\cdots, \textbf{Y}_{n}$
obtained by observing the population
 $\textbf{Y}$
. The approach of combining prior information and sample information to draw statistical inferences about
 $\boldsymbol{\mu }\!\left( \boldsymbol{\Theta} \right) $
and
 $\Sigma \!\left( \boldsymbol{\Theta} \right) $
is known as Bayesian statistics. The basic settings of Bayesian statistics models are described as follows.
Assumption 2.1. Let
 $\boldsymbol{\Theta}$
be a random vector that characterizes the risk parameter of the random vector
 $\textbf{Y}$
, governed by a prior distribution function
 $\pi({\cdot})$
.
Assumption 2.2. Given
 $\boldsymbol{\Theta}$
, the random vector
 $\textbf{Y}_{1},\cdots, \textbf{Y}_{n}$
consists of independent and identically distributed samples, where
 $\textbf{Y}_{i}=\left( Y_{i}^{(1)},Y_{i}^{(2)},\ldots, Y_{i}^{(p)}\right)^{\prime }$
, for
 $i=1,\ldots, n$
.
Following the traditional credibility theory, the estimation of
 $\boldsymbol{\mu }\!\left( \boldsymbol{\Theta} \right) $
is constrained to linear functions of the observations. The optimal linear Bayesian estimator of
 $\boldsymbol{\mu }\!\left( \boldsymbol{\Theta} \right) $
under the quadratic loss function can be obtained by solving
 \begin{equation}\min_{\textbf{b}_{0}\in \mathbb{R}^{p},\textrm{B}_{i}\in \mathbb{R}^{p\times p}}\mathbb{E}\!\left[ \left( \boldsymbol{\mu }(\boldsymbol{\Theta} )-\textbf{b}_{0}-\sum_{i=1}^{n}\textrm{B}_{i}\textbf{Y}_{i}\right) \left( \boldsymbol{\mu }(\boldsymbol{\Theta} )-\textbf{b}_{0}-\sum_{i=1}^{n}\textrm{B}_{i}\textbf{Y}_{i}\right) ^{\prime }\right]. \end{equation}
In contrast to the approach presented by Bühlmann and Gisler (Reference Bühlmann and Gisler2005), we employ the orthogonal projection method to solve (2.2) and derive the optimal linear Bayesian estimate of
 $\boldsymbol{\mu}\!\left( \boldsymbol{\Theta} \right) $
. The following lemma demonstrates the connection between the orthogonal projection and the optimal linear Bayesian estimation. The detailed proof can be found in Wen et al. (Reference Wen, Wu and Zhou2009).
Lemma 2.1. Let
 $\left(\begin{array}{c}\textbf{X}_{p\times 1} \\\textbf{Y}_{q\times 1}\end{array}\right) $
be a random vector with its expectation and covariance matrix given by
 $\left(\begin{array}{c}\boldsymbol{\mu }_{\textbf{X}} \\\boldsymbol{\mu }_{\textbf{Y}}\end{array}\right) $
and
 $\left(\begin{array}{c@{\quad}c}\Sigma _{\textbf{XX}} & \Sigma _{\textbf{XY}} \\\Sigma _{\textbf{YX}} & \Sigma _{\textbf{YY}}\end{array}\right) $
, respectively. Then the expected quadratic loss
 \begin{equation}\mathbb{E}\!\left( \textbf{Y}-{A}-B\textbf{X}\right) \left( \textbf{Y}-{A}-B\textbf{X}\right) ^{\prime }\end{equation}
achieves its minimum in the nonnegative definiteFootnote 5 sense when
 \begin{equation}A=\boldsymbol{\mu }_{\textbf{Y}}-\Sigma _{\textbf{YX}}\Sigma _{\textbf{XX}}^{-1}\boldsymbol{\mu }_{\textbf{X}}\quad { and}\quad B=\Sigma _{\textbf{YX}}\Sigma _{\textbf{XX}}^{-1}.\end{equation}
In light of Lemma 2.1, the optimal linear Bayesian estimation of the conditional mean vector can be obtained by solving the minimization problem (2.2), which can be expressed as follows:
 \begin{eqnarray}\widehat{\boldsymbol{\mu }_{C,n}(\boldsymbol{\Theta} )}&=&\textrm{Pro}\!\left( \left. \boldsymbol{\mu}(\boldsymbol{\Theta} )\right\vert L(\widetilde{\textbf{Y}},\textbf{1})\right) \notag\\&=&\mathbb{E}[\boldsymbol{\mu }(\boldsymbol{\Theta} )]+\mathbb{C}\unicode{x1D560}\unicode{x1D567}\!\left(\boldsymbol{\mu }(\boldsymbol{\Theta}),\widetilde{\textbf{Y}}\right) \mathbb{C}\unicode{x1D560}\unicode{x1D567}^{-1}\left(\widetilde{\textbf{Y}},\widetilde{\textbf{Y}}\right) \left[ \widetilde{\textbf{Y}}-{{\mathbb{E}\!\left( \widetilde{\textbf{Y}}\right)}} \right], \end{eqnarray}
where “Pro” signifies the projection onto the space of random vectors spanned by
 $\widetilde{\textbf{Y}}=\left( \textbf{Y}_{1}^{\prime }, \textbf{Y}_{2}^{\prime },\cdots, \textbf{Y}_{n}^{\prime }\right) ^{\prime }$
and
 $L(\widetilde{\textbf{Y}},\textbf{1})$
is the linear subspace spanned by 1 and the components of
 $\widetilde{\textbf{Y}}$
. By combining Assumptions 2.1 and 2.2 of the Bayesian model for multivariate risk vectors, the following theorem, which was developed in Jewell (Reference Jewell1973) and revisited in Bühlmann and Gisler (Reference Bühlmann and Gisler2005), can be obtained.
Theorem 2.1. Under Assumptions 2.1 and 2.2, the optimal linear estimation of
 $\boldsymbol{\mu }(\boldsymbol{\Theta} )$
is achieved by solving the minimization problem (2.2) and can be expressed as follows:
 \begin{equation}\widehat{\boldsymbol{\mu }_{C,n}(\boldsymbol{\Theta} )}={Z}_{C,n}\overline{\textbf{Y}}+\big(I_{p}-{Z}_{C,n}\big)\boldsymbol{\mu }_{0}, \end{equation}
where
 $\overline{\textbf{Y}}=\frac{1}{n}\sum_{i=1}^{n}\textbf{Y}_{i}$
represents the sample mean vector, and the weight matrix
 \begin{equation}{Z}_{C,n}=nT(nT+\Sigma _{0})^{-1} \end{equation}
is a
 $p\times p$
matrix.Footnote 6 Here, the capital letter “C” inside the credibility factor
 ${Z}_{C,n}$
stands for the word “classical.”
As per Theorem 2.1, the optimal linear Bayesian estimator of the vector of hypothetical mean
 $\boldsymbol{\mu }(\boldsymbol{\Theta} )$
is a weighted average of the sample mean
 $\overline{\textbf{Y}}$
and the prior mean
 $\boldsymbol{\mu }_{0}$
. The weight matrix
 ${Z}_{C,n}$
has the following properties:
 \begin{equation*}\underset{n\rightarrow \infty }{\lim }{Z}_{C,n}=I_{p}\quad {and}\quad\underset{n\rightarrow 0}{\lim }{Z}_{C,n}=0_{p\times p},\end{equation*}
where
 $I_{p}$
is the p-dimensional identity matrix and
 $0_{p\times p}$
is the zero matrix with p rows and p columns. Note that
 ${Z}_{C,n}$
is usually referred as the credibility factor matrix, indicating the influence of the sample mean
 $\overline{\textbf{Y}}$
in the optimal linear estimation
 $\widehat{\boldsymbol{\mu }_{C,n}(\boldsymbol{\Theta} )}$
.
In practical insurance premium pricing problems, computing the credibility factor matrix
 ${Z}_{C,n}$
can be very tedious and challenging since it involves with much more complexity of matrix inversion when p is large, hindering the usage of the classical multidimentional credibility approach for dealing with real problems. The following two examples illustrate this point.
Example 2.1. Given
 $\boldsymbol{\Theta}$
, we assume that the random vectors
 $\textbf{Y}_{1}, \textbf{Y}_{2},\ldots, \textbf{Y}_{n}$
are independent and identically distributed as Bivariate normal distribution
 $N_{2}(\boldsymbol{\Theta}, \Sigma _{0})$
, where
 $\textbf{Y}_{i}=(Y_{i}^{(1)},Y_{i}^{(2)})$
is a two-dimensional random vector. The prior distribution of the vector of risk parameters
 $\boldsymbol{\Theta} $
is
 $N_{2}(\boldsymbol{\mu }_{0},T)$
, where
 \begin{equation*}T=\left(\begin{array}{c@{\quad}c}\tau _{1}^{2} & \nu _{1} \\\nu _{1} & \tau _{2}^{2}\end{array}\right) \quad and\quad \Sigma _{0}=\left(\begin{array}{c@{\quad}c}\sigma _{1}^{2} & \nu _{2} \\\nu _{2} & \sigma _{2}^{2}\end{array}\right) .\end{equation*}
Let
 $A=nT+\Sigma _{0}$
. Then the inverse of A can be computed using matrix algebra as:
 \begin{equation*}A^{-1}=\frac{A^{\ast }}{|A|}=\frac{1}{\left(n\tau _{1}^{2}+\sigma _{1}^{2}\right)(n\tau_{2}^{2}+\sigma _{2}^{2})-(n\nu _{1}+\nu _{2})^{2}}\left(\begin{array}{c@{\quad}c}n\tau _{2}^{2}+\sigma _{2}^{2} & -(n\nu _{1}+\nu _{2}) \\[5pt]-(n\nu _{1}+\nu _{2}) & n\tau _{1}^{2}+\sigma _{1}^{2}\end{array}\right) .\end{equation*}
Using Equation (2.7), we can obtain the expression for
 ${Z}_{C,n}$
as follows:
 \begin{equation}{Z}_{C,n}=\left(\begin{array}{c@{\quad}c}\dfrac{n\tau _{1}^{2}\left(n\tau _{2}^{2}+\sigma _{2}^{2}\right)-n\nu _{1}\left(n\nu _{1}+\nu_{2}\right)}{\left(n\tau _{1}^{2}+\sigma _{1}^{2}\right)\left(n\tau _{2}^{2}+\sigma_{2}^{2}\right)-(n\nu _{1}+\nu _{2})^{2}} & \dfrac{n\nu _{1}\sigma _{1}^{2}-n\nu_{2}\tau _{1}^{2}}{\left(n\tau _{1}^{2}+\sigma _{1}^{2}\right)\left(n\tau _{2}^{2}+\sigma_{2}^{2}\right)-\left(n\nu _{1}+\nu _{2}\right)^{2}} \\[19pt]\dfrac{n\nu _{1}\sigma _{2}^{2}-n\nu _{2}\tau _{2}^{2}}{\left(n\tau_{1}^{2}+\sigma _{1}^{2}\right)\left(n\tau _{2}^{2}+\sigma _{2}^{2}\right)-\left(n\nu _{1}+\nu_{2}\right)^{2}} & \dfrac{n\tau _{2}^{2}\left(n\tau _{1}^{2}+\sigma _{1}^{2}\right)-n\nu_{1}\left(n\nu _{1}+\nu _{2}\right)}{\left(n\tau _{1}^{2}+\sigma _{1}^{2}\right)\left(n\tau_{2}^{2}+\sigma _{2}^{2}\right)-\left(n\nu _{1}+\nu _{2}\right)^{2}}\end{array}\right). \end{equation}
As seen in Example 2.1, the computation of
 ${Z}_{C,n}$
is manageable when
 $p=2$
; however, when
 $p\geq3$
, it becomes much more complex, as shown in the following example.
Example 2.2. In accordance with Example 2.1, we proceed to compute the matrix of credibility factors for the scenario where
 $p=3$
, wherein the following representations ensue
 \begin{equation*}T=\left(\begin{array}{c@{\quad}c@{\quad}c}\tau _{1}^{2} & \nu _{1} & \nu _{2} \\[4pt]\nu _{1} & \tau _{2}^{2} & \nu _{3} \\[4pt]\nu _{2} & \nu _{3} & \tau _{3}^{2}\end{array}\right) \quad \mbox{and}\quad \Sigma _{0}=\left(\begin{array}{c@{\quad}c@{\quad}c}\sigma _{1}^{2} & \nu _{4} & \nu _{5} \\[4pt]\nu _{4} & \sigma _{2}^{2} & \nu _{6} \\[4pt]\nu _{5} & \nu _{6} & \sigma _{3}^{2}\end{array}\right) .\end{equation*}
The adjoint matrix of A is determined as:
 \begin{equation}A^{\ast }=\left(\begin{array}{c@{\quad}c@{\quad}c}\psi _{11} & \psi _{12} & \psi _{13} \\\psi _{21} & \psi _{22} & \psi _{23} \\\psi _{31} & \psi _{32} & \psi _{33}\end{array}\right), \end{equation}
where
 \begin{align*}& \psi _{11}=\left( n\tau _{2}^{2}+\sigma _{2}^{2}\right) \left( n\tau_{3}^{2}+\sigma _{3}^{2}\right) -\left( \nu _{3}+\nu _{4}\right) ^{2}, \\[3pt]& \psi _{12}=\psi _{21}=\left( n\nu _{2}+\nu _{5}\right) \left( n\nu_{3}+\nu _{6}\right) -\left( n\nu _{1}+\nu _{4}\right) \left( n\tau_{3}^{2}+\sigma _{3}^{2}\right), \\[3pt]& \psi _{13}=\psi _{31}=\left( n\nu _{1}+\nu _{4}\right) \left( n\nu_{3}+\nu _{6}\right) -\left( n\nu _{2}+\nu _{5}\right) \left( n\tau_{2}^{2}+\sigma _{2}^{2}\right), \\[3pt]& \psi _{22}=\left( n\tau _{1}^{2}+\sigma _{1}^{2}\right) \left( n\tau_{3}^{2}+\sigma _{3}^{2}\right) -\left( n\nu _{2}+\nu _{5}\right) ^{2}, \\[3pt]& \psi _{23}=\psi _{32}=\left( n\nu _{1}+\nu _{4}\right) \left( n\nu_{2}+\nu _{4}\right) -\left( n\tau _{1}^{2}+\sigma _{1}^{2}\right) \left(n\nu _{3}+\nu _{6}\right), \\[3pt]& \psi _{33}=\left( n\tau _{1}^{2}+\sigma _{1}^{2}\right) \left( n\tau_{2}^{2}+\sigma _{2}^{2}\right) -\left( n\nu _{1}+\nu _{4}\right) ^{2}.\end{align*}
The determinant of matrix A is formulated as:
 \begin{eqnarray*}|A| &=&\left( n\tau _{1}^{2}+\sigma _{1}^{2}\right) \left( \left( n\tau_{2}^{2}+\sigma _{2}^{2}\right) \left( n\tau _{3}^{2}+\sigma _{3}^{2}\right)-\left( n\nu _{3}+\nu _{6}\right) ^{2}\right) \\[3pt]&&-\left( n\nu _{1}+\nu _{4}\right) \left( \left( n\nu _{1}+\nu _{4}\right)\left( n\tau _{3}^{2}+\sigma _{3}^{2}\right) -\left( n\nu _{2}+\nu_{5}\right) \left( n\nu _{3}+\nu _{6}\right) \right) \\[3pt]&&+\left( n\nu _{2}+\nu _{5}\right) \left( \left( n\nu _{1}+\nu _{4}\right)\left( n\nu _{3}+\nu _{6}\right) -\left( n\nu _{2}+\nu _{5}\right) \left(n\tau _{2}^{2}+\sigma _{2}^{2}\right) \right) .\end{eqnarray*}
The expression for the matrix of credibility factors is provided as follows:
 \begin{equation}{Z}_{C,n}=\frac{1}{|A|}\left(\begin{array}{c@{\quad}c@{\quad}c}Z_{11}^{C} & Z_{12}^{C} & Z_{13}^{C} \\[5pt]Z_{21}^{C} & Z_{22}^{C} & Z_{23}^{C} \\[5pt]Z_{31}^{C} & Z_{32}^{C} & Z_{33}^{C}\end{array}\right), \end{equation}
where the components are given by:
 \begin{eqnarray*}&&Z_{11}^{C}=n\tau _{1}^{2}\psi _{11}+n\nu _{1}\psi _{21}+n\nu _{2}\psi_{31},\quad Z_{12}^{C}=n\tau _{1}^{2}\psi _{12}+n\nu _{1}\psi _{22}+n\nu_{2}\psi _{32}, \\&&Z_{13}^{C}=n\tau _{1}^{2}\psi _{13}+n\nu _{1}\psi _{23}+n\nu _{2}\psi_{33},\quad Z_{21}^{C}=n\nu _{1}\psi _{11}+n\tau _{2}^{2}\psi _{21}+n\nu_{3}\psi _{31}, \\&&Z_{22}^{C}=n\nu _{1}\psi _{12}+n\tau _{2}^{2}\psi _{22}+n\nu _{3}\psi_{32},\quad Z_{23}^{C}=n\nu _{1}\psi _{13}+n\tau _{2}^{2}\psi _{23}+n\nu_{3}\psi _{33}, \\&&Z_{31}^{C}=n\nu _{2}\psi _{11}+n\nu _{3}\psi _{21}+n\tau _{3}^{2}\psi_{31},\quad Z_{32}^{C}=n\nu _{2}\psi _{12}+n\nu _{3}\psi _{22}+n\tau_{3}^{2}\psi _{32}, \\&&Z_{33}^{C}=n\nu _{2}\psi _{13}+n\nu _{3}\psi _{23}+n\tau _{3}^{2}\psi_{33}.\end{eqnarray*}
As noted from the above two examples, the traditional multivariate credibility estimation (2.6) may suffer certain shortcomings when compared to Bühlmann’s univariate credibility estimation:
-
(i) Complexity of computation: When
 $p=3$
, the credibility factor matrix
${Z}_{C,n}$
is already quite complex. For higher dimensions with
$p>3$
, the expression of
${Z}_{C,n}$
involves the inverse of high-order matrices, and there is no general explicit expression. This complexity makes it difficult for practitioners to understand and apply in practical situations.
-
(ii) Difficulty in parameter estimation: The traditional multivariate credibility estimation suffers from the issue of having many unknown structural parameters, which can be difficult to estimate accurately, especially as p increases. The large number of parameters can lead to overfitting and increase computation complexity, making it less useful for real-world applications. Even for
$p=2$
, the expression of
${Z}_{C,n}$
contains six unknown parameters such as
$\tau_{1}^{2},\tau _{2}^{2},\sigma _{1}^{2},\sigma _{2}^{2},\nu _{1},\nu _{2}$
. Exactly, the dimensional disaster problem refers to the challenge of estimating a large number of unknown parameters as the dimension p of the problem increases. In the case of traditional multivariate credibility estimation, the number of unknown parameters increases with the order
$O(p^{2}+p)$
as p grows, which can quickly become overwhelming and computationally demanding, especially for high-dimensional problems. -
(iii) Lack of applicability under some premium principles: Traditional multivariate credibility estimation
$\widehat{\boldsymbol{\mu }_{C,n}(\boldsymbol{\Theta} )}$
is limited in its applicability, particularly when considering some premium principles beyond the expected value principle. Since it only provides an estimation of the conditional mean
$\boldsymbol{\mu }(\boldsymbol{\Theta} )$
, it cannot estimate other functionals of the risk parameter, such as the process covariance matrix
$\Sigma (\boldsymbol{\Theta} )$
.


In conclusion, although the classical multivariate credibility estimation has good statistical properties and a mathematically sound form, it is less commonly used in practice due to the challenges of dimension disaster and computational complexity. In this regard, we propose a new multidimensional credibility model based on the credibility estimation of the conditional joint distribution function, which will be the main focus of the next section.
3. Main results
Note that
 $\boldsymbol{\mu }\!\left( \boldsymbol{\Theta} \right) $
and
 $\boldsymbol{\Sigma }\!\left( \boldsymbol{\Theta} \right) $
can be expressed as:
 \begin{equation}\boldsymbol{\mu }\!\left( \boldsymbol{\Theta} \right) =\int_{\mathbb{R}^{p}} \textbf{y}dF\!\left( \left.\textbf{y}\right\vert \boldsymbol{\Theta} \right) \end{equation}
and
 \begin{equation}\boldsymbol{\Sigma }\!\left( \boldsymbol{\Theta} \right) =\int_{\mathbb{R}^{p}} \left[ \textbf{y}-\boldsymbol{\mu }\!\left( \boldsymbol{\Theta} \right) \right] \left[ \textbf{y}-\boldsymbol{\mu }\left( \boldsymbol{\Theta}\right) \right] ^{\prime }dF\!\left( \left. \textbf{y}\right\vert \boldsymbol{\Theta}\right), \end{equation}
respectively. Based on these expressions, we shall employ the basic idea of credibility theory to first estimate the conditional joint distribution function
 $F\!\left( \left. \textbf{y}\right\vert \boldsymbol{\Theta} \right) $
. Subsequently, the credibility estimations for
 $\boldsymbol{\mu }(\boldsymbol{\Theta} )$
,
 ${\Sigma }(\boldsymbol{\Theta} )$
, and the general risk premium
 $R(\boldsymbol{\Theta} )$
will be derived using the plug-in technique.
3.1. Credibility estimator for the joint distribution function
Let us define the class of nonhomogeneous linear functions of the conditional joint distribution as:
 \begin{equation}\mathscr{L}=\left\{ \alpha _{0}\left( \textbf{y}\right)+\sum_{s=1}^{n}\alpha _{s}H_{s}\!\left( \textbf{y}\right)\right\}, \end{equation}
where
 $\alpha _{0}\!\left( \textbf{y}\right) $
is an unspecified multivariate function (in general representing the population information), and
 \begin{equation*}H_{s}\!\left( \textbf{y}\right) =I_{\left\{\textbf{Y}\leq \textbf{y}\right\}}=\left\{\begin{array}{c@{\quad}c}1, & Y_{s}^{(1)}\leq y^{(1)},\cdots, Y_{s}^{(p)}\leq y^{(p)} \\[7pt]0, & \text{otherwise}\end{array}\right., \end{equation*}
for
 $\textbf{y}=\left( y^{(1)},\cdots, y^{(p)}\right) ^{\prime }$
and
 $s=1,\ldots, n$
, where
 $I_A$
represents the indicative function of event A, which is equal to 1 when A occurs, otherwise equal to 0. We aim to solve the following minimization problem:
 \begin{equation}\min_{\widehat{F}\!\left( \left. \textbf{y}\right\vert \boldsymbol{\Theta} \right) \in \mathscr{L}}\int_{\mathbb{R}^{p}}\mathbb{E}\!\left[ \left( F\!\left( \left. \textbf{y}\right\vert \boldsymbol{\Theta} \right) -\widehat{F}\!\left(\left. \textbf{y}\right\vert \boldsymbol{\Theta} \right) \right) ^{2}\right] d\textbf{y}.\end{equation}
The solution to problem (3.4) is summarized in the following theorem.
Theorem 3.1. In the Bayesian model settings for multivariate risks, as described by Assumptions 2.1 and 2.2, the optimal linear Bayesian estimator of the conditional joint distribution function
 $F\!\left( \left. \textbf{y}\right\vert \boldsymbol{\Theta}\right) $
solving problem (3.4) is given by:
 \begin{equation}\widehat{F}\!\left( \left. \textbf{y}\right\vert \boldsymbol{\Theta} \right)=Z_{N,n}F_{n}\!\left( \textbf{y}\right) +(1-Z_{N,n})F_{0}\!\left( \textbf{y}\right), \end{equation}
where
 \begin{equation}F_{n}\!\left( \textbf{y}\right) =\frac{1}{n}\sum_{i=1}^{n}H_{i}\!\left( \textbf{y}\right) \text{ }\end{equation}
and
 \begin{equation*}F_{0}\!\left( \textbf{y}\right) =\mathbb{E}\!\left[ F\!\left( \left. \textbf{y}\right\vert \boldsymbol{\Theta} \right) \right] =\int_{\mathbb{R}^{p}} F\!\left( \left. \textbf{y}\right\vert \boldsymbol{\theta} \right) \pi \!\left( \boldsymbol{\theta}\right) d\boldsymbol{\theta}\end{equation*}
represent the empirical and aggregated joint distribution functions, respectively. The credibility factor
 $Z_{N,n}$
Footnote 7 is defined as:
 \begin{equation}Z_{N,n}=\frac{n\tau _{0}^{2}}{n\tau _{0}^{2}+\sigma _{0}^{2}}, \end{equation}
where
 \begin{equation}\tau _{0}^{2}=\int_{\mathbb{R}^{p}}\mathbb{V}\!\left[ F\!\left( \left. \textbf{y}\right\vert \boldsymbol{\Theta} \right) \right] d\textbf{y}\end{equation}
and
 \begin{equation}\sigma _{0}^{2}=\int_{\mathbb{R}^{p}}\mathbb{E}\!\left[ F\!\left( \left. \textbf{y}\right\vert \boldsymbol{\Theta} \right) \left( 1-F\!\left( \left. \textbf{y}\right\vert \boldsymbol{\Theta} \right) \right) \right] d\textbf{y}. \end{equation}
We hereby designate
 $\widehat{F}\!\left( \left. \textbf{y}\right\vert \boldsymbol{\Theta}\right) $
as the credibility estimate of the conditional distribution function
 $F\!\left( \left. \textbf{y}\right\vert \boldsymbol{\Theta} \right) $
and
 $Z_{N,n}$
as the credibility factor.
Remark 3.1. Noted that in Equation (3.3), none constraints were imposed on class
 $\mathscr{L}$
for estimating distribution functions. It is easy to observe that solving problem (3.4) would be quite challenging if we introduce some constraints. Given
 $\boldsymbol{\Theta}$
, due to the exchangeability of
 $\textbf{Y}_1,\textbf{Y}_2,\cdots, \textbf{Y}_n$
, it must hold that
 $\alpha_1=\alpha_2=\cdots=\alpha_n$
for the solution of (3.4). Therefore, the optimization problem (3.4) is actually equivalent to solving:
 \begin{equation}\min_{b\in \mathbb{R}}\int_{\mathbb{R}^{p}} \mathbb{E}\!\left[ F\!\left( \left. \textbf{y}\right\vert \boldsymbol{\Theta} \right) -\alpha_{0}\left( \textbf{y}\right)-bF_{n}\!\left( \textbf{y}\right) \right] ^{2}d\textbf{y}. \end{equation}
Note that
 \begin{eqnarray*}&&\mathbb{E}\!\left[ F\!\left( \left. \textbf{y}\right\vert \boldsymbol{\Theta} \right)-\alpha _{0}\!\left( \textbf{y}\right) -bF_{n}\!\left( \textbf{y}\right) \right]^{2} \\[3pt]&=&\mathbb{V}\!\left[ F\!\left( \left. \textbf{y}\right\vert \boldsymbol{\Theta} \right)-\alpha _{0}\left( \textbf{y}\right) -bF_{n}\!\left( \textbf{y}\right) \right]+\mathbb{E}\!\left[ F\!\left( \left. \textbf{y}\right\vert \boldsymbol{\Theta} \right)-\alpha _{0}\!\left( \textbf{y}\right) -bF_{n}\!\left( \textbf{y}\right) \right]\\[3pt]&\geq &\mathbb{V}\!\left[ F\!\left( \left. \textbf{y}\right\vert \boldsymbol{\Theta} \right)-\alpha _{0}\!\left( \textbf{y}\right) -bF_{n}\!\left( \textbf{y}\right) \right],\end{eqnarray*}
where the equality holds if and only if
 \begin{equation*}\mathbb{E}\!\left[ F\!\left( \left. \textbf{y}\right\vert \boldsymbol{\Theta} \right) -\alpha_{0}\!\left( \textbf{y}\right) -bF_{n}\!\left( \textbf{y}\right) \right] =0.\end{equation*}
Therefore,
 $\alpha_{0}\!\left( \textbf{y}\right)$
should be chosen such that
 \begin{equation*}\alpha _{0}\!\left( \textbf{y}\right) =\mathbb{E}\!\left[ F\!\left( \left. \textbf{y}\right\vert \boldsymbol{\Theta} \right) -bF_{n}\!\left( \textbf{y}\right) \right] =aF_{0}\!\left( \textbf{y}\right), \end{equation*}
where
 $a=1-b.$
Thus, the optimization problem (3.4) is equivalent to finding the optimal estimate of the conditional distribution function
 $F\!\left(\left.\textbf{y}\right\vert\boldsymbol{\Theta}\right)$
within the class:
 \[\mathscr{L}^{*}=\left\{ aF_{0}(\textbf{y})+bF_{n}(\textbf{y})\right\} .\]
To ensure the candidates in
 $\mathscr{L}^{*}$
to be reasonable estimates, we need to impose the condition:
 \[a\geq 0,\,b\geq 0,\,a+b=1,\]
under which
 $aF_{0}(\textbf{y})+bF_{n}(\textbf{y})$
remains a multivariate distribution function. To this regard, we should solve the following constrained optimization problem:
 \begin{equation}\left\{ \begin{aligned}&\min_{a,b\in \mathbb{R}}\int_{\mathbb{R}^{p}} \mathbb{E}\!\left[ F\!\left( \left. \textbf{y}\right\vert \boldsymbol{\Theta} \right) -aF_{0}(\textbf{y})-bF_{n}(\textbf{y})\right]^{2}d\textbf{y} \\[6pt]&\mbox{s.t.}\; a\geq 0,\,b\geq 0,\,a+b=1\end{aligned} \right. .\end{equation}
In accordance with Lemma 1 in Section 2 of the supplementary file, one can demonstrate that solving the constrained optimization problem (3.11) is equivalent to dealing with the unconstrained optimization problem (3.4).
Remark 3.2. For the case of one-dimensional claims, that is,
 $p=1$
, problem (3.4) can be written as:
 \begin{equation} \min_{\alpha_{0}({\cdot}),\alpha_{1},\ldots,\alpha_{n}\in \mathbb{R}}\int_{\mathbb{R}} \mathbb{E}\!\left[F\!\left(\left.y\right\vert{\Theta}\right)-\alpha_{0}(y)-\sum_{s=1}^{n}\alpha_{s}I(Y_{s}\leq y)\right]^{2}dy \end{equation}
yielding the credibility estimation of the univariate conditional distribution function as:
 \[\widehat{F}\!\left(\left.y\right\vert{{\Theta}}\right)=Z_{N,n}F_{n}(y)+(1-Z_{N,n})F_{0}(y),\]
which is akin to the credibility estimation of the survival function stated in Equation (2.7) of Cai et al. (Reference Cai, Wen, Wu and Zhou2015).
Remark 3.3. If the claims have discrete distributions, we only need to modify Equation (3.4) to
 \begin{equation*}\min_{\alpha_{0}({\cdot}),\alpha_{1},\ldots,\alpha_{n}\in \mathbb{R}}\sum_{y}\mathbb{E}\!\left[p\!\left(\left.\textbf{y}\right\vert\boldsymbol{\Theta}\right)-\alpha_{0}(\textbf{y})-\sum_{s=1}^{n}\alpha_{s}I(\textbf{Y}_{s}=\textbf{y})\right]^{2},\end{equation*}
where
 $p\!\left(\left.\textbf{y}\right\vert\boldsymbol{\Theta}\right)=\mathbb{P}\!\left(\left.\textbf{Y}=\textbf{y}\right\vert\boldsymbol{\Theta}=\boldsymbol{\theta}\right)$
. This yields the corresponding credibility estimation as:
 \begin{equation*}\widehat{p}\!\left(\left.\textbf{y}\right\vert\boldsymbol{\Theta}\right)=Z_{N,n}p_{n}\left(\textbf{y}\right)+\left(1-Z_{N,n}\right)p_{0}\left(\textbf{y}\right),\end{equation*}
where
 $Z_{N,n}$
shares a resemblance with the results of Theorem 3.1, with the distinction of replacing the multivariate integration by multivariate summation.
It is noteworthy that the new credibility factor
 $Z_{N,n}$
is a deterministic function of sample size n, but independent of the samples. Additionally, both
 $F_{n}\!\left( {{\textbf{y}}}\right) $
and
 $F_{0}\!\left( {{\textbf{y}}}\right) $
conform to the fundamental properties of joint distribution functions. Consequently, it is evident that
 $\widehat{F}\!\left(\left. {\textbf{y}}\right\vert \boldsymbol{\Theta} \right) $
possesses attributes such as nonnegativity, monotonicity, right-continuity for each component, and finite additivity. Moreover, it satisfies the following boundary conditions:
 \begin{equation*}\lim_{{{y^{(1)}}}\rightarrow +\infty, \ldots, {{y^{(p)}}}\rightarrow +\infty}\left[ \widehat{F}\!\left( \left. {\textbf{y}}\right\vert \boldsymbol{\Theta} \right) \right] =1\quad\end{equation*}
and
 \begin{equation*}\text{ }\lim_{{{y^{(i)}\rightarrow }}-\infty \text{ }}\widehat{F}\!\left(\left. {\textbf{y}}\right\vert \boldsymbol{\Theta} \right) =0\ \text{for some }i\in\left\{ {1,2,\cdots, p}\right\} .\quad\end{equation*}
Hence, the estimator
 $\widehat{F}\!\left( \left. {\textbf{y}}\right\vert\boldsymbol{\Theta} \right) $
also qualifies as a joint distribution function. As per Theorem 3.1, the estimation
 $\widehat{F}\!\left( \left. {\textbf{y}}\right\vert \boldsymbol{\Theta} \right) $
of the conditional joint distribution function can be elegantly represented as a weighted combination of the empirical joint distribution function
 $F_{n}\!\left( {{\textbf{y}}}\right) $
and the integrated joint distribution function
 $F_{0}\!\left( {{\textbf{y}}}\right) $
.
The credibility factor
 $Z_{N,n}$
exhibits an increment with respect to the sample size n, and it fulfills the following asymptotic properties:
 \begin{equation}\lim_{n\rightarrow \infty }Z_{N,n}=1\quad \text{and }\quad\lim_{n\rightarrow 0}Z_{N,n}=0, \end{equation}
which enjoys a similar expression with the univariate standard Bühlmann model. Consequently, when the sample size is substantial, greater emphasis is conferred upon the empirical distribution function
 $F_{n}\!\left( {{\textbf{y}}}\right) $
, and vice versa.
3.2. Credibility estimator for the hypothetical mean
Utilizing the credibility estimator
 $\widehat{F}\!\left( \left. {\textbf{y}}\right\vert \boldsymbol{\Theta} \right) $
, one can readily derive the credibility estimation for the hypothetical mean vector
 $\boldsymbol{\mu }(\boldsymbol{\Theta} )$
by applying the plug-in technique. As a result, one has the following proposition.
Proposition 3.1. By substituting the optimal linear estimate
 $\widehat{F}\!\left(\left. {\textbf{y}}\right\vert \boldsymbol{\Theta} \right) $
of the distribution function into Equation (3.1), we obtain the credibility estimate of the conditional mean vector
 $\boldsymbol{\mu }(\boldsymbol{\Theta} )$
as follows:
 \begin{equation*}\widehat{\boldsymbol{\mu }_{N,n}(\boldsymbol{\Theta} )}=Z_{N,n}\overline{\textbf{Y}}+(1-Z_{N,n}){\boldsymbol{\mu }_{0}}, \end{equation*}
where the credibility factor
 $Z_{N,n}$
is given by Equation (3.7).
It is evident that the estimation
 $\widehat{\boldsymbol{\mu }_{N,n}(\boldsymbol{\Theta} )}$
can be represented as a linear weighted average of the sample mean
 $\overline{\textbf{Y}}$
and the population mean
 $\boldsymbol{\mu }_{0}$
, where the weights satisfy the property (3.13). This form is very similar with the univariate case for classical Bühlmann model developed in Bühlmann (Reference Bühlmann1967). However, compared with the traditional multivariate credibility estimator given in Theorem 2.1, the credibility factor
 $Z_{N,n}$
is a scalar, which reduces the computational complexity of traditional multivariate credibility model.
Given the expression of the credibility estimation
 $\widehat{\boldsymbol{\mu }_{N,n}(\boldsymbol{\Theta} )}$
, we can calculate the conditional expectation of
 $\widehat{\boldsymbol{\mu }_{N,n}(\boldsymbol{\Theta} )}$
as:
 \begin{equation*}\mathbb{E}\!\left[ \left. \widehat{\boldsymbol{\mu }_{N,n}(\boldsymbol{\Theta} )}\right\vert\boldsymbol{\Theta} \right] =Z_{N,n}\mathbb{E}\!\left( \left. \overline{\textbf{Y}}\right\vert \boldsymbol{\Theta} \right) +(1-Z_{N,n})\boldsymbol{\mu }{_{0}=Z_{N,n}}\boldsymbol{\mu }(\boldsymbol{\Theta} )+(1-Z_{N,n})\boldsymbol{\mu }{_{0}.}\end{equation*}
By using the formula for double expectation, we can further find
 \begin{equation*}\mathbb{E}\!\left[ \widehat{\boldsymbol{\mu }_{N,n}(\boldsymbol{\Theta} )}\right] =\mathbb{E}\!\left[ \mathbb{E}\!\left( \left. \widehat{\boldsymbol{\mu }_{N,n}(\boldsymbol{\Theta} )}\right\vert \boldsymbol{\Theta} \right) \right] =Z_{N,n}\mathbb{E}\!\left[ \boldsymbol{\mu }(\boldsymbol{\Theta} )\right] +(1-Z_{N,n})\boldsymbol{\mu }{_{0}=\boldsymbol{\mu }_{0}.}\end{equation*}
In the average sense,
 $\widehat{\boldsymbol{\mu }_{N,n}(\boldsymbol{\Theta} )}$
is an unconditional unbiased estimation of
 $\mathbb{E}[\boldsymbol{\mu }(\boldsymbol{\Theta} )]$
, which is described as the following proposition.
Proposition 3.2. The credibility estimation
 $\widehat{\boldsymbol{\mu }_{N,n}(\boldsymbol{\Theta} )}$
is an unbiased estimator of the hypothetical mean vector
 $\boldsymbol{\mu }(\boldsymbol{\Theta} )$
, that is,
 \begin{equation*}\mathbb{E}\!\left[ \widehat{\boldsymbol{\mu }_{N,n}(\boldsymbol{\Theta} )}\right] =\mathbb{E}\!\left[ \boldsymbol{\mu }(\boldsymbol{\Theta} )\right] =\boldsymbol{\mu }_{0}.\end{equation*}
As the estimation of
 $\boldsymbol{\mu }(\boldsymbol{\Theta} )$
, the mean quadratic error matrix of the credibility estimator
 $\widehat{\boldsymbol{\mu }_{N,n}(\boldsymbol{\Theta} )}$
is given below.
Proposition 3.3. The mean quadratic error matrix of the credibility estimator
 $\widehat{\boldsymbol{\mu }_{N,n}(\boldsymbol{\Theta} )}$
is given by:
 \begin{equation*}\mathbb{E}\!\left[ \left( \widehat{\boldsymbol{\mu }_{N,n}(\boldsymbol{\Theta} )}-{\boldsymbol{\mu }}(\boldsymbol{\Theta} )\right) \left( \widehat{\boldsymbol{\mu }_{N,n}(\boldsymbol{\Theta} )}-{\boldsymbol{\mu}}(\boldsymbol{\Theta} )\right) ^{\prime }\right] =\frac{Z_{N,n}^{2}}{n}\Sigma_{0}+(1-Z_{N,n})^{2}T.\end{equation*}
Moreover, as
 $n\rightarrow \infty $
, the mean quadratic error matrix tends to a
 $p\times p$
zero matrix:
 \begin{equation*}\mathbb{E}\!\left[ \left( \widehat{\boldsymbol{\mu }_{N,n}(\boldsymbol{\Theta} )}-{\boldsymbol{\mu }}(\boldsymbol{\Theta} )\right) \left( \widehat{\boldsymbol{\mu }_{N,n}(\boldsymbol{\Theta} )}-{\boldsymbol{\mu}}(\boldsymbol{\Theta} )\right) ^{\prime }\right] \rightarrow 0_{p\times p},\end{equation*}
and hence
 \begin{equation*}\mathbb{E}\!\left[ \left\vert \left\vert \widehat{\boldsymbol{\mu }_{N,n}(\boldsymbol{\Theta} )}-{\boldsymbol{\mu }}(\boldsymbol{\Theta} )\right\vert \right\vert _{\boldsymbol{\xi} }^{2}\right] =\mathbb{E}\!\left[ \boldsymbol{\xi} ^{\prime }\left( \widehat{\boldsymbol{\mu }_{N,n}(\boldsymbol{\Theta} )}-{\boldsymbol{\mu }}(\boldsymbol{\Theta} )\right) \left( \widehat{\boldsymbol{\mu }_{N,n}(\boldsymbol{\Theta} )}-{\boldsymbol{\mu }}(\boldsymbol{\Theta} )\right) ^{\prime }\boldsymbol{\xi} \right] \rightarrow 0.\end{equation*}
where
 $||\cdot ||_{\boldsymbol{\xi} }^{2}$
represents the weighted Frobenius norm,Footnote 8
 $\boldsymbol{\xi} =\left(\xi _{1},\xi _{2},\cdots, \xi _{p}\right) ^{\prime }$
represents the weight vector, and
 $\xi_{i}\geq 0$
, for
 $i=1,2,\cdots,p$
such that
 $\sum_{i=1}^{p}\xi_{i}=1$
.
3.3. Credibility estimator for the process variance
Note that
 \begin{equation*}\Sigma(\boldsymbol{\Theta})=\int_{\mathbb{R}^{p}}\left[\left(\textbf{y}-\int_{\mathbb{R}^{p}}\textbf{y}dF\!\left(\left.\textbf{y}\right\vert\boldsymbol{\Theta}\right)\right)\left(\textbf{y}-\int_{\mathbb{R}^{p}}\textbf{y}dF\!\left(\left.\textbf{y}\right\vert\boldsymbol{\Theta}\right)\right)^{\prime}\right]dF\!\left(\left.\textbf{y}\right\vert\boldsymbol{\Theta}\right).\end{equation*}
We can first achieve the credibility estimator of the conditional variance based on
 $\widehat{F}\!\left( \left. {\textbf{y}}\right\vert \boldsymbol{\Theta}\right) $
and then obtain the credibility estimator of
 $\Sigma (\boldsymbol{\Theta} )$
. For this purpose, let
 \begin{equation*}U_{n}=\frac{1}{n}\sum_{i=1}^{n}\textbf{Y}_{i}\textbf{Y}_{i}^{\prime }\quad \mbox{and}\quad U_{0}=\int_{\mathbb{R}^{p}} \textbf{yy}^{\prime }dF_{0}\!\left( {\textbf{y}}\right).\end{equation*}
The following proposition can be reached.
Proposition 3.4. Under the Bayesian model settings stated in Assumptions 2.1 and 2.2, replacing
 $F\!\left( \left. {\textbf{y}}\right\vert \boldsymbol{\Theta} \right) $
with
 $\widehat{F}\!\left( \left. {\textbf{y}}\right\vert \boldsymbol{\Theta} \right) $
in Equation (3.2), the credibility estimation of the conditional covariance matrix
 $\Sigma (\boldsymbol{\Theta} )$
is given by:
 \begin{equation*}\widehat{\Sigma _{N,n}(\boldsymbol{\Theta} )}=\omega _{1,n}\Sigma _{n}+\omega_{2,n}\Sigma _{0}+(1-\omega _{1,n}-\omega _{2,n})M_{0},\end{equation*}
where
 $\Sigma _{0}=\mathbb{E}\!\left[ \Sigma (\boldsymbol{\Theta} )\right] $
,
 $\Sigma _{n}=\frac{1}{n}\sum_{i=1}^{n}\left( \textbf{Y}_{i}-\overline{\textbf{Y}}\right) \left( \textbf{Y}_{i}-\overline{\textbf{Y}}\right) ^{\prime }$
is the sample covariance matrix, and
 \begin{equation*}\omega _{1,n}=Z_{N,n}^{2},\quad \omega _{2,n}=(1-Z_{N,n})^{2},\quad M_{0}=\frac{1}{2}\left( U_{n}-\overline{\textbf{Y}}\boldsymbol{\mu }_{0}^{\prime }-\boldsymbol{\mu }_{0}\overline{\textbf{Y}}^{\prime }+U_{0}\right) .\end{equation*}
Notably, the credibility estimation of the conditional covariance matrix is consisting of three parts. According to Proposition 3.4 and property (3.13), it holds that
 $\omega_{1,n}\rightarrow1$
and
 $\omega_{2,n}\rightarrow0$
as
 $n\rightarrow\infty$
. Therefore, when n is large, the credibility estimate
 $\widehat{\Sigma_{N,n}(\boldsymbol{\Theta})}$
assigns more weight to sample covariance matrix
 $\Sigma_{n}$
. Conversely, more weight is assigned to
 $\Sigma_{0}$
and
 $M_{0}$
when the sample size is smaller.
3.4. Statistical properties of the estimators
The consistency and asymptotic normality of
 $\widehat{\boldsymbol{\mu }_{N,n}(\boldsymbol{\Theta} )}$
and
 $\widehat{\Sigma _{N,n}(\boldsymbol{\Theta} )}$
are given in the following two theorems.
Theorem 3.2. Given
 $\boldsymbol{\Theta}$
, the estimators
 $\widehat{\boldsymbol{\mu }_{N,n}(\boldsymbol{\Theta} )}$
and
 $\widehat{\Sigma _{N,n}(\boldsymbol{\Theta} )}$
are strongly consistent with respect to the conditional mean vector
 $\boldsymbol{\mu }(\boldsymbol{\Theta})$
and conditional covariance matrix
 $\Sigma (\boldsymbol{\Theta} )$
, respectively. That is, when
 $n\rightarrow \infty $
, we have
 \begin{equation*}\widehat{\boldsymbol{\mu }_{N,n}(\boldsymbol{\Theta} )}\rightarrow \boldsymbol{\mu }(\boldsymbol{\Theta}),\,\,a.s.\quad \mbox{and}\quad \widehat{\Sigma _{N,n}(\boldsymbol{\Theta} )}\rightarrow\Sigma (\boldsymbol{\Theta} ),\,\,a.s.\end{equation*}
Theorem 3.3. Given
 $\boldsymbol{\Theta}$
, the estimator
 $\widehat{\boldsymbol{\mu }_{N,n}(\boldsymbol{\Theta} )}$
is asymptotically normal when
 $n\rightarrow \infty $
, that is,
 \begin{equation*}\sqrt{n}\left( \widehat{\boldsymbol{\mu }_{N,n}(\boldsymbol{\Theta} )}-\boldsymbol{\mu }(\boldsymbol{\Theta})\right) \overset{L}{\rightarrow }N(0,\Sigma (\boldsymbol{\Theta} )),\end{equation*}
where “
 $\overset{L}{\rightarrow }$
” means convergence in law/distribution.
Theorems 3.2 and 3.3 demonstrate that
 $\widehat{\boldsymbol{\mu }_{N,n}(\boldsymbol{\Theta} )}$
and
 $\widehat{\Sigma _{N,n}(\boldsymbol{\Theta})}$
serve as good estimators of the conditional mean vector
 $\boldsymbol{\mu }(\boldsymbol{\Theta})$
and conditional covariance matrix
 $\Sigma (\boldsymbol{\Theta})$
. Both of them can be plugged in any continuous statistical functionals of these two quantities.
Next, we proceed with a theoretical comparison on the mean of the weighted
 $F$
-norms between our new credibility estimation
 $\widehat{\boldsymbol{\mu }_{N,n}(\boldsymbol{\Theta} )}$
and the traditional credibility estimation
 $\widehat{\boldsymbol{\mu }_{C,n}(\boldsymbol{\Theta} )}$
. To simplify the analysis, we first assume that
 $p=2$
and introduce the following notations:
 \begin{equation*}\boldsymbol{\mu }(\boldsymbol{\Theta} )=\mathbb{E}[\textbf{Y}_{1}|\boldsymbol{\Theta} ]=\left(\begin{array}{c}{\mu }_{1}(\Theta ) \\[4pt]{\mu }_{2}(\Theta )\end{array}\right), \quad \Sigma {(\boldsymbol{\Theta} )}=\mathbb{V}[\textbf{Y}_{1}|\boldsymbol{\Theta} ]=\left(\begin{array}{c@{\quad}c}\sigma _{1}^{2}(\Theta ) & \nu _{2}(\Theta ) \\[4pt]\nu _{2}(\Theta ) & \sigma _{2}^{2}(\Theta )\end{array}\right)\end{equation*}
and
 \begin{equation*}\boldsymbol{\mu }_{0}=\mathbb{E}(\boldsymbol{\mu }(\boldsymbol{\Theta} ))=\left(\begin{array}{c}{\mu }_{1} \\{\mu }_{2}\end{array}\right), \quad T=\mathbb{V}(\boldsymbol{\mu }(\boldsymbol{\Theta} ))=\left(\begin{array}{c@{\quad}c}\tau _{1}^{2} & \nu _{1} \\[4pt]\nu _{1} & \tau _{2}^{2}\end{array}\right), \quad \Sigma _{0}=\mathbb{E}(\Sigma (\boldsymbol{\Theta} ))=\left(\begin{array}{c@{\quad}c}\sigma _{1}^{2} & \nu _{2} \\[4pt]\nu _{2} & \sigma _{2}^{2}\end{array}\right) .\end{equation*}
where
 $\nu _{1}=\rho _{1}\tau _{1}\tau _{2}$
,
 $\nu _{2}=\rho _{2}\sigma_{1}\sigma _{2}$
, and
 \begin{equation}\rho _{1}=\frac{\mathbb{C}\unicode{x1D560}\unicode{x1D567}\!\left( {\mu }_{1}\left( \Theta \right), {\mu }_{2}\left( \Theta \right) \right) }{\sqrt{\mathbb{V}\!\left( {\mu }_{1}\left( \Theta \right) \right)\mathbb{V}\!\left( {\mu }_{2}\left( \Theta \right) \right) }},\quad\rho _{2}=\frac{\mathbb{E}\!\left[ \mathbb{C}\unicode{x1D560}\unicode{x1D567}\!\left(\left.Y_{1}^{(1)},Y_{1}^{(2)}\right\vert\boldsymbol{\Theta} \right) \right] }{\sqrt{\mathbb{E}\!\left[\mathbb{V}\!\left(\left. Y_{1}^{(1)}\right\vert\Theta_{1} \right) \right] \mathbb{E}\!\left[ \mathbb{V}\!\left(\left. Y_{1}^{(2)}\right\vert\Theta_{2} \right) \right] }}. \end{equation}
Here,
 $\rho _{1}$
and
 $\rho _{2}$
represent the two correlation coefficients denoting the inter-dependence among risks and the intra-dependence within each risk, respectively.
Proposition 3.5. Consider
 $p=2$
and
 $\boldsymbol{\xi} =(\xi _{1},\xi _{2})^{\prime }$
. Based on Theorem 2.1 and Proposition 3.1, the mean of the weighted F-norms for the error of estimates
 $\widehat{\boldsymbol{\mu }_{N,n}(\boldsymbol{\Theta} )}$
and
 $\widehat{\boldsymbol{\mu }_{C,n}(\boldsymbol{\Theta} )}$
can be expressed as:
 \begin{equation}\mathbb{E}\!\left[ \left\vert \left\vert \widehat{\boldsymbol{\mu }_{N,n}(\boldsymbol{\Theta} )}-\boldsymbol{\mu }(\boldsymbol{\Theta} )\right\vert \right\vert _{\boldsymbol{\xi} }^{2}\right] =\frac{n\tau _{0}^{4}\left( \xi _{1}\sigma _{1}^{2}+\xi _{2}\sigma _{2}^{2}\right)}{\left( n\tau _{0}^{2}+\sigma _{0}^{2}\right) ^{2}}+\frac{\sigma_{0}^{4}\left( \xi _{1}\tau _{1}^{2}+\xi _{2}\tau _{2}^{2}\right) }{\left(n\tau _{0}^{2}+\sigma _{0}^{2}\right) ^{2}} \end{equation}
and
 \begin{equation}\mathbb{E}\!\left[ \left\vert \left\vert \widehat{\boldsymbol{\mu }_{C,n}(\boldsymbol{\Theta} )}-\boldsymbol{\mu }(\boldsymbol{\Theta} )\right\vert \right\vert _{\boldsymbol{\xi} }^{2}\right] =\Delta_{1}+\Delta _{2}+\Delta _{3}+\Delta _{4}, \end{equation}
respectively, where
 \begin{align*} \Delta _{1} & =\frac{n\delta _{1}\left( \xi _{1}\left(\tau _{1}^{2}\delta _{2}-\nu_{1}\delta _{3}\right)^{2}+\xi _{2}\left(\nu _{1}\sigma _{1}^{2}-\nu _{2}\tau_{1}^{2}\right)^{2}\right) }{\left( \delta _{1}\delta _{2}-\delta _{3}^{2}\right)^{2}}, \\[5pt] \Delta _{2} & =\frac{n\delta _{2}\left( \xi _{1}\left(\tau _{2}^{2}\delta _{1}-\nu_{1}\delta _{3}\right)^{2}+\xi _{2}\left(\nu _{1}\sigma _{2}^{2}-\nu _{2}\tau_{2}^{2}\right)^{2}\right) }{\left( \delta _{1}\delta _{2}-\delta _{3}^{2}\right)^{2}}, \\[5pt]\Delta _{3} & =\frac{1}{({-}2\nu _{1})^{-1}\left( \delta _{1}\delta _{2}-\delta_{3}^{2}\right) ^{2}}\times \left[ n\nu _{1}\sigma _{1}^{2}\sigma_{2}^{2}(\xi _{2}\delta _{1}+\xi _{1}\delta _{2})-n\nu _{2}\left( \xi_{2}\tau _{1}^{2}\sigma _{2}^{2}\delta _{1}\right. \right. \\[5pt]& \quad \left. \left. +\xi _{1}\tau _{2}^{2}\sigma _{1}^{2}\delta_{2}-\delta _{3}\left( \nu _{2}(\xi _{2}\tau _{1}^{2}+\xi _{1}\tau_{2}^{2})-\nu _{1}\left(\xi _{2}\sigma _{1}^{2}+\xi _{1}\sigma _{2}^{2}\right)\right)\right) \right], \\[5pt]\Delta _{4} & =\frac{\xi _{2}\left(\sigma _{2}^{2}-n\tau _{2}^{2}\right)\delta _{1}\tau_{2}^{2}+\xi _{1}\left(\sigma _{1}^{2}-n\tau _{1}^{2}\right)\delta _{2}\tau_{1}^{2}-\left(\nu _{2}-n\nu _{1}\right)\left(\xi _{1}\tau _{1}^{2}+\xi _{2}\tau_{2}^{2}\right)\delta _{3}}{\delta _{1}\delta _{2}-\delta _{3}^{2}}\end{align*}
and
 \begin{equation*}\delta _{1}=n\tau _{1}^{2}+\sigma _{1}^{2},\quad \delta _{2}=n\tau_{2}^{2}+\sigma _{2}^{2},\quad \delta _{3}=n\nu _{1}+\nu _{2}.\end{equation*}
Compared to the traditional multivariate credibility estimation
 $\widehat{\boldsymbol{\mu }_{C,n}(\boldsymbol{\Theta} )}$
, the mean of the weighted F-norms for the error of the new credibility estimation
 $\widehat{\boldsymbol{\mu }_{N,n}(\boldsymbol{\Theta})}$
is more straightforward to compute. The main reason is that the credibility factor
 ${Z}_{C,n}$
in the traditional model is a matrix, while in our estimation
 $\widehat{\boldsymbol{\mu }_{N,n}(\boldsymbol{\Theta} )}$
, the corresponding credibility factor
 $Z_{N,n}$
is a scalar. This scalar form simplifies the computation process and enhances user-friendliness and interpretability.
Indeed, according to the result of Proposition 3.5, when
 $p>2$
, the mean of the weighted F-norms for the error of
 $\widehat{\boldsymbol{\mu }_{N,n}(\boldsymbol{\Theta} )}$
can be calculated as:
 \begin{align*}\mathbb{E}\!\left[ \left\vert \left\vert \widehat{\boldsymbol{\mu }_{N,n}(\boldsymbol{\Theta} )}-\boldsymbol{\mu }(\boldsymbol{\Theta} )\right\vert \right\vert _{\boldsymbol{\xi} }^{2}\right] & =\mathbb{E}\!\left[ \xi _{1}\left( \widehat{{\mu }_{N,n}^{(1)}(\Theta )}-{\mu }_{1}(\Theta )\right) ^{2}\right] +\cdots +\mathbb{E}\!\left[ \xi_{p}\!\left( \widehat{{\mu }_{N,n}^{(p)}(\Theta )}-\boldsymbol{\mu }_{p}(\Theta )\right) ^{2}\right] \\& =\frac{n\tau _{0}^{4}\left( \xi _{1}\sigma _{1}^{2}+\cdots +\xi _{p}\sigma_{p}^{2}\right) }{\left( n\tau _{0}^{2}+\sigma _{0}^{2}\right) ^{2}}+\frac{\sigma _{0}^{4}\left( \xi _{1}\tau _{1}^{2}+\cdots +\xi _{p}\tau_{p}^{2}\right) }{\left( n\tau _{0}^{2}+\sigma _{0}^{2}\right) ^{2}}.\end{align*}
The traditional multivariate credibility estimation
 $\widehat{\boldsymbol{\mu}_{C,n}(\boldsymbol{\Theta})}$
minimizes problem (2.2), and thus, in the sense that the matrix
 $A-B \leq0$
is equivalent to
 $B-A$
being a positive definite matrix, it is evident that
 \[\mathbb{E}\!\left[\left(\widehat{\boldsymbol{\mu}_{C,n}(\boldsymbol{\Theta})}-\boldsymbol{\mu}(\boldsymbol{\Theta})\right) \left(\widehat{\boldsymbol{\mu}_{C,n}(\boldsymbol{\Theta})}-\boldsymbol{\mu}(\boldsymbol{\Theta})\right)^{\prime}\right]\leq \mathbb{E}\!\left[\left(\widehat{\boldsymbol{\mu}_{N,n}(\boldsymbol{\Theta})}-\boldsymbol{\mu}(\boldsymbol{\Theta})\right) \left(\widehat{\boldsymbol{\mu}_{N,n}(\boldsymbol{\Theta})}-\boldsymbol{\mu}(\boldsymbol{\Theta})\right)^{\prime}\right].\]
In other words,
 $\widehat{\boldsymbol{\mu}_{N,n}(\boldsymbol{\Theta})}$
is dominated by
 $\widehat{\boldsymbol{\mu}_{C,n}(\boldsymbol{\Theta})}$
in terms of the mean squared loss, which will be illustrated in Section 4 by two numerical examples. However, it would be interesting to see that our method perform competitively with the traditional one when the sample size is moderate or large.
For the case of
 $p=2$
, a comparison of the mean of the weighted F-norms for the error for both credibility estimations leads to the following conclusion.
Proposition 3.6. In Equation (3.14), if
 $\rho _{1}=\rho _{2}=0$
(i.e.,
 $\nu _{1}=\nu _{2}=0$
), then we have
 \begin{equation}\mathbb{E}\!\left[ \left\vert \left\vert \widehat{\boldsymbol{\mu }_{C,n}(\boldsymbol{\Theta} )}-\boldsymbol{\mu }(\boldsymbol{\Theta} )\right\vert \right\vert _{\boldsymbol{\xi} }^{2}\right] \leq\mathbb{E}\!\left[ \left\vert \left\vert \widehat{\boldsymbol{\mu }_{N,n}(\boldsymbol{\Theta} )}-\boldsymbol{\mu }(\boldsymbol{\Theta} )\right\vert \right\vert _{\boldsymbol{\xi }}^{2}\right] .\end{equation}
In accordance with Proposition 3.6, it can be readily demonstrated that when
 $p>2$
and
 $\rho_{1}=\cdots=\rho_{p}=0$
, the p-dimensional random vector
 $\textbf{Y}$
demonstrates pairwise independence among its components. The mean of the weighted F-norm for the error in traditional multivariate credibility estimation is smaller than that for the error in the new estimator. However, when the correlation coefficients
 $\rho_i\neq0 $
for some
 $i=1,\cdots,p$
, the expression for the mean of the weighted F-norm for the error in traditional credibility estimation becomes significantly intricate, rendering a direct comparison of their magnitudes. In the next section dedicated to numerical simulations, we will employ Monte Carlo methods to perform the comparison.
3.5. Application in various premium principles
In nonlife insurance, premium calculation principles are real functionals mapping risk variables to the set of nonnegative real numbers. For a p-dimensional risk
 $\textbf{Y}$
with conditional distribution function
 $F\!\left( \left. \textbf{y}\right\vert \boldsymbol{\Theta} \right) $
, consider the aggregate risk in for such insurance portfolio:
 \begin{equation*}Z=a_{1}Y^{(1)}+\cdots +a_{p}Y^{(p)}=\textbf{a}^{\prime }\textbf{Y},\end{equation*}
where
 $\textbf{Y}=\left( Y^{(1)},Y^{(2)},\cdots,Y^{(p)}\right) ^{\prime }$
and
 $\textbf{a}=\left( a_{1},\cdots,a_{p}\right) ^{\prime }$
are the weights for these business lines such that
 $a_{i}\geq 0$
,
 $i=1,2,\cdots, p$
. Guerra and Centeno (Reference Guerra and Centeno2010) introduced variance-related premium principleFootnote 9 of risk Z with its expression given by:
 \begin{equation}H_{Z}\!\left( \boldsymbol{\Theta} \right) =\left( 1+\lambda_{1} \right) \mathbb{E}\!\left(Z|\boldsymbol{\Theta} \right) +g\!\left( \mathbb{V}\!\left( Z|\boldsymbol{\Theta} \right) \right) =\left(1+\lambda_{1} \right) \textbf{a}^{\prime }\boldsymbol{\mu }\left( \boldsymbol{\Theta} \right) +g\!\left(\textbf{a}^{\prime }\Sigma \!\left( \boldsymbol{\Theta} \right) \textbf{a}\right), \end{equation}
where
 $\lambda_{1} \geq 0$
signifies the nonnegative safety loading factor for the expectation and
 $g\,:\,\mathbb{R}_{+}\mapsto \mathbb{R}_{+}$
is an increasing function such that
 $g(0)=0$
.
By substituting
 $\boldsymbol{\mu }\!\left( \boldsymbol{\Theta} \right) $
and
 $\Sigma \!\left(\boldsymbol{\Theta} \right) $
with their credibility estimators
 $\widehat{\boldsymbol{\mu }_{N,n}(\boldsymbol{\Theta} )}$
and
 $\widehat{\Sigma _{N,n}(\boldsymbol{\Theta} )}$
, respectively, a credibility estimation of
 $H_{Z}\!\left( \boldsymbol{\Theta} \right) $
is achieved as:
 \begin{equation*}\widehat{H_{Z}\!\left( \boldsymbol{\Theta} \right) }=\left( 1+\lambda_{1} \right) \textbf{a}^{\prime }\widehat{\boldsymbol{\mu }_{N,n}(\boldsymbol{\Theta} )}+g\!\left( \textbf{a}^{\prime }\widehat{\Sigma _{N,n}(\boldsymbol{\Theta} )}\textbf{a}\right) .\end{equation*}
It is easy to show that the estimation
 $\widehat{H_{Z}\!\left( \boldsymbol{\Theta} \right) }$
is consistent estimator for risk premium
 $H_{Z}\!\left( \boldsymbol{\Theta} \right) $
according to Theorem 3.2 and the continuity of function g. Based on the premium principle given in Equation (3.18), we obtain credibility estimates of risk premiums under some commonly used actuarial premium principles as follows:
-
• If we set
$g(x)=0$
and
$\lambda_{1} \geq 0$
, then(3.19)is the credibility estimation of risk premium under the expected value premium principle.
\begin{equation}\widehat{H_{Z}^{(1)}\left( \boldsymbol{\Theta} \right) }=\left( 1+\lambda_{1} \right) \textbf{a}^{\prime }\left[ Z_{N,n}\overline{\textbf{Y}}+(1-Z_{N,n}){\boldsymbol{\mu }_{0}}\right] \end{equation}
-
• If we set
$g(x)=\lambda_{2} \cdot x$
and
$\lambda _{1} =0$
, where
$\lambda_{2} \geq 0$
signifies the nonnegative safety loading factor for the variance term, then(3.20)is the credibility estimation of risk premium under the variance premium principle.
\begin{eqnarray}\widehat{H_{Z}^{(2)}\left( \boldsymbol{\Theta} \right) } &=&\textbf{a}^{\prime }\left[ Z_{N,n}\overline{\textbf{Y}}+(1-Z_{N,n}){\boldsymbol{\mu }_{0}}\right] \notag \\[5pt]&&\quad +{{\lambda_{2} \cdot \textbf{a}^{\prime }\left[ \omega _{1,n}\Sigma _{n}+\omega_{2,n}\Sigma _{0}+(1-\omega _{1,n}-\omega _{2,n})M_{0}\right] \textbf{a}}}\end{eqnarray}
-
• If we set
$g(x)={{\lambda_{2}\cdot}}\sqrt{x}$
and
$\lambda_{1} =0$
, then we derive the credibility estimation of risk premium under the standard deviation premium principle as:(3.21)
\begin{eqnarray}\widehat{H_{Z}^{(3)}\left( \boldsymbol{\Theta} \right) } &=&\textbf{a}^{\prime }\left[Z_{N,n}\overline{\textbf{Y}}+(1-Z_{N,n}){\boldsymbol{\mu }_{0}}\right] \notag \\[5pt]&&\quad +{{\lambda_{2} \cdot \sqrt{\textbf{a}^{\prime }\left(\omega _{1,n}\Sigma _{n}+\omega_{2,n}\Sigma _{0}+(1-\omega _{1,n}-\omega _{2,n})M_{0}\right)\textbf{a}}}}.\end{eqnarray}


Of course, we can also obtain the credibility estimation of the exponential premium principle charged for Z as follows:
-
• By plug in the new credibility estimation (3.5), the credibility estimation of risk premium under the exponential premium principle is given by:
(3.22)where
\begin{eqnarray}\widehat{H_{Z}^{(4)}\left( \boldsymbol{\Theta} \right) }&=&\frac{1}{\beta}\log\!\left[\int_{\mathbb{R}^{p}} e^{\beta \textbf{a}^{\prime}\textbf{y}}d\widehat{F}\!\left(\left.\textbf{y}\right\vert\boldsymbol{\Theta}\right)\right]\notag\\[5pt]&=& \frac{1}{\beta}\log\!\left[Z_{N,n}\int_{\mathbb{R}^{p}} e^{\beta \textbf{a}^{\prime}\textbf{y}}dF_{n}(\textbf{y})+\left(1-Z_{N,n}\right)\int_{\mathbb{R}^{p}} e^{\beta \textbf{a}^{\prime}\textbf{y}}dF_{0}(\textbf{y})\right]\notag \\[5pt]&=&\frac{1}{\beta }\log \!\left[Z_{N,n}L_{n}+(1-Z_{N,n})L{_{0}}\right], \end{eqnarray}
$\beta >0$
,
$L_{n}=\frac{1}{n}\sum_{i=1}^{n}\exp \!\left( \beta \textbf{a}^{\prime }\textbf{Y}_{i}\right) $
, and
$L{_{0}=}\mathbb{E}\!\left[ \exp \!\left(\beta \textbf{a}^{\prime }\textbf{Y}_{1}\right) \right] .$


Clearly, compared to traditional multivariate credibility estimates, our estimations have broader applicability, as they can be naturally applied to most premium principles in nonlife insurance and provide corresponding credibility estimators based on the credibility estimate of conditional distribution function.
4. Numerical simulations and case analysis
In this section, we first conduct two numerical simulations to compare the conditional and unconditional mean of the weighted F-norms for the errors of the traditional estimator and our proposed estimator. We then calculate predicted values of various premium principles by applying the new credibility estimator to two insurance scenarios.
4.1. Bivariate exponential-gamma model
Assuming that, for a given
 $\boldsymbol{\Theta}=\boldsymbol{\theta} $
, where
 $\boldsymbol{\Theta}=\left(\Theta_{1},\Theta_{2}\right)^{\prime}$
and
 $\boldsymbol{\theta}=\left(\theta_{1},\theta_{2}\right)^{\prime}$
,
 $\textbf{Y}_{1},\textbf{Y}_{2},\cdots, \textbf{Y}_{n}$
are independently and identically distributed according to the bivariate exponential distribution, with the cumulative joint distribution function given by:
 \begin{equation*}F\!\left( \left. {y^{(1)},y^{(2)}}\right\vert \boldsymbol{\Theta}=\boldsymbol{\theta} \right)=1-\exp \!\left\{ -\frac{y^{(1)}}{\theta _{1}}\right\} -\exp \!\left\{ -\frac{y^{(2)}}{\theta _{2}}\right\} +\exp \!\left\{ -\frac{y^{(1)}}{\theta _{1}}-\frac{y^{(2)}}{\theta _{2}}-\frac{\rho _{2}}{\theta _{1}\theta _{2}}y^{(1)}y^{(2)}\right\}, \end{equation*}
and the corresponding probability density function is
 \begin{equation*}f\!\left( \left. {y^{(1)},y^{(2)}}\right\vert \boldsymbol{\Theta}=\boldsymbol{\theta} \right) =\left[ -\frac{\rho _{2}}{\theta _{1}\theta _{2}}+\left( \frac{1}{\theta _{1}}+\frac{\rho _{2}}{\theta _{1}\theta _{2}}y^{(2)}\right) \left( \frac{1}{\theta _{2}}+\frac{\rho _{2}}{\theta _{1}\theta _{2}}y^{(1)}\right) \right]e^{-\frac{y^{(1)}}{\theta _{1}}-\frac{y^{(2)}}{\theta _{2}}-\frac{\rho _{2}}{\theta _{1}\theta _{2}}y^{(1)}y^{(2)}},\end{equation*}
where
 $y^{(1)},y^{(2)}\geq 0$
and
 $\rho_{2}\in [-1,1]$
.
Further, we assume that
 $\theta _{1}$
and
 $\theta _{2}$
are independent of each other and follow gamma prior with density functions:
 \begin{equation*}\pi_{\Theta_{1}} (\theta _{1})=\frac{\beta _{1}^{\alpha _{1}}}{\Gamma (\alpha _{1})}\theta _{1}^{\alpha _{1}-1}e^{-\beta _{1}\theta _{1}},\quad \theta_{1},\alpha _{1},\beta _{1}>0,\end{equation*}
and
 \begin{equation*}\pi_{\Theta_{2}} (\theta _{2})=\frac{\beta _{2}^{\alpha _{2}}}{\Gamma (\alpha _{2})}\theta _{2}^{\alpha _{2}-1}e^{-\beta _{2}\theta _{2}},\quad \theta_{2},\alpha _{2},\beta _{2}>0\end{equation*}
respectively.
Set
 $\alpha _{1}=2.4$
,
 $\alpha _{2}=3.2$
,
 $\beta _{1}=5.4$
,
 $\beta _{2}=2.8$
, and
 $\rho _{2}=0.2$
. By utilizing Equations (2.1), (3.8), and (3.9) and using the Monte Carlo integration method,Footnote 10 the values for various structural parameters are approximately obtained as follows:
 \begin{equation*}{\boldsymbol{\mu }_{0}}\approx \left(\begin{array}{c}0.0263 \\[5pt]0.0424\end{array}\right), \quad {T}\approx \left(\begin{array}{c@{\quad}c}0.0015 & 0 \\[5pt]0 & 0.0017\end{array}\right), \quad {\Sigma _{0}}\approx \left(\begin{array}{c@{\quad}c}0.0133 & 0.0043 \\[5pt]0.0043 & 0.0355\end{array}\right), \end{equation*}
and
 \begin{equation*}{\tau _{0}^{2}}\approx 0.0026,\qquad {\sigma _{0}^{2}}\approx 0.0387.\end{equation*}
Furthermore, the corresponding conditional mean of the weighted F-norm for the error are obtained as:
 \begin{equation}\textrm{MSE}_{k,n}(\boldsymbol{\theta} )=\mathbb{E}\!\left[ \left\vert \left\vert \widehat{\boldsymbol{\mu }_{k,n}(\boldsymbol{\Theta} )}-\boldsymbol{\mu }(\boldsymbol{\Theta} )\right\vert \right\vert_{\boldsymbol{\xi} }^{2}\bigg|\boldsymbol{\Theta}=\boldsymbol{\theta} \right], \quad k=C\,\,or\,\,N. \end{equation}
Taking
 $\boldsymbol{\xi} =(0.4,0.6)^{\prime }$
and different values of
 $(\theta_{1},\theta _{2})$
and n, the simulation is repeated 10,000 times, and the simulation results are given in Table 1.
Conditional mean of the weighted F-norm for the error for different values of
 $(\theta _{1},\theta _{2})$
and n.

Based on the simulation results presented in Table 1, some observations can be made as follows:
-
• When the sample size n is given, as the
$\theta_{1}$
and
$\theta _{2}$
increase, the conditional mean of the weighted F-norms for the errors of
$\widehat{\boldsymbol{\mu }_{C,n}(\boldsymbol{\Theta} )}$
and
$\widehat{\boldsymbol{\mu }_{N,n}(\boldsymbol{\Theta} )}$
also increase. -
• For a given set of
$(\theta_{1},\theta_{2})$
, both estimators exhibit a decreasing trend in their conditional mean of the weighted F-norms for the errors as the sample size n increases, indicating that they both satisfy the consistency property. -
• Note that the true means of
$\Theta_1$
and
$\Theta_2$
are 4/9 and 8/7, respectively. For various settings of
$(\theta_{1},\theta_{2})$
taking values around
$(4/9,8/7)$
,
$\widehat{\boldsymbol{\mu }_{N,n}(\boldsymbol{\Theta} )}$
has lower values of conditional mean of the weighted F-norms compared with
$\widehat{\boldsymbol{\mu }_{C,n}(\boldsymbol{\Theta} )}$
. As the sample size grows, the difference becomes negligible. This demonstrates great performances of our proposed estimators.


To verify the asymptotic normality of
 $\widehat{\boldsymbol{\mu }_{N,n}(\boldsymbol{\Theta} )}$
, we take different values of
 $(\theta _{1},\theta _{2})$
and n and repeat the simulation 10,000 times, where we continue to set
 $\alpha _{1}=2.4$
,
 $\alpha _{2}=3.2$
,
 $\beta _{1}=5.4$
,
 $\beta _{2}=2.8$
, and
 $\rho _{2}=0.2$
. The corresponding Q-Q plots are shown in Figures 1–6.
Q-Q plot for
 $\theta_{1}=0.3,\theta_{2}=1.0$
.

Q-Q plot for
 $\theta_{1}=0.5,\theta_{2}=1.3$
.

Q-Q plot for
 $\theta_{1}=0.7,\theta_{2}=1.6$
.

Q-Q plot for
 $n=5$
.

Q-Q plot for
 $n=30$
.

Q-Q plot for
 $n=50$
.

Figures 1–3. display the Q-Q plots for different values of
 $(\theta _{1},\theta _{2})$
with a fixed sample size of
 $n=20$
. It is evident that the variations in
 $(\theta _{1},\theta _{2})$
have minimal impact on the asymptotic normality of
 $\widehat{{\mu }_{N,n}^{(1)}(\Theta )}$
and
 $\widehat{{\mu }_{N,n}^{(2)}(\Theta )}$
when the sample size remains constant, where
 $\widehat{\boldsymbol{\mu }_{N,n}(\boldsymbol{\Theta} )}=\left( \widehat{{\mu }_{N,n}^{(1)}(\Theta )},\widehat{{\mu }_{N,n}^{(2)}({\Theta} )}\right) ^{\prime }$
.
On the other hand, Figures 4–6 show the Q-Q plots for
 $\theta _{1}=0.5$
and
 $\theta _{2}=1.3$
with sample sizes of 5, 30, and 50, respectively. It is apparent that the Q-Q plot of the estimation
 $\widehat{\boldsymbol{\mu }_{N,n}(\boldsymbol{\Theta} )}$
obtained in this paper gradually approaches a straight line as the sample size increases, indicating that
 $\widehat{\boldsymbol{\mu }_{N,n}(\boldsymbol{\Theta} )}$
fulfills with asymptotic normality.
4.2. Multivariate normal-normal model
Given the joint distribution function of the sample and the prior distribution
 $\pi({\cdot})$
, we can in general obtain the values of
 $\tau_{0}^{2}$
and
 $\sigma_{0}^{2}$
according to Equations (3.8) and (3.9). However, since there is no explicit cumulative joint distribution function for multivariate normal distribution, we need to estimate the structure parameters
 $\tau_{0}^{2}$
and
 $\sigma_{0}^{2}$
with moment method.
First, we generate a sample of
 $\boldsymbol{\Theta} $
randomly with multivariate normal distribution
 $N_{2}(\boldsymbol{\mu }_{0},T)$
for the sample size m. Then, based on this sample, we randomly generate m groups of samples with a sample size of n with multivariate normal distribution
 $N_{3}(\boldsymbol{\Theta},{{\Sigma_{0} }})$
and then obtain the estimations of
 $\tau _{0}^{2}$
and
 $\sigma_{0}^{2}$
as:
 \begin{equation}\widehat{\tau _{0}^{2}}=\int_{-\infty }^{\infty }\int_{-\infty }^{\infty}\int_{-\infty }^{\infty }\frac{1}{m-1}\sum_{i=1}^{m}\left(F_{n}^{(i)}\left( y^{(1)},y^{(2)},y^{(3)}\right) -\overline{F_{n}\!\left(y^{(1)},y^{(2)},y^{(3)}\right) }\right) ^{2}dy^{(1)}dy^{(2)}dy^{(3)}\end{equation}
and
 \begin{equation}\widehat{\sigma _{0}^{2}}=\int_{-\infty }^{\infty }\int_{-\infty }^{\infty}\int_{-\infty }^{\infty }\frac{1}{m}\sum_{i=1}^{m}\left( F_{n}^{(i)}\left(y^{(1)},y^{(2)},y^{(3)}\right) \left( 1-F_{n}^{(i)}\left(y^{(1)},y^{(2)},y^{(3)}\right) \right) \right) dy^{(1)}dy^{(2)}dy^{(3)},\end{equation}
where
 $F_{n}^{(i)}\left( y^{(1)},y^{(2)},y^{(3)}\right) $
represents the empirical joint distribution function of the i-th sample,
 $i=1,\ldots, m$
, and
 \begin{equation*}\overline{F_{n}\!\left( y^{(1)},y^{(2)},y^{(3)}\right) }=\frac{1}{m}\sum_{i=1}^{m}F_{n}^{(i)}\left( y^{(1)},y^{(2)},y^{(3)}\right) .\end{equation*}
Based on the properties of multivariate normal distribution and Example 2.2, the matrices are defined as follows:
 \begin{equation*}T=\left(\begin{array}{c@{\quad}c@{\quad}c}\tau _{1}^{2} & \rho _{1}\tau _{1}\tau _{2} & \rho _{2}\tau _{1}\tau _{3} \\[4pt]\rho _{1}\tau _{1}\tau _{2} & \tau _{2}^{2} & \rho _{3}\tau _{2}\tau _{3} \\[4pt]\rho _{2}\tau _{1}\tau _{3} & \rho _{3}\tau _{2}\tau _{3} & \tau _{3}^{2}\end{array}\right), \quad \Sigma _{0}=\left(\begin{array}{c@{\quad}c@{\quad}c}\sigma _{1}^{2} & \rho _{4}\sigma _{1}\sigma _{2} & \rho _{5}\sigma_{1}\sigma _{3} \\[4pt]\rho _{4}\sigma _{1}\sigma _{2} & \sigma _{2}^{2} & \rho _{6}\sigma_{2}\sigma _{3} \\[4pt]\rho _{5}\sigma _{1}\sigma _{3} & \rho _{6}\sigma _{2}\sigma _{3} & \sigma_{3}^{2}\end{array}\right), \end{equation*}
and let
 $\boldsymbol{\mu }_{0}=(1.4,0.8,1.2)^{\prime }$
. By varying the elements of matrices T and
 $\Sigma _{0}$
with different values, the unconditional mean of the weighted F-norms for the errors of
 $\widehat{\boldsymbol{\mu }_{C,n}(\boldsymbol{\Theta} )}$
and
 $\widehat{\boldsymbol{\mu }_{N,n}(\boldsymbol{\Theta} )}$
are computed, where the corresponding formulas are given by:
 \begin{equation*}\textrm{MSE}_{k,n}=\mathbb{E}\!\left[ \left\vert \left\vert \widehat{\boldsymbol{\mu }_{k,n}(\boldsymbol{\Theta} )}-\boldsymbol{\mu }(\boldsymbol{\Theta} )\right\vert \right\vert _{\boldsymbol{\xi}}^{2}\right], \quad k=C\,\,or\,\,N,\end{equation*}
where we set
 $\boldsymbol{\xi} =(0.3,0.5,0.2)^{\prime }$
. Upon conducting 1000 repetitions of the procedure, the corresponding means have been computed and reported in Table 2.
Comparison of the unconditional means for different cases.

Table 2 reports the mean value of
 $\textrm{MSE}_{k,n}$
after undergoing 1000 repetitions. Additionally, in Case 1, the matrices T and
 $\Sigma_{0}$
are assumed to hold the following values:
 \begin{equation} T=\left(\begin{array}{c@{\quad}c@{\quad}c}0.2^{2} & 0.006 & 0.008 \\[4pt]0.006 & 0.3^{2} & 0.012 \\[4pt]0.008 & 0.012 & 0.4^2\end{array}\right),\quad\Sigma_{0}=\left(\begin{array}{c@{\quad}c@{\quad}c}0.4^{2} & 0.06 & 0.024 \\[4pt]0.06 & 1.5^{2} & 0.09 \\[4pt]0.024 & 0.09 & 0.6^{2}\end{array}\right),\end{equation}
where
 $\rho_{i}=0.1$
, for
 $i=1,2,\ldots,6$
. In Case 2 and Case 3, we set
 $\rho_{i}=0.5$
and 0.9 for
 $i=1,\cdots,6$
, respectively, while keeping other values unchanged. In Case 4 and Case 5, we take
 $(\tau_{1}, \tau_{2}, \tau_{3})= (0.4,0.6,0.8)$
and
 $(0.8,2.0,1.2)$
, respectively, while other values remain unchanged. In Case 6 and Case 7, we consider
 $(\sigma_{1},\sigma_{2},\sigma_{3})=(0.6,1.7,0.8)$
and
 $(0.8,1.9,1.0)$
, respectively, while other values remain unchanged. The following observations can be made based on the simulation results presented in Table 2:
-
• According to the simulation outcomes in Cases 1–3,
$\textrm{MSE}_{C,n}$
diminishes with escalating correlation coefficients. In contrast, the influence on
$\textrm{MSE}_{N,n}$
remains minimal. -
• The results obtained from simulations in Cases 1, 4, and 5 reveal a noteworthy trend: with all other factors unchanged, the value of
$\textrm{MSE}_{C,n}$
increases with the values of
$(\tau_{1}, \tau_{2}, \tau_{3})$
. On the contrary, the impact on
$\textrm{MSE}_{N,n}$
is particularly pronounced in the context of smaller sample sizes; however, as the sample size grows, this effect diminishes. Moreover, as the parameters
$(\tau_{1}, \tau_{2},\tau_{3})$
increase, the gap between the values of
$\textrm{MSE}_{C,n}$
and
$\textrm{MSE}_{N,n}$
gradually narrows. Furthermore, with larger values of n, situations may arise where
$\textrm{MSE}_{N,n}$
becomes smaller than
$\textrm{MSE}_{C,n}$
, which is in favor of the potential application of our proposed estimator. -
• Based on the simulation outcomes from Case 1, Case 6, and Case 7, both
$\textrm{MSE}_{C,n}$
and
$\textrm{MSE}_{N,n}$
exhibit an increasingness in
$(\sigma _{1},\sigma _{2},\sigma _{3})$
. Besides,
$\widehat{\boldsymbol{\mu }_{N,n}(\boldsymbol{\Theta} )}$
converges more quickly as the sample size increases, and its performance becomes comparable to that of the traditional credibility estimator
$\widehat{\boldsymbol{\mu }_{C,n}(\boldsymbol{\Theta} )}$
.


According to Equations (4.1) and (4.4), Q-Q plots are implemented for different values of
 $(\theta _{1},\theta _{1},\theta _{3})$
and n, which are depicted in Figures 7–12. It is readily seen that the simulation results based on the multivariate normal-normal model exhibit similarities to those under the bivariate exponential-gamma model. In particular irrespective of the specific values of
 $(\theta _{1},\theta _{2},\theta _{3})$
, the asymptotic normality of
 $\widehat{\boldsymbol{\mu }_{N,n}(\boldsymbol{\Theta} )}$
remains largely unaffected by changes in the sample size. However, when
 $(\theta _{1},\theta _{2},\theta _{3})$
is fixed, an interesting trend emerges as the sample size increases: the Q-Q plot of the estimation
 $\widehat{\boldsymbol{\mu }_{N,n}(\boldsymbol{\Theta})}$
becomes progressively closer to a straight line. This observation indicates that
 $\widehat{\boldsymbol{\mu }_{N,n}(\boldsymbol{\Theta} )}$
satisfies asymptotic normality, bolstering its practicability as a new credibility estimator.
Q-Q plot for
 $\theta_{1}=2,\theta_{2}=0.2,\theta_{3}=1.4$
.

Q-Q plot for
 $\theta_{1}=2.2,\theta_{2}=0.4,\theta_{3}=1.6$
.

Q-Q plot for
 $\theta_{1}=2.4,\theta_{2}=0.6,\theta_{3}=1.8$
.

Q-Q plot for
 $n=5$
.

Q-Q plot for
 $n=20$
.

Annual loss data related to fire insurance.
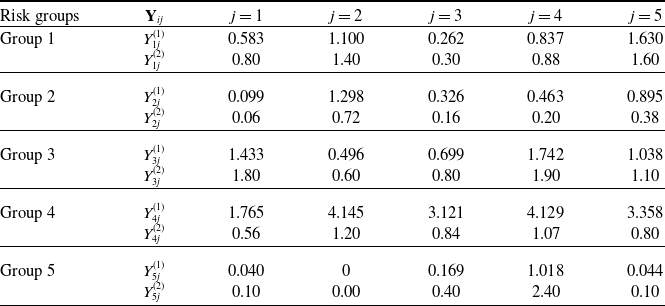
Q-Q plot for
 $n=50$
.

4.3. Case analysis
In this part, we shall adopt two explicit insurance scenarios to show the performances of our proposed estimator. At the meantime, the predicted values based on the traditional credibility method will be also reported for the first application under some specified premium principles.
4.3.1. Application I
To demonstrate the specific application of the new estimators presented in this paper, the data on page 117 of Bühlmann and Gisler (Reference Bühlmann and Gisler2005) from some fire insurance business are used. Table 3 shows the related data for five portfolios of insurance policies in five policy years, where
 $Y_{ij}^{(1)}$
and
 $Y_{ij}^{(2)}$
represent the total loss and loss rateFootnote 11 of the i-th policy portfolio in the j-th year, respectively.
In order to obtain the credibility estimator, the structure parameters
 $\boldsymbol{\mu }_{0}$
, T,
 $\Sigma _{0}$
,
 $\tau _{0}^{2}$
, and
 $\sigma _{0}^{2}$
need to be estimated based on the dataset. With moment estimation method, the corresponding estimations of
 $\boldsymbol{\mu }_{0}$
, T, and
 $\Sigma _{0}$
are given by:
 \begin{equation*}\widehat{\boldsymbol{\mu }}_{0}=\frac{1}{mn}\sum_{i=1}^{m}\sum_{j=1}^{n}\textbf{Y}_{ij},\,\,\widehat{\Sigma }_{0}=\frac{1}{m(n-1)}\sum_{i=1}^{m}\sum_{j=1}^{n}\left(\textbf{Y}_{ij}-\overline{\textbf{Y}}_{i}\right) \left( \textbf{Y}_{ij}-\overline{\textbf{Y}}_{i}\right) ^{\prime },\end{equation*}
and
 \begin{equation*}\widehat{T}=\frac{1}{n(m-1)}\left[ \sum_{i=1}^{m}n\!\left( \overline{\textbf{Y}}_{i}-\widehat{\boldsymbol{\mu }}_{0}\right) \left( \overline{\textbf{Y}}_{i}-\widehat{\boldsymbol{\mu }}_{0}\right) ^{\prime }-(m-1)\widehat{\Sigma }_{0}\right], \end{equation*}
where
 $m=n=5$
, and the estimations of
 $\tau _{0}^{2}$
and
 $\sigma _{0}^{2}$
are given by (4.2) and (4.3), respectively. Based on the dataset in Table 3, those estimators can be calculated as
 $\widehat{\tau _{0}^{2}}=0.5450$
,
 $\widehat{\sigma _{0}^{2}}=0.9591$
, and
 \begin{equation*}\widehat{\boldsymbol{\mu }}_{0}=\left(\begin{array}{c}1.2276 \\[4pt]0.8068\end{array}\right), \quad \widehat{T}=\left(\begin{array}{c@{\quad}c}1.3669 & 0.0864 \\[4pt]0.0864 & 0.0607\end{array}\right), \quad \widehat{\Sigma _{0}}=\left(\begin{array}{c@{\quad}c}0.3795 & 0.2692 \\[4pt]0.2692 & 0.3547\end{array}\right) .\end{equation*}
Based on these results and Equations (3.19)–(3.22), the corresponding credibility estimations under the new estimator and the classical method based on various premium principles are shown in Tables 4–6, where we set
 $\lambda =0.2$
,
 $\rho=0.24$
, and
 $\beta =0.54$
in those four premium principles, and the estimates of
 $U_{0}$
and
 $L_{0}$
are given by:
 \begin{equation}\widehat{U_{0}}=\frac{1}{mn}\sum_{i=1}^{m}\sum_{j=1}^{n}\textbf{Y}_{ij}\textbf{Y}_{ij}^{\prime }\,\,\mbox{and}\,\,\widehat{L_{0}}=\frac{1}{mn}\sum_{i=1}^{m}\sum_{j=1}^{n}\exp \!\left( \beta \textbf{a}^{\prime }\textbf{Y}_{ij}\right). \end{equation}
The values in Tables 4 through 6 illustrate both of the two credibility estimators of risk premium derived for different weight matrix
 $\textbf{a}$
and different premium principles. Specifically, Tables 4 and 5 display the predictions using the novel credibility estimates
 $\widehat{\boldsymbol{\mu }_{N,n}(\boldsymbol{\Theta} )}$
and
 $\widehat{\Sigma _{N,n}(\boldsymbol{\Theta} )}$
, whereas in Table 6, owing to the challenge of estimating the conditional covariance matrix
 $\Sigma (\boldsymbol{\Theta} )$
within traditional multivariate credibility method, we can only report the performance of the expected value premium principle, where the expression for
 $\widehat{H_{Z}^{(1)}(\boldsymbol{\Theta} )}$
based on the traditional multivariate credibility method is
 \begin{equation*}\widehat{H_{Z}^{(1)}\left( \boldsymbol{\Theta} \right) }=\left( 1+\lambda_{1} \right) \textbf{a}^{\prime }\left[ {Z}_{C,n}\overline{\textbf{Y}}+(I_{p}-{Z}_{C,n}){\boldsymbol{\mu }_{0}}\right].\end{equation*}
It can be noted that the outcomes predicted by the new estimator are slightly different with those calculated from the traditional method with respect to
 $\widehat{H_{Z}^{(1)}(\boldsymbol{\Theta})}$
. While for the other three types of premium principles, our method can be easily applied, but the traditional multidimensional credibility is hard to put to use.
Our credibility estimations based on various premium principles.

Our credibility estimations based on various premium principles.
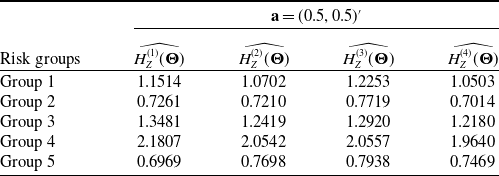
The traditional credibility estimation based on the expected value premium principle.

4.3.2. Application II
To illustrate the practical application of the newly proposed credibility estimates obtained in this paper in higher dimensions, we use the “ClaimsLong” datasetFootnote 12 from the “insuranceData” package in R software; see Wolny-Dominiak and Trzesiok (Reference Wolny-Dominiak and Trzesiok2022). In this dataset, we treat the drivers’ age as the risk profile and categorize it into six classes, that is, 1, 2, 3, 4, 5, 6, with 1 stands for the youngest and 6 stands for the oldest. We use
 $\textbf{Y}_{i}=\left( Y_{i}^{(1)},\cdots, Y_{i}^{(6)}\right) ^{\prime }$
to model the claim severities for these six classes in year i, and we assume a payout of 1000 yuan for each claim. Consequently,
 $\textbf{Y}_{i}$
represents the claim amount in year i, calculated as the number of claims in year i divided by the total number of policies and then multiplied by 1000. To obtain estimates of the structural parameters, we employ the Bootstrap method to resample the dataset. After obtaining m sets of data, we estimate the structural parameters using the same method as the previous case and the estimated values are obtained as
 $\widehat{\tau _{0}^{2}}=12,219.09$
,
 $\widehat{\sigma _{0}^{2}}=33,728.27$
,
 \begin{equation*}\widehat{\boldsymbol{\mu }}_{0}=\left(19.3750,38.6250,48.0500,46.7222,25.0972,15.8972\right) ^{\prime },\end{equation*}
And
 \begin{equation*}\widehat{\Sigma }_{0}=\left(\begin{array}{c@{\quad}c@{\quad}c@{\quad}c@{\quad}c@{\quad}c}422.0484 & 812.1451 & 996.7712 & 970.2049 & 528.0890 & 342.2654 \\[5pt]812.1451 & 1584.5024 & 1943.0102 & 1893.6903 & 1027.0936 & 660.1979 \\[5pt]996.7712 & 1943.0102 & 2409.5705 & 2339.4193 & 1266.2069 & 814.4658 \\[5pt]970.2049 & 1893.6903 & 2339.4193 & 2275.9546 & 1231.5569 & 792.0600 \\[5pt]528.0890 & 1027.0936 & 1266.2069 & 1231.5569 & 668.0973 & 430.0422 \\[5pt]342.2654 & 660.1979 & 814.4658 & 792.0600 & 430.0422 & 279.8111\end{array}\right) .\end{equation*}
With these values and Equations (3.19)–(3.22), the corresponding credibility estimations of the aggregate risk under various premium principles are reported in Table 7, where the weight vector is set as
 $\textbf{a}=(0.1,0.2,0.2,0.2,0.2,0.1)^{\prime}$
and the estimates of
 $U_{0}$
and
 $L_{0}$
are given by Equation (4.5). For the sake of comparisons, we define the expression for the safety loading coefficient as follows:
Credibility estimations for the aggregate risk under various premium principles.

 \begin{equation*}\textrm{Safety loading coefficient} = \frac{ \textrm{Various premium} - \textrm{Net premium}}{\textrm{Net premium}}.\end{equation*}
However, the traditional multidimensional credibility estimator developed by Jewell (Reference Jewell1973) is challenging to apply to this dataset due to the computational complexity involved in calculating the credibility factor matrix, which requires inverting a high-dimensional matrix with six rows and six columns. Although the obtained credibility factor in this study necessitates the calculation of integrals involving multivariate functions, in practical applications, two approaches can be employed to address the integration computation issue. First, if samples from multiple policy contracts are available, the estimation of credibility factors can be obtained based on samples resembling policy contracts outlined in Application II. The second approach involves utilizing Markov Chain Monte Carlo methods to numerically integrate the multivariate function. In comparison with traditional multivariate credibility methods, we believe that the outcomes of this study hold greater practical applicability.
5. Conclusions
This study addresses the computational intricacies associated with the conventional multivariate credibility estimation procedure, specifically in relation to the computation of the credibility factor matrix. To address these challenges, we propose an innovative approach based on the conditional joint distribution function. Moreover, we extend the methodology to include the estimation of the conditional variance matrix and the computation of risk premiums using various premium principles. Through numerical simulations, we verify the cohesiveness and asymptotic normality of the newly formulated estimators. Finally, we demonstrate the practical applicability of these estimators using real insurance company data, highlighting their effectiveness in calculating risk premiums across a range of premium principles. The results consistently indicate the estimated magnitudes of risk groups, regardless of the premium principles considered.
The novel multivariate credibility estimation method proposed in this study simplifies the computation of the credibility factor while maintaining specific structural parameters. In typical situations, the conditional joint distribution function of the sample and the prior distribution is often unknown. In future research, we plan to apply the approach of credibility estimation using joint distributions to address credibility prediction problems in multivariate regression models. Another promising extension would be generalizing the current study to the case of the multidimensional Bühlmann–Straub model.
Acknowledgments
The authors are very grateful for the insightful and constructive comments and suggestions from the editor and three anonymous reviewers, which have greatly improved the presentation of this manuscript. Limin Wen thanks the financial support from Jiangxi Provincial Natural Science foundation (No. 20224BCD41001). Wei Liu thanks the Jiangxi Provincial Graduate Innovation Fund (No. YC2022-s285). Yiying Zhang acknowledges the financial support from the National Natural Science Foundation of China (No. 12101336, 72311530687), GuangDong Basic and Applied Basic Research Foundation (No. 2023A1515011806), and Shenzhen Science and Technology Program (No. JCYJ20230807093312026).
Competing interests
No potential competing interests were reported by the authors.
Supplementary material
To view supplementary material for this article, please visit https://doi.org/10.1017/asb.2024.13



