Introduction
Gastrointestinal (GI) nematodes are parasitic worms that infect the intestinal tract of vertebrates (Albery et al., Reference Albery, Kenyon, Morris, Morris, Nussey and Pemberton2018). Although they are known to suppress their host's immune system (Maizels et al., Reference Maizels, Hewitson and Smith2012), impede growth (Crompton and Nesheim, Reference Crompton and Nesheim2002), and can decrease reproductive output (Akinyi et al., Reference Akinyi, Jansen, Habig, Gesquiere, Susan, Archie, Alberts and Archie2019), they often live many years within a host and generally do not cause mortality (Albery et al., Reference Albery, Kenyon, Morris, Morris, Nussey and Pemberton2018). Nonetheless, mortality has been attributed to GI nematodes in cases of severe infection (Lynsdale et al., Reference Lynsdale, Mumby, Hayward, Mar and Lummaa2017; Pihl et al., Reference Pihl, Nielsen, Olsen, Leifsson and Jacobsen2018), and partially attributed to nematodes in cases where individuals were otherwise compromised by poor nutrition or disease (Condy, Reference Condy1974; Obanda et al., Reference Obanda, Iwaki, Mutinda and Gakuya2011). As such, GI nematodes can affect an individual's fitness.
Studies conducted on wildlife populations have shown that many factors influence how heavily an individual host is infected with GI nematodes, including individual characteristics and environmental factors (e.g. Albery et al., Reference Albery, Kenyon, Morris, Morris, Nussey and Pemberton2018). The individual characteristics of age (Albery et al., Reference Albery, Kenyon, Morris, Morris, Nussey and Pemberton2018), body condition (Sánchez et al., Reference Sánchez, Becker, Teitelbaum, Barriga, Brown, Majewska, Hall and Altizer2018), reproductive status (Cizauskas et al., Reference Cizauskas, Turner, Pitts and Getz2015) and sex (Zuk and McKean, Reference Zuk and McKean1996) have been found to influence the susceptibility of a host to infection. For example, young and old hosts tend to be more susceptible than middle-aged adult hosts, likely because the immune systems of young animals are still developing, while the immune systems of old animals are senescing (Albery et al., Reference Albery, Kenyon, Morris, Morris, Nussey and Pemberton2018). Additionally, environmental factors influence the exposure of a host to infection (González-Hernández et al., Reference González-Hernández, Rangel-Negrín, Schoof, Chapman, Canales-Espinosa and Dias2014). These factors include seasonality (Cizauskas et al., Reference Cizauskas, Turner, Pitts and Getz2015), the cleanliness of available water sources (Khan et al., Reference Khan, Sajid, Khan, Iqbal and Hussain2010), diet (Leung and Koprivnikar, Reference Leung and Koprivnikar2019), and properties of soil such as particle size (Condy, Reference Condy1974).
Factors affecting exposure can also be social; in fact, parasitism has long been recognized as a cost of social living (Rimbach et al., Reference Rimbach, Link, Bisanzio, Gillespie, Galvis and Di Fiore2015). There is some evidence that infection with GI nematodes increases with increasing group size (e.g. Ezenwa and Worsley-Tonks, Reference Ezenwa and Worsley-Tonks2018). Studies have also suggested that more dominant individuals (Smyth and Drea, Reference Smyth and Drea2015), individuals more centrally located within a social network (MacIntosh et al., Reference MacIntosh, Jacobs, Garcia, Shimizu, Mouri, Huffman and Hernandez2012), or individuals with social ties to many different social ‘cliques’ (Vanderwaal et al., Reference Vanderwaal, Obanda, Omondi, McCowan, Wang, Fushing and Isbell2016) may be more exposed to nematode infection, and it has been determined with behavioural focal follows that primates who more frequently touch conspecifics have more GI nematodes (González-Hernández et al., Reference González-Hernández, Rangel-Negrín, Schoof, Chapman, Canales-Espinosa and Dias2014; Rimbach et al., Reference Rimbach, Link, Bisanzio, Gillespie, Galvis and Di Fiore2015).
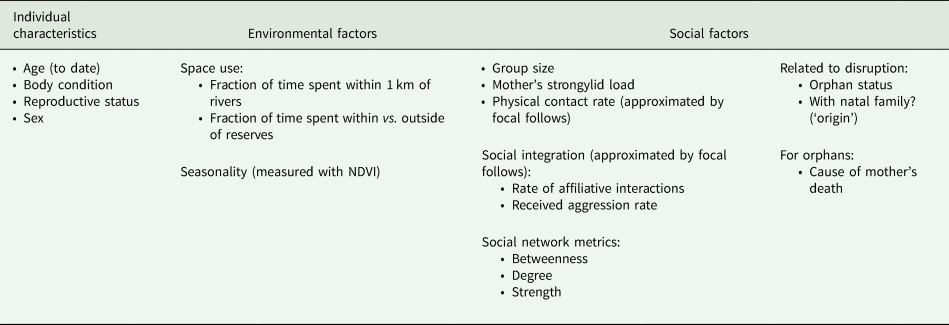
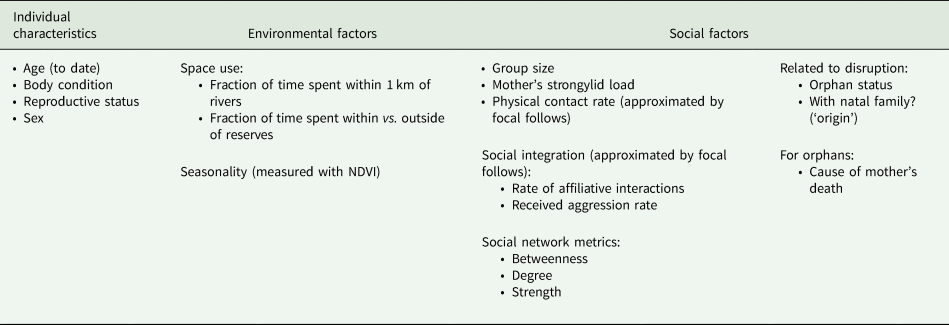
Our objective was to determine which of a suite of individual characteristics, environmental factors, and social factors best explained GI nematode loads in a population of individually known African elephants (Loxodonta africana). To meet this objective, we approximated infection of elephants with commonly occurring nematodes of the suborder Strongylida. Members of Strongylida known to infect African elephants include Murshidia spp., Quilonia spp., and Khalilia spp. of the Strongylidae family, and Grammocephalus clathratus of the Ancylostomatidae family (Allen et al., Reference Allen, Follis and Kistner1974; Condy, Reference Condy1974; Mclean et al., Reference Mclean, Kinsella, Chiyo, Obanda, Moss and Archie2012). Larvae of these strongylids hatch from eggs in elephant dung and become infective after a developmental period of several weeks (Condy, Reference Condy1974; Khan et al., Reference Khan, Roohi and Rana2015). Then the infective larvae migrate to the surrounding soil, the base of plants, and especially to nearby water, where they can be ingested by elephants who are feeding or drinking (Condy, Reference Condy1974). Once ingested, adults of Strongylidae spp. embed themselves in the intestines, and G. clathratus in the bile ducts (Condy, Reference Condy1974). There they lay eggs that are excreted in dung, restarting the life cycle (Condy, Reference Condy1974; Khan et al., Reference Khan, Roohi and Rana2015). Strongylid eggs, although difficult to visually distinguish beyond suborder, are easily recognizable under a microscope (Condy, Reference Condy1974; Thurber et al., Reference Thurber, O'Connell-Rodwell, Turner, Nambandi, Kinzley, Rodwell, Faulkner, Felt and Bouley2011). We counted strongylid eggs in dung collected from individuals under a repeated measures sampling design. We tested these counts for correlations with the individual characteristics of age, body condition, reproductive status, and sex; the environmental factors of space use relative to water and protected areas, and seasonality; and the social factors of group size, whether a mother's level of infection might affect that of her calf, physical contact rates, level of social integration, and social network position (Table 1). We further explored whether social factors related to disruption might correlate with strongylid egg counts by comparing orphaned elephants to non-orphans, orphans who have left their natal family to orphans who have remained, and orphans whose mother died from drought to orphans whose mother was killed by humans (Table 1). This study is the first to investigate such a diverse array of factors in relation to parasitic infection in wild African elephants, and we discuss the conservation implications of our results.
Factors tested for a correlation with strongylid loads in African elephants
Methods
Study site
We conducted our study within the unfenced Samburu and Buffalo Springs Reserves of Kenya, at 0.3–0.8°N and 37–38°E (Wittemyer et al., Reference Wittemyer, Daballen and Douglas-Hamilton2013). The reserves are separated by a semi-permanent river called the Ewaso Ngiro, and together they encompass 220 km2 (Wittemyer et al., Reference Wittemyer, Daballen and Douglas-Hamilton2013). Rainfall averages 350 mm per year, falling in the wet seasons that normally occur from April–May to November – December (Wittemyer et al., Reference Wittemyer, Daballen and Douglas-Hamilton2013). Other months of the year tend to be hot and dry (Wittemyer, Reference Wittemyer2001).
The elephant population that uses the Samburu and Buffalo Springs Reserves has been studied since 1998, such that detailed demographic and social information is available for approximately 1000 individually known elephants (Wittemyer et al., Reference Wittemyer, Daballen and Douglas-Hamilton2013). This information includes familial relations, reproductive status, precise age estimates to within a few weeks of birth for individuals born during the study period, and information on mortality, with carcass surveys revealing the cause of death in some cases (Wittemyer et al., Reference Wittemyer, Daballen and Douglas-Hamilton2013). Of relevance to this study, these data also provide information on the orphan status of individuals, where orphans were defined as individuals that lost their mother prior to being reproductively mature. Long-term GPS tracking data have shown that the reserves encompass <10% of the area used by the study elephants (Wittemyer et al., Reference Wittemyer, Daballen, Rasmussen, Kahindi and Douglas-Hamilton2005a), although several well-known families that were the focus of this study spend the majority of their time within reserve boundaries (Goldenberg et al., Reference Goldenberg, Douglas-hamilton and Wittemyer2018).
Study subjects
From 29 May 2015 through 2 July 2016, we collected dung samples with a minimum interval of two weeks between samples from a single individual, from 38 weaned orphan (n = 25) and non-orphan (n = 13) female subjects, ranging in age from 7 to 21 years, that are regularly seen during long-term monitoring of the population. Twenty-two of these focal individuals were reproductively active by the time we began sampling, so each female was assigned into one of five categories based on her reproductive condition, with 0 = reproductively inactive, 1 = pregnant, 2 = lactating, 3 = lactating and pregnant with a second calf, and 4 = multiparous (only one female fell into the multiparous category for a part of the study). Of the 25 orphan subjects, 19 remained with their natal family, while 6 stayed with a different family. The cause of death, whether natural or anthropogenic, was known for the mothers of 12 orphan subjects.
We also opportunistically collected samples from the offspring of focal individuals with calves. This was to test for a correlation between mother and calf strongylid loads and to increase the age range of sampled individuals. We resulted with additional samples from female calves aged 0–5 (n = 6), and male calves aged 0–3 (n = 9). Furthermore, we opportunistically collected from young bulls to assess sex differences, resulting in additional samples from young bulls aged 8–16 (n = 22). In total, we collected 578 samples from 75 individuals.
Faecal sampling and strongylid egg counts
Focal individuals were followed until they produced a dung sample. From these samples, pinches from the centre of several dung boli were collected and placed into plastic sealable bags without preservatives as recommended by Lynsdale et al. (Reference Lynsdale, dos Santos, Hayward, Mar, Htut, Aung, Soe and Lummaa2015). Eggs are evenly distributed throughout dung boli (Lynsdale et al., Reference Lynsdale, dos Santos, Hayward, Mar, Htut, Aung, Soe and Lummaa2015), therefore homogenization was unnecessary. We recorded whether adult worms were visible in the dung because if adult egg layers were being shed, egg counts might be less representative of infection. We did not have the capacity to genotype and identify adult worms, but their appearance was consistent with descriptions of adults of the family Strongylidae (Condy, Reference Condy1974). We also recorded whether dung was watery because wateriness might lower egg counts by diluting dung matter.
Sample collection was paired with data records taken at the time the sample was produced, including number of individuals in the subject's group, date, GPS coordinates, the time between sample deposition and collection, and time of day the sample was collected. Further, we assessed the body condition of sampled individuals at each collection event, adapting the method of Wijeyamohan et al. (Reference Wijeyamohan, Treiber, Schmitt and Santiapillai2014) based on degree of thinness (i.e. boniness) to African elephants.
One of us (JP) performed faecal egg counts on all samples within 24 h of returning to camp using the McMaster slide method, exactly as described in Gibbons et al. (Reference Gibbons, Jacobs, Fox and Hansen2004). McMaster slides feature overlaying grids under which floating eggs can be counted to derive an eggs per gram (EPG) measure for each dung sample (Gibbons et al., Reference Gibbons, Jacobs, Fox and Hansen2004). This method has been validated as a reasonable estimation of strongylid infection for a subject at the time of sample collection (Seivwright et al., Reference Seivwright, Redpath, Mougeot, Watt and Hudson2004; Levecke et al., Reference Levecke, Behnke, Ajjampur, Albonico, Ame, Charlier, Geiger, Hoa, Ngassam and Kotze2011). The detection limit of Gibbons et al. (Reference Gibbons, Jacobs, Fox and Hansen2004) is 50 EPG, meaning that if an elephant shed fewer than 50 EPG in their dung, their egg count would likely be zero even though they had some strongylids (Lester and Matthews, Reference Lester and Matthews2014). Initially, we used a two-chamber opaque grid McMaster slide (Chalex LLC) prior to switching to a two-chamber green grid McMaster slide (Chalex LLC) because the green grids were easier to see.
Space use
We analysed GPS points from the collars of 8 tracked females over the study period. The 8 collared females included 4 orphan focal individuals and 4 non-orphan older adult females. The data from their collars accounted for the movements of 17 focal individuals because 4 of them were directly collared, and 13 uncollared focal individuals travelled consistently with a collared individual as part of the same core family (Wittemyer et al., Reference Wittemyer, Douglas-Hamilton and Getz2005b). Collars reported a GPS location every hour. We analysed space use data from 7 December 2015 to 10 May 2016, a period during which all collars were reporting that overlapped with the period during which we collected dung. Two metrics were derived for use in analyses: (1) time spent within 1 km of permanent rivers, and (2) time spent within vs outside of reserves. We used ArcGIS version 10.5.1 (ESRI, 2017) to select points within a 1 km buffer of permanent rivers or within the reserves, and derived the proportion of time tracked spent there for each collared elephant.
Physical contact and social integration
One of us (SG) collected focal follow interaction data on a subsample of focal orphan and non-orphan subjects as described in Goldenberg and Wittemyer (Reference Goldenberg and Wittemyer2018). Behavioural interactions recorded included affiliative and aggressive behaviours, many of which involved physical contact (Table 2). Including only individuals who were observed for 2 or more hours (range 2.18–11.85 h, mean 7.75 h) while feeding (n = 23), we calculated three per hour rate: a physical contact rate, an affiliation rate, and a received aggression rate (Table 2). The latter two rates served as proxies for social integration because individuals who engage in more affiliative interactions and do not frequently receive aggression tend to be more socially integrated (Goldenberg and Wittemyer, Reference Goldenberg and Wittemyer2018).
Ethogram of elephant behaviours recorded during focal follows, and the calculated rates which included each behaviour, adapted from Goldenberg and Wittemyer (Reference Goldenberg and Wittemyer2018) and Goldenberg (Reference Goldenberg2016)

Seasonality
As a measure of seasonality, we calculated the normalized difference vegetation index (NDVI), a measure of primary productivity (Prince and Goward, Reference Prince and Goward1995), for a core range area drawn from elephant GPS collar data (Wittemyer et al., Reference Wittemyer, Barner Rasmussen and Douglas-Hamilton2007a, Reference Wittemyer, Getz, Vollrath and Douglas-Hamilton2007b). Landsat raster images (Landsat-7 and Landsat-8 images, courtesy of the U.S. Geological Survey) that overlay the core range were extracted from Google Earth Engine (Gorelick et al., Reference Gorelick, Hancher, Dixon, Ilyushchenko, Thau and Moore2017) for all dates the satellites passed over during the study period with ⩽70% cloud cover. These rasters were then clipped and processed in R using the raster (Hijmans, Reference Hijmans2019), rgdal (Bivand et al., Reference Bivand, Keitt and Rowlingston2019), maptools (Bivand and Lewin-Koh, Reference Bivand and Lewin-Koh2019), sp (Pebesma and Bivand, Reference Pebesma and Bivand2005; Bivand et al., Reference Bivand, Pebesma and Gomez-Rubio2013), and reshape2 (Wickham, Reference Wickham2007) packages to obtain NDVI values for the study period.
Social network position
Including only observations for which observers had seen and identified all elephants present, and including only sampled individuals observed ten or more times during the study period, we calculated simple ratio indices from association data as measures of bond strength (Ginsberg and Young, Reference Ginsberg and Young1992). These association data were recorded based on the proximity of elephants to one another (Wittemyer et al., Reference Wittemyer, Douglas-Hamilton and Getz2005b). Elephants generally cluster such that it is easy to distinguish socially interacting groups, but if there was any doubt, we considered those elephants that were within an estimated 500 m radius of a group's centre to be together (Wittemyer et al., Reference Wittemyer, Douglas-Hamilton and Getz2005b). We used bond strengths to construct social networks and calculated the social network metrics of betweenness, degree and strength (Barrat et al., Reference Barrat, Barthélemy, Pastor-Satorras and Vespignani2004; Krause et al., Reference Krause, Croft and James2007) with the packages statnet (Hunter et al., Reference Hunter, Handcock, Butts, Goodreau and Morris2008; Handcock et al., Reference Handcock, Hunter, Butts, Goodreau, Krivitsky and Morris2018) and igraph (Csárdi and Nepusz, Reference Csárdi and Nepusz2006) in R. These metrics were chosen because they measure varying aspects of how socially connected an elephant is within their society that could influence strongylid infection (Krause et al., Reference Krause, Croft and James2007; Farine and Whitehead, Reference Farine and Whitehead2015). Degree offers a coarse measure of gregariousness because it is the total number of other individuals with which an individual has been in close proximity (Krause et al., Reference Krause, Croft and James2007; Farine and Whitehead, Reference Farine and Whitehead2015). Betweenness measures an individual's role in population interconnectedness by quantifying how often they are the shortest connection between two other individuals who are not themselves directly connected (Krause et al., Reference Krause, Croft and James2007; Farine and Whitehead, Reference Farine and Whitehead2015). Strength measures the sum of associations to others with whom they share connections (Farine and Whitehead, Reference Farine and Whitehead2015).
Statistical analyses
Analyses were conducted in R using generalized linear mixed effects models with a negative binomial error distribution and adaptive Gauss–Hermit quadrature (Kim and Kyung, Reference Kim and Kyung2017). The number of EPG was the response variable in all models, with individual set as the random effect, and family set as an additional random effect in models not including bulls. We controlled for the presence or absence of adult worms in dung (‘visible worms’), time difference between when a sample was dropped and collected (‘time difference’), grid type (engraved/green), whether a sample was watery (a binary variable hereafter referred to as ‘wateriness’) and the number of samples collected per individual (‘n per subject’) by including them as fixed effects in all models.
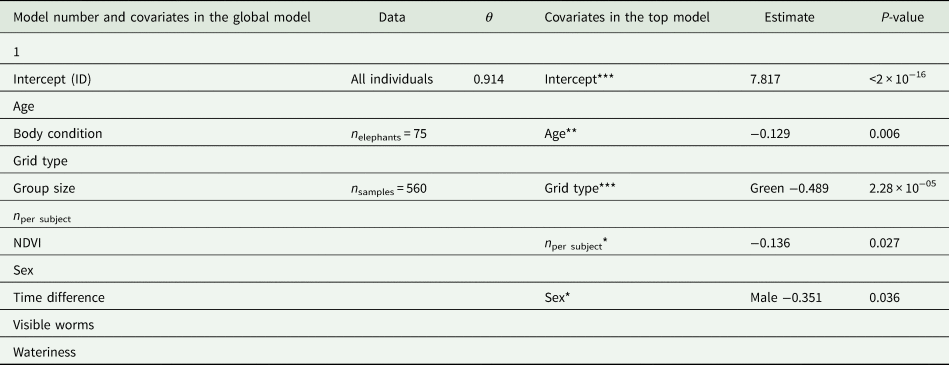
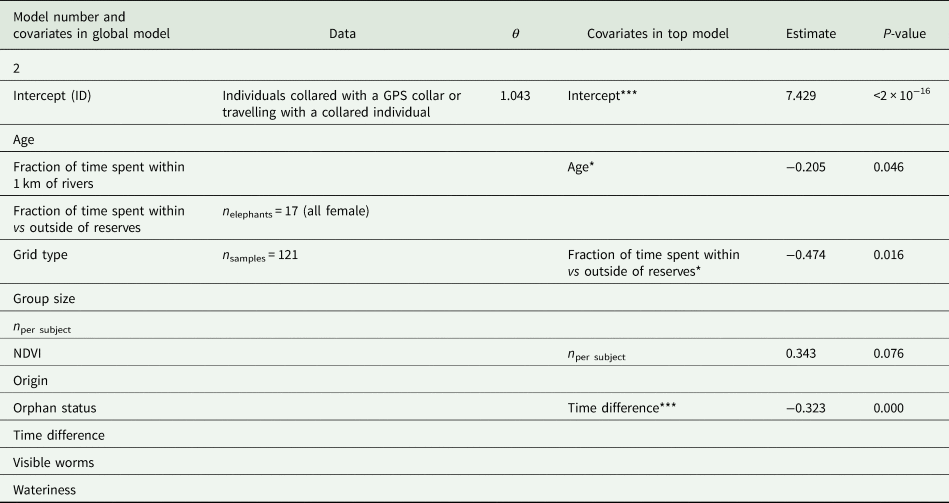
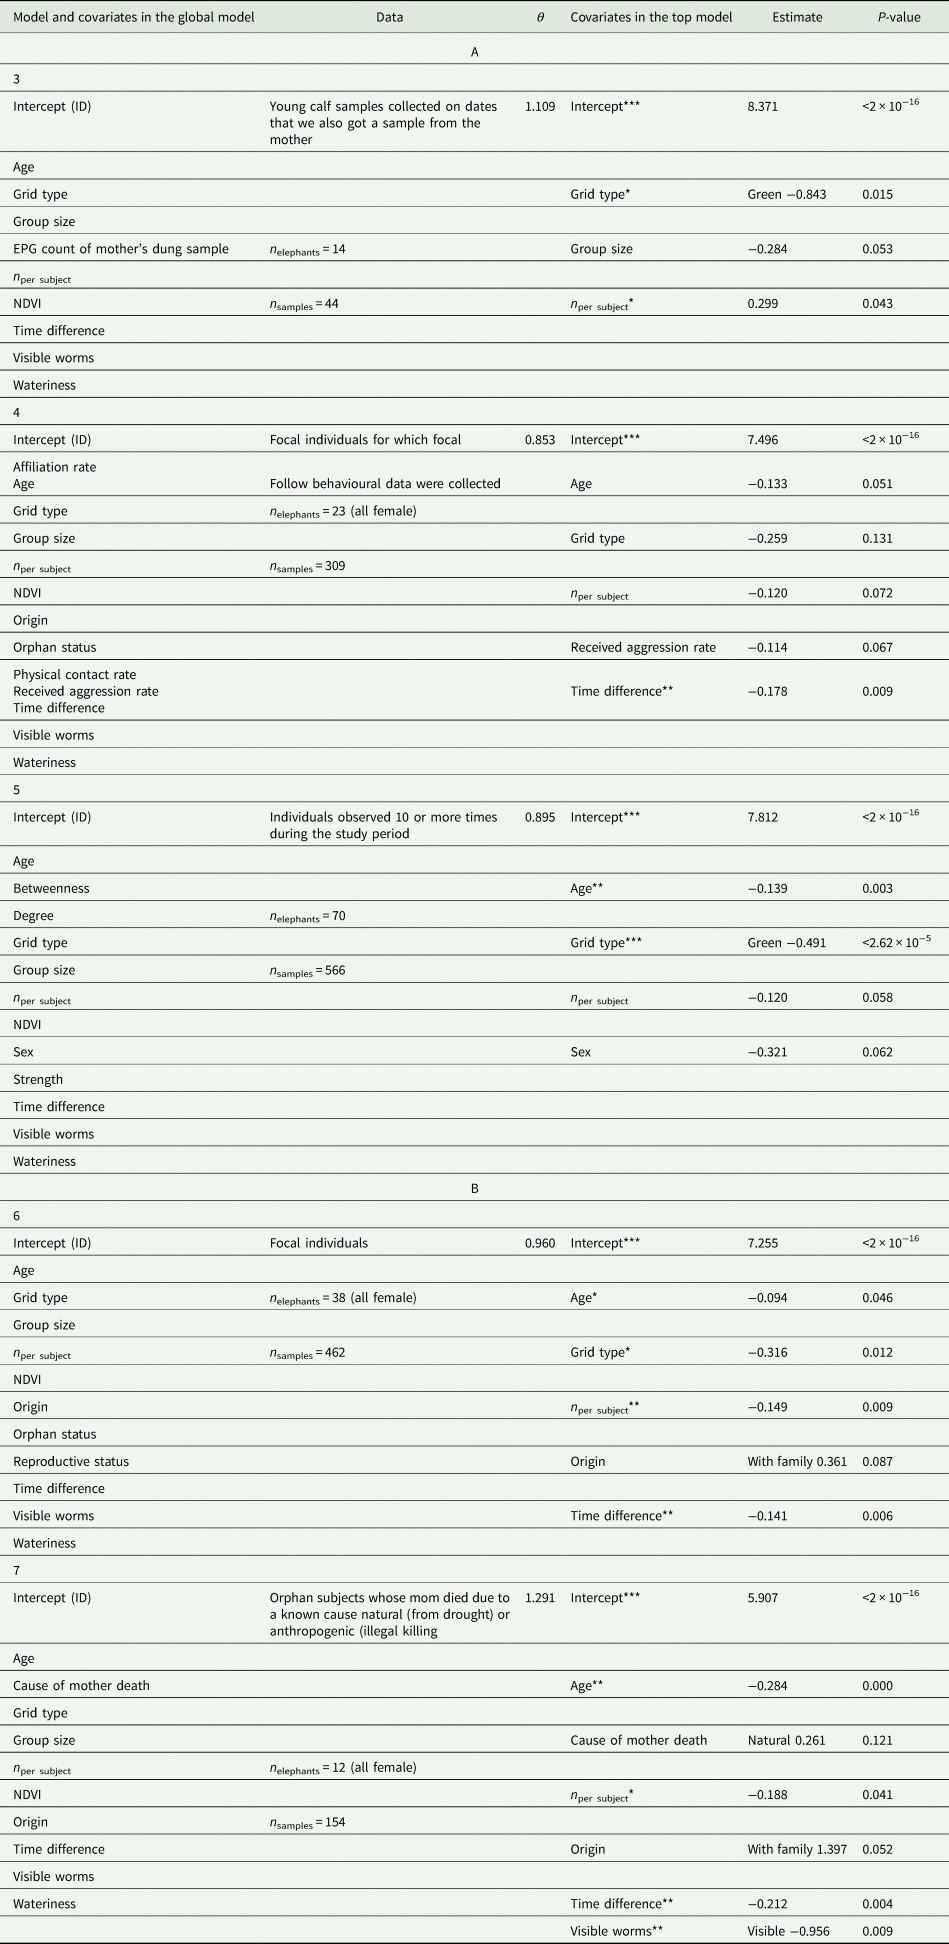
The individual characteristic factors of age and sex, environmental factors of NDVI, and the social factor of group size were included as fixed effects in all models, except for analyses involving only females, for which sex was not included. Since focal follow, social context and spatial data were not available for all sampled individuals, reproductive status was only precisely known for females, and elephants were not always visible enough to record a reliable body condition score, the number of samples available to explore the influence of different factors on EPG varied. Therefore, we implemented seven distinct models to assess the full suite of individual, environmental and social factors we were interested in. The models are detailed in Tables 3–5, which depict the variables included and varying sample sizes for each.
Top model after lowest AICc selection for the model created to test individual characteristics including body condition but not reproductive status, because we did not know the reproductive status of all individuals included in model 1
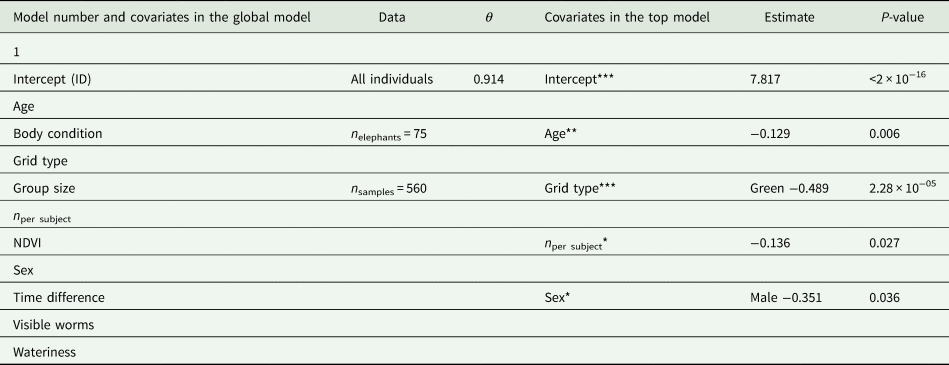
θ is the dispersion parameter. One asterisk signifies a P-value <0.05, two asterisks signify a P-value <0.01, and three asterisks signify a P-value <0.001. Covariates showing a trend with a P-value <0.10 are followed by a period.
Top model after lowest AICc selection for the model created to test environmental factors including movement measures
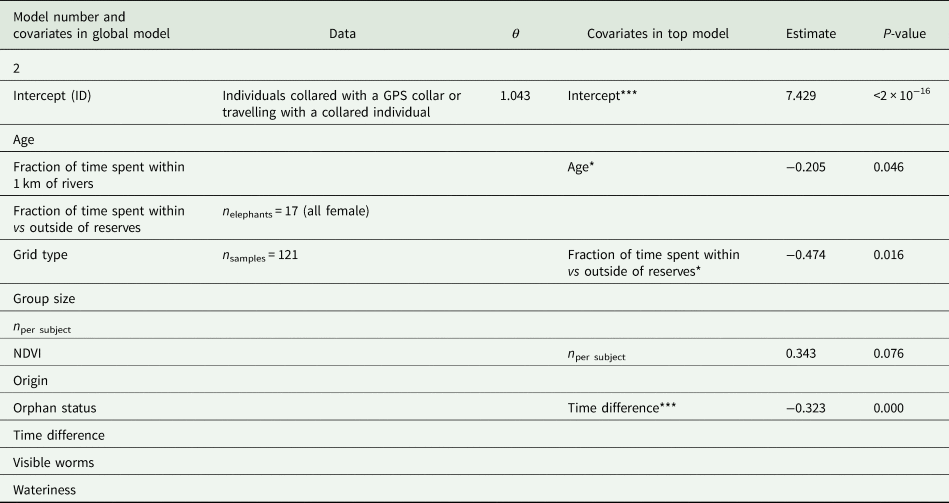
θ is the dispersion parameter. *P < 0.05, **P < 0.01, and ***P < 0.001. Covariates showing a trend with a P-value < 0.10 are followed by a period.
Top models after lowest AICc selection for the models created to test
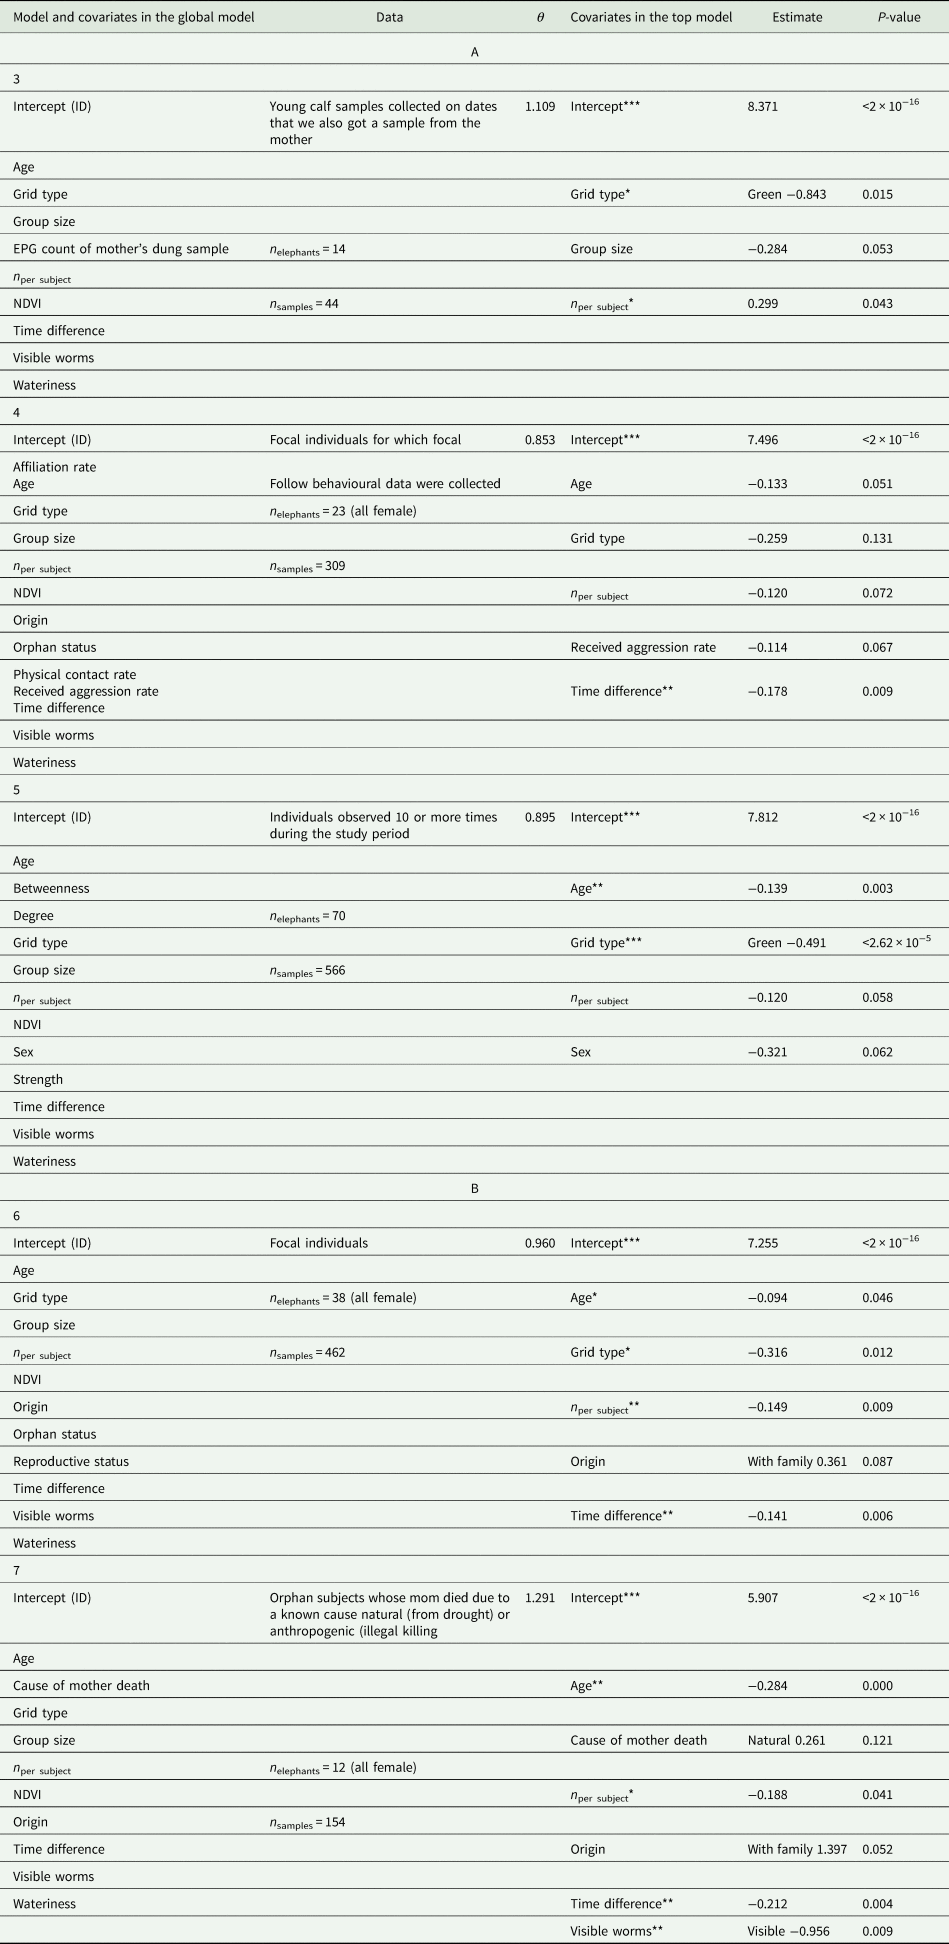
(A) Social factors including the EPG count of a calf's mother's eggs (model 3) physical contact behaviour (model 4) and social network metrics (model 5) and (B) social factors related to disruption including orphan status and origin (model 6) and cause of mother's death for orphans (model 7). Note that the individual characteristic of reproductive status is included in model 6 because we did not know the reproductive status of all individuals included in Model 1 (see Table 3). θ is the dispersion parameter. *P < 0.05, **P < 0.01, ***P < 0.001. Covariates showing a trend with a P-value < 0.10 are followed by a period.
We used the MASS (Venables and Ripley, Reference Venables and Ripley2002) and lme4 (Bates et al., Reference Bates, Mächler, Bolker and Walker2015) packages for all analyses except for the analysis including reproductive condition, which involved a categorical variable with more than two categories; for that, we used the glmmADMB package (Fournier et al., Reference Fournier, Skaug, Ancheta, Ianelli, Magnusson, Maunder, Nielsen and Sibert2012; Skaug et al., Reference Skaug, Fournier, Bolker, Magnusson and Nielsen2016). All numeric variables were scaled prior to analyses with the scale function in base R, which subtracts mean and divides by standard deviation. To select top models, we used stepwise backward selection, sequentially removing the least important variable as determined by the lowest absolute value of β/s.e. and continuing if the lower order model had a lower AICc value (Burnham and Anderson, Reference Burnham and Anderson2004) than the previous model (Pagano and Arnold, Reference Pagano and Arnold2009; Arnold, Reference Arnold2010). We did this until removing a variable increased the AICc value, then kept the previous model with the lower AICc value (Pagano and Arnold, Reference Pagano and Arnold2009; Arnold, Reference Arnold2010).
Results
Strongylid counts were highly variable, even among samples of a single individual, oscillating up and down over time (Supplementary Materials Fig. S1). Across all 578 samples, 557 had positive counts, while 21 had a count of zero that signified fewer than 50 EPG. The positive counts averaged 1694.2 ± 60.5 EPG, with a maximum of 10 550 EPG and a minimum of 50 EPG. None of the elephants consistently had negative EPG counts, meaning that every sampled individual was positively infected with strongylids at least once over the course of the study.
Individual characteristics
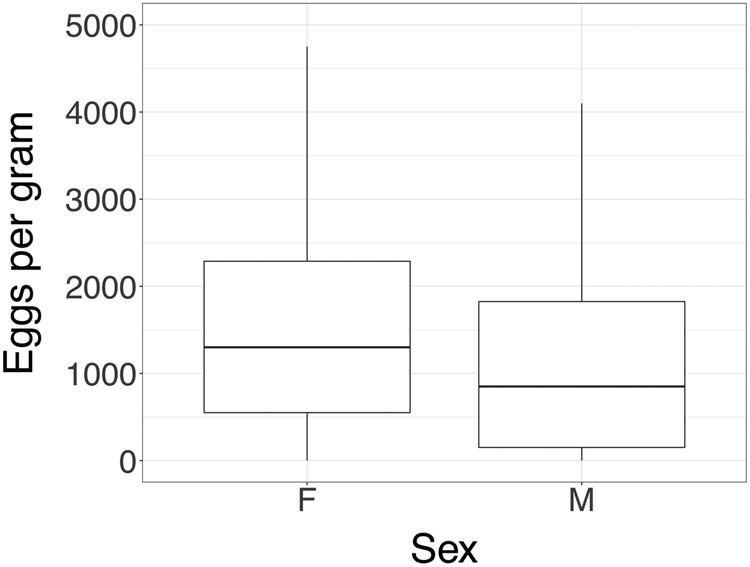
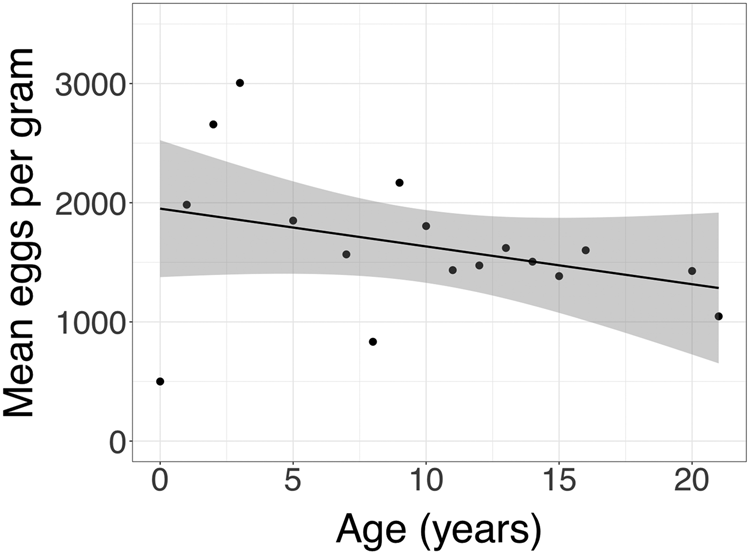
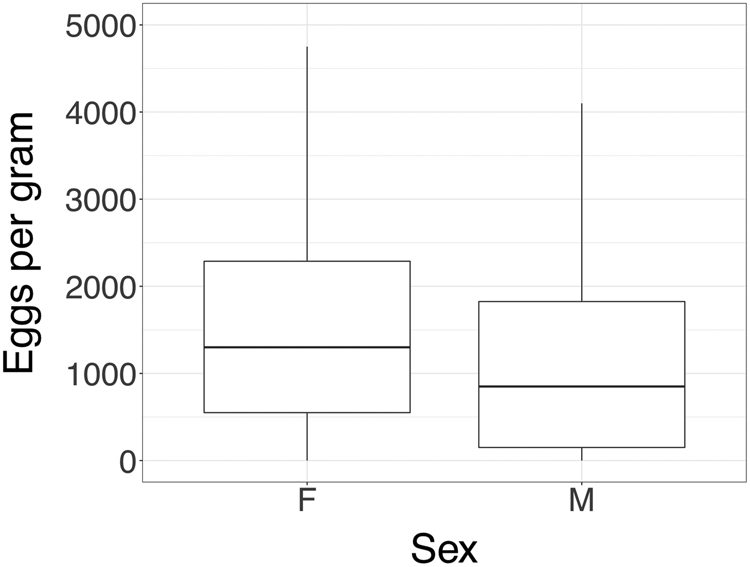
Our top models indicated that age was one of the strongest predictors of strongylid load (Table 3, Fig. 1). Younger individuals had higher loads than adults; model 1 estimated that an increase of one standard deviation in age corresponded to a decrease of 12.1% in EPG counts (P = 0.006; Table 3). Sex also showed a significant effect, with males estimated to have 29.6% fewer EPG than females in model 1 (P = 0.036; Table 3, Fig. 2). Body condition and reproductive status were not included in top models (Tables 3, 5).
Mean strongylid EPG of elephant dung vs elephant age in years.
Boxplot showing EPG of dung vs sex for elephants 8 years and older. Outliers are not pictured for scale.
Environmental factors
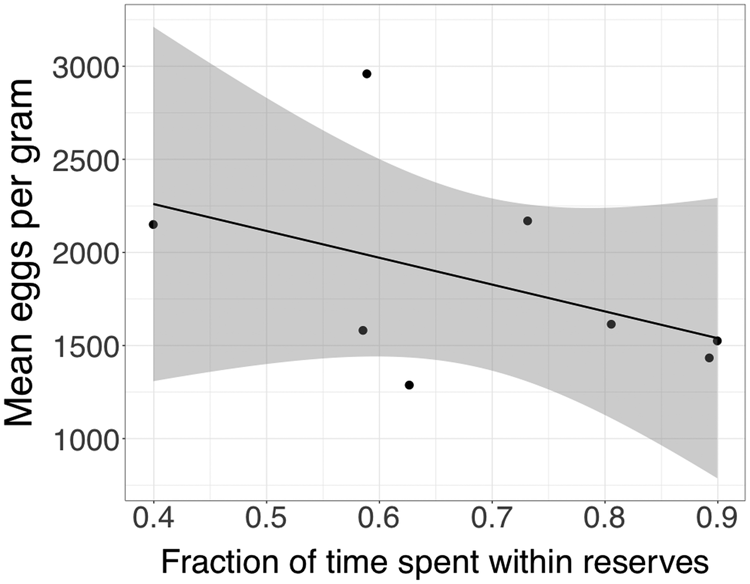
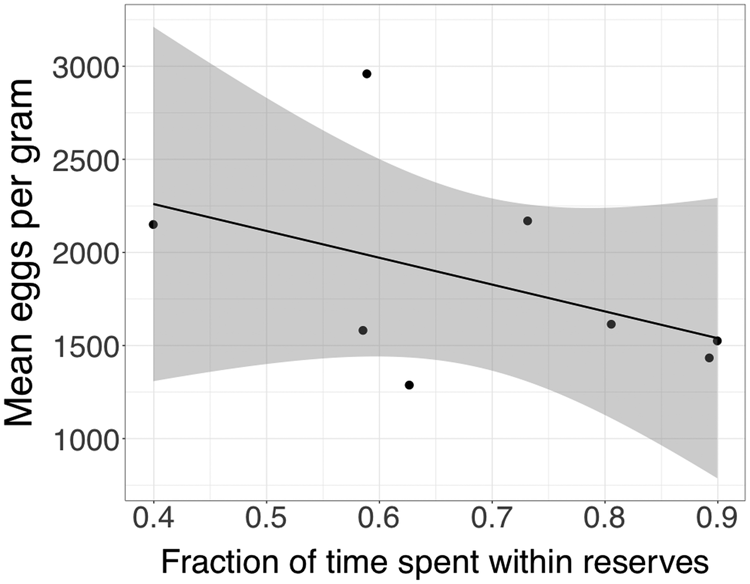
Space use with respect to the fraction of time elephants spent within vs outside of reserves showed a significant effect in model 2, where a one standard deviation increase in the time spent within reserves corresponded to an estimated decrease of 37.7% in EPG (P = 0.016; Table 4, Fig. 3). Space use with respect to the fraction of time spent near rivers and seasonality as measured by NDVI were not included in top models (Tables 3–5).
Mean EPG of dung vs the time collared individuals spent within reserves.
Social factors
Out of the seven top models with different sample sizes, group size appeared only in model 3, the model including only calves (Table 5). Its estimated effect in that model was nearly significant, with one standard deviation increase in group size corresponding to a decrease of 24.7% in EPG (P = 0.054; Table 5). According to the top model, EPG counts of samples collected from mothers were not correlated with counts of samples collected from their calves on the same date (Table 5).
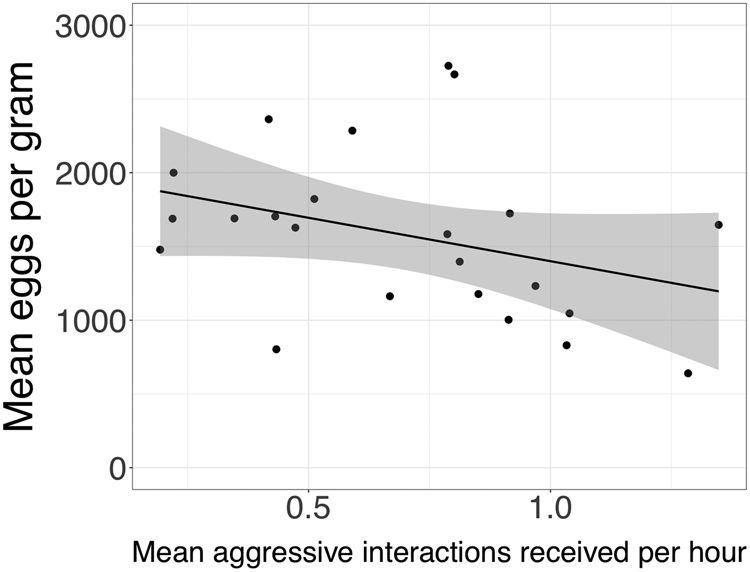
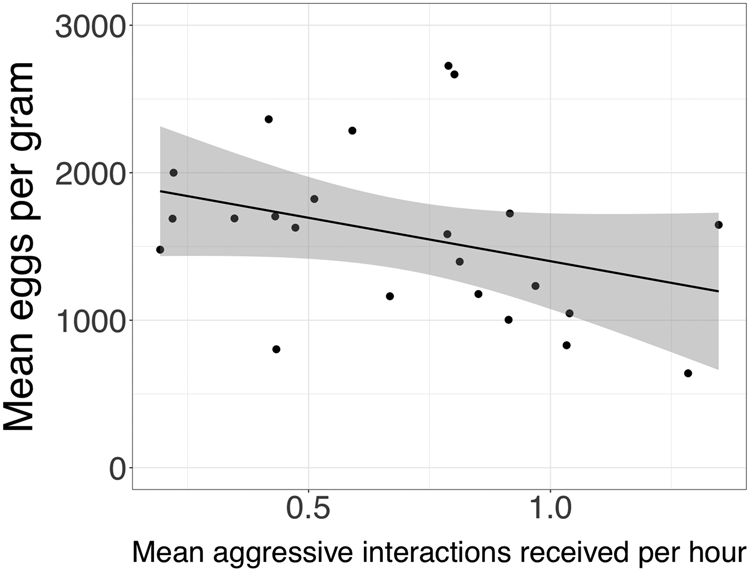
The physical contact rate did not remain in model 4 following model selection (Table 5). With respect to the two proxies for social integration, the affiliation rate did not remain in the top model but the received aggression rate showed a negative trend. Model 4 estimated that one standard deviation increase in the amount of aggression an elephant received per hour correlated with a 10.8% decrease in EPG counts (P = 0.067; Table 5, Fig. 4). None of the social network metrics of betweenness, degree or strength remained in model 5 following model selection (Table 5).
Relationship between mean EPG of dung and the rate of aggressive interactions received per hour while feeding.
Social factors related to disruption
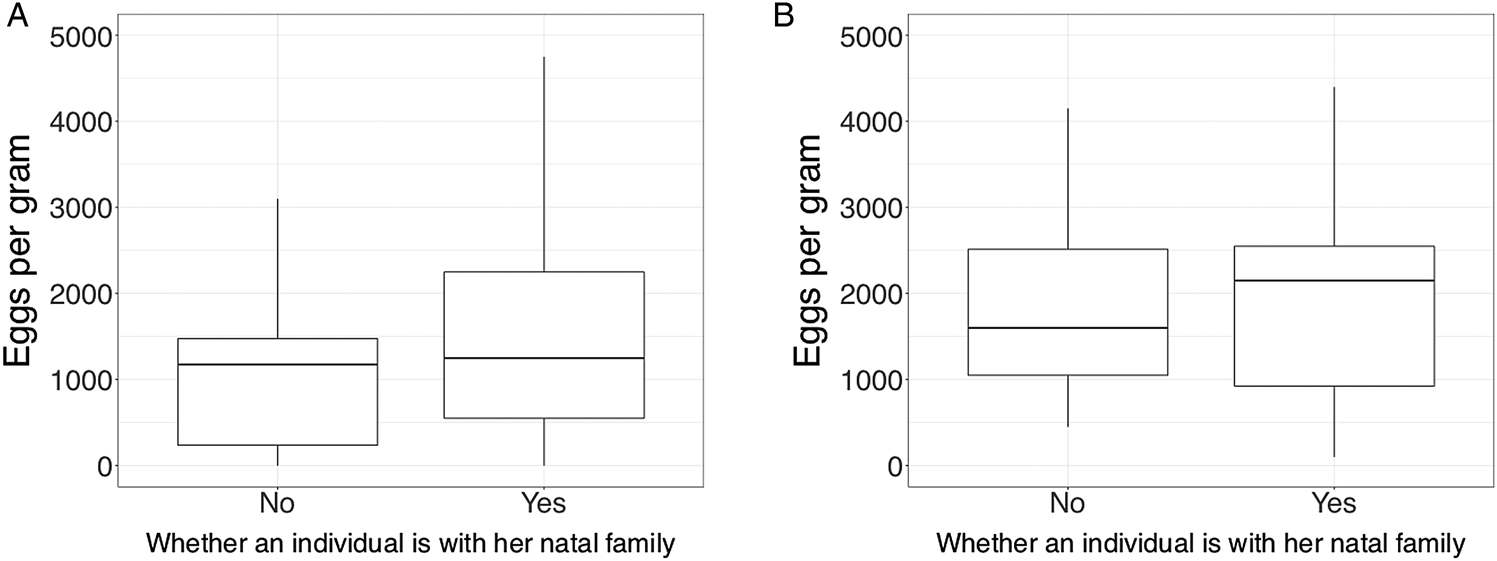
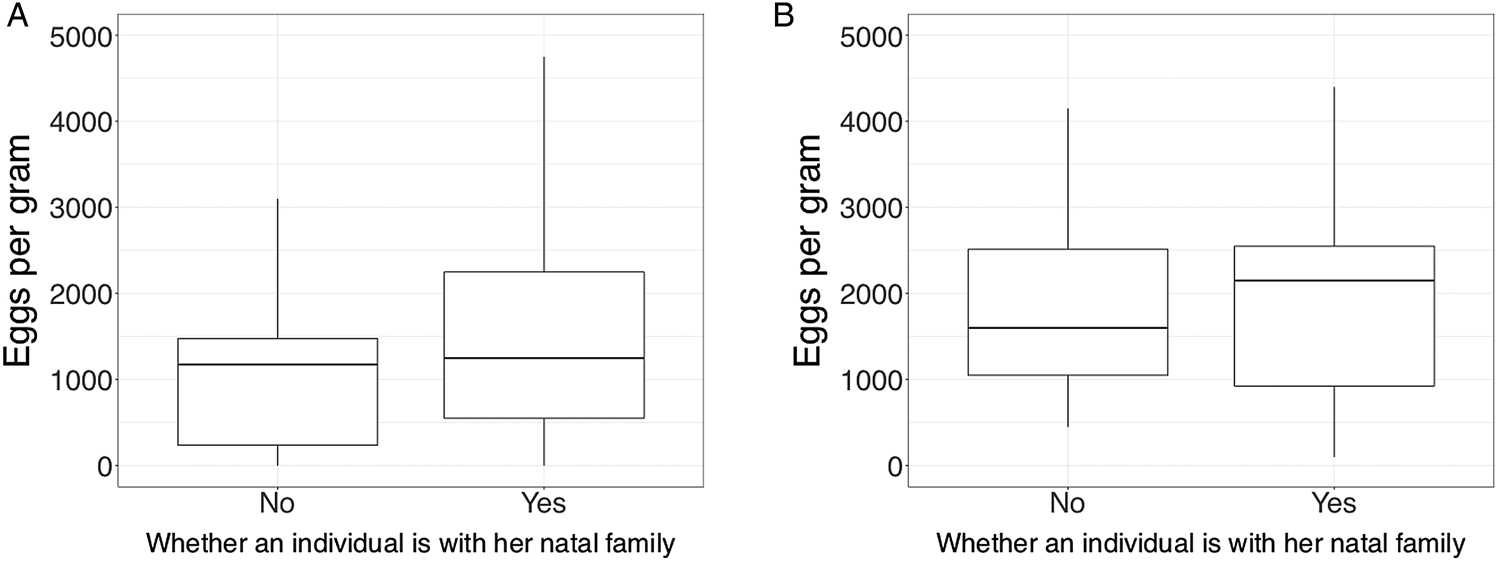
Orphan status did not appear in any of the top models (Tables 4 and 5). Origin showed a trend in models 6 and 7. The estimate of model 6 is likely more reliable since only one individual included in model 7 had left her natal family (Table 5); model 6 estimated that individuals remaining with their natal family had 43.5% higher EPG counts than individuals who had left their natal family (P = 0.087; Table 5, Fig. 5).
Boxplot showing EPG of dung vs the origin for female elephant individuals (A) <10 years of age and (B) >10 years of age. Due to the effect of age on egg counts the trend is difficult to see with all ages combined. Outliers are not pictured for scale.
Cause of mother's death remained in model 7, with orphans of mothers who died due to drought estimated to have 29.8% higher EPG counts than orphans whose mother died due to anthropogenic causes, but the estimated effect was not significant (P = 0.121; Table 5).
Discussion
Studying strongylid infection of individuals in wildlife populations improves our understanding of factors influencing parasitic disease ecology. Our results suggest that multiple factors, representing all three categories of individual characteristics, environmental factors and social factors, play a role in determining the level of strongylid infection in wild African elephants. The individual characteristics of age and sex had robust effects on strongylid loads in this study (Figs 1 and 2), unsurprising given that previous studies have shown these two factors influence parasitism (e.g. Thurber et al., Reference Thurber, O'Connell-Rodwell, Turner, Nambandi, Kinzley, Rodwell, Faulkner, Felt and Bouley2011; Albery et al., Reference Albery, Kenyon, Morris, Morris, Nussey and Pemberton2018). Concerning environmental factors, space use outside of protected areas was positively correlated with strongylid infection. We interpret this result as indicating that human modification of landscapes may alter parasitic infection in wildlife. Other findings concern social factors. We are the first to show that elephants who are frequent recipients of aggressive behaviours have decreased strongylid egg output (Fig. 4). Correspondingly, orphan elephants who travel with unrelated elephants and are often observed on the periphery of the family group (Goldenberg and Wittemyer, Reference Goldenberg and Wittemyer2018) shed fewer strongylid eggs (Fig. 5), suggesting that social disruption caused by humans can alter parasitic infection for individuals of social wildlife species.
Key factors determining strongylid infection
Younger elephants had higher strongylid loads (Fig. 1), a result that is consistent with studies in many species and may be due to the immature immune systems of younger animals (Albery et al., Reference Albery, Kenyon, Morris, Morris, Nussey and Pemberton2018). Our age results are particularly robust given that age was entered into analyses down to the fraction of a year that had passed since an individual's last birthday for each date dung was collected, whereas other studies of parasitism in elephants relied on coarse age class estimates (e.g. Thurber et al., Reference Thurber, O'Connell-Rodwell, Turner, Nambandi, Kinzley, Rodwell, Faulkner, Felt and Bouley2011; Baines et al., Reference Baines, Morgan, Ofthile and Evans2015). Of note, the oldest sampled female elephant in our study was 21 years old, and the oldest sampled male was 18 years old. Consequently, we do not have insight into strongylid loads in older aged African elephants.
Our results on the influence of sex are consistent with those of Thurber et al. (Reference Thurber, O'Connell-Rodwell, Turner, Nambandi, Kinzley, Rodwell, Faulkner, Felt and Bouley2011), who found that bull elephants have lower strongylid EPG counts than females and calves. However, the sex difference they found was more pronounced, potentially because they sampled from older bulls than those included in our sample (Supplementary material Fig. S2). Males go through a gradual dispersal process, beginning anywhere from 5 to 18 years of age (Wittemyer et al., Reference Wittemyer, Daballen and Douglas-Hamilton2013). Over the span of several years, they spend less and less time in the company of family groups (Evans and Harris, Reference Evans and Harris2008), and more time in what have been referred to as ‘bull areas’, or distinct places where bulls feed away from families (Moss, Reference Moss1988). This equates to spending less time in areas that are most heavily contaminated by dung, which is the source of infective larvae (Condy, Reference Condy1974), so a male's chances of contracting strongylids via exposure should decline as his dispersal becomes more complete.
Regarding environmental exposure related to space use, the finding that elephants who spend less time within reserves have higher strongylid loads could be related to the fact that strongylid larvae survive better in certain soils (Condy, Reference Condy1974). Sun et al. (Reference Sun, Wronski, Bariyanga and Apio2018) found that the strongylid infection of cattle (Bos taurus) was correlated with where they grazed. As soil's ability to hold water decreased, vegetation cover decreased and soil compaction increased, cattle were more infected with strongylids (Sun et al., Reference Sun, Wronski, Bariyanga and Apio2018). Community conservancies and other areas surrounding the protected reserves in Samburu are affected by livestock grazing (Ihwagi et al., Reference Ihwagi, Wang, Wittemyer, Skidmore, Toxopeus, Ngene, King, Worden, Omondi and Douglas-Hamilton2015). Resulting differences in vegetation cover and soil properties outside vs within reserves could be facilitating the survival of infective strongylid larvae, which can survive up to 90 days in soil with small particle size (Condy, Reference Condy1974). If this is true, it would suggest that human modification of landscapes has cascading effects that can amplify parasitic diseases in wildlife (Buma, Reference Buma2015). Elephants spending more time outside of reserves may also have lowered immunity against strongylids since their access to the highest quality resources within protected areas is less (Wittemyer et al., Reference Wittemyer, Getz, Vollrath and Douglas-Hamilton2007b), and they are more exposed to the threat of humans, altering their activity patterns (Wittemyer et al., Reference Wittemyer, Keating, Vollrath and Douglas-Hamilton2016) and likely increasing stress.
The role of sociality and social disturbance in determining strongylid infection
Our findings add support for the idea of Rimbach et al. (Reference Rimbach, Link, Bisanzio, Gillespie, Galvis and Di Fiore2015) that proximity-based social networks can be too coarse to show the effect of sociality on GI nematode loads. None of the social network metrics, which were derived from proximity-based associations, showed any effect on strongylid load in our study. However, when using focal follow behavioural data as a measure of social integration, we found support for the idea that social behaviour impacts strongylid infection. Elephants who were more frequently a recipient of aggression had lower strongylid loads (Table 5, Fig. 4), likely due to the fact that they spend more time on the periphery of social groups (Goldenberg and Wittemyer, Reference Goldenberg and Wittemyer2018), and thus would be spending less time in localities heavily contaminated by the dung of other individuals, decreasing their exposure to infective larvae that originate in dung boli (Condy, Reference Condy1974). Strongylid larvae take weeks to develop and become infective (Condy, Reference Condy1974), but family groups frequent ‘favourite’ areas where older elephant dung is concentrated, such as under large trees that provide shade for resting (Goldenberg and Wittemyer, Reference Goldenberg and Wittemyer2017).
The estimated effect of whether an elephant had left her natal family is interesting because when an elephant leaves her natal family, she is the recipient of more aggression (Goldenberg and Wittemyer, Reference Goldenberg and Wittemyer2017, Reference Goldenberg and Wittemyer2018). We suspect this is why models 6 and 7, which do not directly account for behaviour, indicate that elephants remaining with their natal family shed more strongylid eggs (Table 5, Fig. 5), but that effect disappears when the effect of aggression from other elephants is directly accounted for in model 4 (Table 5). Overall, social disruption appears to increase social isolation for surviving orphans who are with unrelated elephants, decreasing their exposure to strongylid infection. We will analyse stress hormones of the same isolated orphans in future work, to discover whether increased aggression from other individuals measurably increases their stress, in which case their susceptibility to parasites should also increase (Sapolsky, Reference Sapolsky2004). If they are more susceptible, socially-mediated exposure may play a greater role in strongylid transmission than susceptibility.
Importantly, physical contact did not correlate with strongylid loads. We were able to parse behaviours according to those involving physical contact (be they affiliative or aggressive), all affiliative behaviours with or without physical contact, and all aggressive behaviours with or without physical contact (Table 2). Accordingly, our results demonstrate that the correlation of strongylid loads with physical contact observed in primate studies (MacIntosh et al., Reference MacIntosh, Jacobs, Garcia, Shimizu, Mouri, Huffman and Hernandez2012; Rimbach et al., Reference Rimbach, Link, Bisanzio, Gillespie, Galvis and Di Fiore2015) may be indicative of nematode loads correlating with social integration rather than actual physical contact. As noted by authors, affiliative physical contact can act as a proxy for social integration (MacIntosh et al., Reference MacIntosh, Jacobs, Garcia, Shimizu, Mouri, Huffman and Hernandez2012).
The weak evidence that orphans from mothers who died of drought have higher strongylid loads than orphans from mothers who were illegally killed (Table 5) may reflect the increase of strongylid parasitism in times of drought (Obanda et al., Reference Obanda, Iwaki, Mutinda and Gakuya2011). Orphans of adult females who died from drought would have exhibited similar feeding, drinking and space use behaviours as the older females in their family groups (Moss, Reference Moss1988) during a time of nutritional stress, and been similarly exposed to parasitism. It is possible they have been unable to fully recover from increased strongylid loads contracted during the drought that killed their mother.
Unexpected results
We were surprised by some results of our study. First, seasonality as measured by NDVI showed no effect, even though other studies investigating strongylid infection have shown seasonal effects (Vidya and Sukumar, Reference Vidya and Sukumar2002; Thurber et al., Reference Thurber, O'Connell-Rodwell, Turner, Nambandi, Kinzley, Rodwell, Faulkner, Felt and Bouley2011; Cizauskas et al., Reference Cizauskas, Turner, Pitts and Getz2015; Albery et al., Reference Albery, Kenyon, Morris, Morris, Nussey and Pemberton2018). Potentially, repeated sampling from the same individuals caused individual variability in strongylid loads to overwhelm the effect of seasonality (Supplementary Materials Fig. S1). Or perhaps exposure and susceptibility opposed one another to mask seasonal effects; although strongylid eggs need adequate moisture to hatch (Khan et al., Reference Khan, Roohi and Rana2015), and thus infective larvae should be more prevalent in wet seasons, hosts are presumably more susceptible during dry seasons due to harsher conditions (Thurber et al., Reference Thurber, O'Connell-Rodwell, Turner, Nambandi, Kinzley, Rodwell, Faulkner, Felt and Bouley2011). It is also possible that human-modified landscapes in the study area increased larval survival further into the dry season than is normal in unaltered landscapes (Sun et al., Reference Sun, Wronski, Bariyanga and Apio2018).
We were again surprised by the estimated negative correlation of group size with strongylid loads in model 3 (Table 5), the model which included only calf samples. When it shows an effect, group size generally correlates positively with parasitic infection (Rifkin et al., Reference Rifkin, Nunn and Garamszegi2012), especially with contagious or faecal–oral transmitted parasites such as strongylids (Côte and Poulin, Reference Côte and Poulin1995). However, Akinyi et al. (Reference Akinyi, Jansen, Habig, Gesquiere, Susan, Archie, Alberts and Archie2019) also found a negative correlation between group size in wild baboons (Papio cynocephalus) and strongylid infection. They suggested it was due to interactions between nematodes and whipworms (Akinyi et al., Reference Akinyi, Jansen, Habig, Gesquiere, Susan, Archie, Alberts and Archie2019). Due to time constraints, we lacked information on other endoparasites and intestinal organisms of elephants that may affect strongylids, such as several members of the protozoan class Ciliata (ciliates) (Eloff and van Hoven, Reference Eloff and van Hoven1980). Some intestinal ciliates are known to aid in fibre digestion (Profousová et al., Reference Profousová, Mihaliková, Laho, Váradyová, Petrželková, Modrý and Kišidayová2011), which enhances immune function (Schley and Field, Reference Schley and Field2002). Juvenile elephants directly ingest ciliates when they eat freshly-dropped dung of adults in their family group (Eloff and van Hoven, Reference Eloff and van Hoven1980), but this coprophagic behaviour is not observed in older elephants. Fresh dung is more available as group size increases, so increased ciliate loads in calves of large groups could have resulted in the observed negative correlation between strongylid infection and group size.
Future directions
Our study did not control for differences in diet. Varying diet was found to have a large effect on parasitic worm infections in many species of lizards (Leung and Koprivnikar, Reference Leung and Koprivnikar2019). Although we did not explicitly quantify diet, previous work has shown that the ratio of grass to browse elephants eat changes predictably with NDVI (Cerling et al., Reference Cerling, Wittemyer, Rasmussen, Vollrath, Cerling, Robinson and Douglas-Hamilton2006; Wittemyer et al., Reference Wittemyer, Cerling and Douglas-Hamilton2009). The lack of correlation between EPG counts and NDVI suggests that dietary shifts between grass and browse do not influence strongylid loads. However, future studies should investigate whether strongylid infection varies with finer scale differences in diet. Future studies might also investigate whether social rank affects strongylid loads in African elephants because studies have found that dominant individuals are more infected with strongylids in species such as meerkats (Suricatta suricatta) (Smyth and Drea, Reference Smyth and Drea2015). In addition, nematode parasites tend to aggregate within human populations such that 80% of them are found within 20% of individuals (Wilson et al., Reference Wilson, Bjørnstad, Dobson, Merler, Poglayen, Randolf, Read and Skorping2002). A follow-up study could be designed to answer the question of whether this pattern exists with strongylids in elephant families.
Two follow-up studies would be especially valuable. First would be a study that tests whether soil outside of reserves is actually more contaminated with strongylid larvae than that within reserves. Soil samples from different areas could be measured for infective larvae to create a map of geographic risk, and then be combined with GPS collar data to discover if EPG counts vary according to how often an elephant is found in heavily infected areas. Secondly, a future study might investigate the possible existence of a stable limit cycle in strongylid infection patterns. Lafferty and Holt (Reference Lafferty and Holt2003) suggest that such cycles may exist for parasites that are generally well-tolerated. We observed oscillations between subsequent samples of those individuals we regularly sampled (Supplementary Materials Fig. S1), and suspect such oscillation may have something to do with pulses in the egg laying of adult strongylids (Khan et al., Reference Khan, Roohi and Rana2015). Yet because we did not sample at regular intervals, we were unable to implement time series analyses.
Conclusions
As previous studies of strongylid infection in elephants have not included individual-based social factors (Vidya and Sukumar, Reference Vidya and Sukumar2002; Thurber et al., Reference Thurber, O'Connell-Rodwell, Turner, Nambandi, Kinzley, Rodwell, Faulkner, Felt and Bouley2011; Baines et al., Reference Baines, Morgan, Ofthile and Evans2015), our study makes a significant contribution to the understanding of how social factors influence strongylid infection in these animals. Overall, elephants that spent less time in locations frequented by family groups, be they males or socially isolated orphans, had lower strongylid loads. We further emphasize that movement outside of protected areas seems to increase strongylid infection in elephants. This study suggests that the human impacts of social disruption and habitat modification may have indirect effects (Buma, Reference Buma2015) on parasitism in African elephants, a vulnerable species of conservation concern (IUCN, 2019).
Supplementary material
The supplementary material for this article can be found at https://doi.org/10.1017/S0031182019001653.
Acknowledgments
We thank the Kenyan Office of the President, the Kenya Wildlife Service and the county governments in Samburu and Isiolo for permission to conduct research in the national reserves. Special thanks to D. Daballen, W. Kimani, F. Pope, T. Obari, F. Omengo, M. Mosse, L.W. Muita and G.S. Sabinga for logistical support. W. Turner advised on faecal egg count methodology. N.M. Gathuku assisted with tracking data. The comments of three anonymous reviewers improved the manuscript.
Financial support
Funding for this work was provided by the National Science Foundation Graduate Research Fellowship Program (JMP: 006784, SZG: 1321845), Save the Elephants, and S. Rankin of WorldWomenWork.
Conflict of interest
None.
Ethical standards
Not applicable.