

Introduction
At nearly 170 million inhabitants, Nigeria is the most populous country in Africa by twofold and is on course to become one of the largest countries in the world. It is also one of the most diverse, with a large number of groups from different linguistic and ethnic backgrounds (Katzner Reference Katzner2002; Lieberman and McClendon Reference Lieberman and McClendon2013). Nigeria is also the only state in the world with equal proportions of Christians (49·3% in 2010), located mainly in the South, and Muslims (48·8%) (PEW 2012) who are living mainly in the Northern regions of the country (Figure 1). The population balance between the two majority religions, however, is likely to shift in the future as a result of distinctly different trajectories of demographic change. While the Muslim North is currently in an early phase of demographic transition with very high fertility rates, fertility rates of Christians and Muslims in the South are declining as the demographic transition is further underway. These diverging trajectories in demographic behaviour may lead to the end of the current equilibrium between the two religions with significant implications for the future of the country. Within this study we examine possible explanations for divergent population trajectories along religious lines as well as the path that these trajectories may potentially take into the future.
Religious composition by state in Nigeria in 2013. Shading on the map indicates presence of Sharia law in states; pie charts represent religious composition.Footnote 1

As with several other Western African countries, ethno-regional and religious divides largely overlap in Nigeria and are manifested in a pronounced north-south gap (Mancini Reference Mancini2009). Here, inequalities have emerged along geographic and ethnic divisions as well as along socioeconomic lines between nomadic herdsmen and farmers, exacerbated by climate change (e.g. Fasona & Omojola Reference Fasona and Omojola2005; Sayne Reference Sayne2011). While ethnic divides were of great importance in the past, a religious divide now appears to be becoming more pronounced as religious tensions compound traditional ethnic and geopolitical rivalries, magnifying underlying insecurities and grievances.
The past decade has seen increasing reports of sectarian violence in Nigeria's Middle Belt where ethnic and religious communities meet. And in an ominous sign of things to come, these attacks are increasingly framed in terms of religious and cultural conflict. In 1999–2000 Sharia laws were introduced in 12 statesFootnote 2 in northern Nigeria (Figure 1) leading to religious unrest and an escalation of hostilities that resulted in thousands of deaths in Kaduna state alone (Barker & Ricardo Reference Barker and Ricardo2005: 33; Ostien & Dekker Reference Ostien, Dekker and Otto2010). This drastic shift is reflected in the Pew Research Center's Social Hostilities Index which documented a surge from 4·4 to 8·5 on a 10-point scale between 2007 and 2012 – one of the highest scores in the world. As part of efforts to establish an Islamic caliphate, attacks on Christians and moderate Muslims by the militant group Boko Haram, which translates literally to ‘Western Education is Forbidden’, may be orchestrated with the goal of stoking religious tensions between the predominately Christian Igbo in the South and Hausa-Fulani Muslims in the North, with the Yoruba in the West representing a mix of Christianity and Islam.
Within the context of an ethnically and religiously diverse country such as Nigeria, a newfound emphasis on religious identity coupled with religion-specific fertility differentials could carry significant political and economic implications. Indeed, Mazrui (Reference Mazrui, Finkle and McIntosh1994) finds that religious divisions in sub-Saharan Africa are most likely to lead to conflict when they reinforce underlying ethnic differences, precisely the situation we now observe in Nigeria. It is particularly important to note that the emergence of militant Islamic sects and possible spread of Sharia law to additional states is potentially a response to the growing north-south gap and perceived political dominance of the South (Isa Reference Isa, Okumu and Ikelegbe2010). Indeed, while its implementation has ignited hostilities particularly in the border states making up the Middle Belt, Sharia law was being applied to Muslims in most Northern states long before its formal institutionalization (Ostien & Dekker Reference Ostien, Dekker and Otto2010).
In our paper, first, we discuss factors contributing to the widening gap in the fertility differential between Muslims and Christians. Besides the factors such as contraceptive use and demand for family planning and differences in marital behaviour that fall within the proximate determinants framework (Bongaarts Reference Bongaarts1978), which is a framework highly relevant for the understanding of fertility change in the sub-Saharan African context, we discuss differences in educational improvements among women and changing fertility ideals. We show that religion per se is not the main driver of stalling fertility among Muslims in Sharia states as there is significant heterogeneity in the reproductive behaviour of Muslims in Nigeria. We argue that fertility stalls and high population growth are specific to Muslims in Sharia states. Therefore, it is not useful to speak of Nigerian Muslims as a homogeneous group.
The second part of the paper demonstrates the consequences of the increased fertility gap on the religious landscape of Nigeria. While the relative similarity in size between Muslims and Christians populations emerged only during the past 40 years, Muslims have never been a clear majority in a united Nigeria (Mi Reference Mi1987).Footnote 3 This situation may soon change as we identify an ongoing demographic bifurcation that could significantly alter the religious composition of Africa's most populous nation with substantial implications for future population outcomes.
THE INCREASING GAP IN RELIGION-SPECIFIC FERTILITY IN NIGERIA
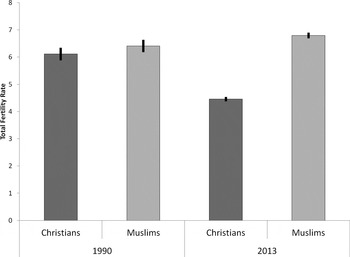
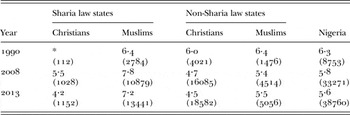
Using Demographic Health Survey (DHS) surveys,Footnote 4 in this study we identify religion-based fertility differentials and project potential demographic futures based on a number of scenarios. We find that the total fertility rate (TFR) of Christians decreased significantly from 6·1 [CI: 5·9–6·3] to 4·5 children [4·4–4·5] per woman between 1990 and 2013 while the TFR of Muslims increased from 6·4 [6·2–6·6] to 6·8 children [6·7–6·9] (Figure 2).Footnote 5 However, fertility is not rising among all Nigerian Muslims. Taking a closer look we find that fertility has increased from 6·4 to 7·2 children per woman between 1990 and 2013 among Muslims residing in currently Sharia law states (Table I). However, among those residing elsewhere fertility declined from 6·4 to 5·5 children per woman. Although this is one child more than the average for a Christian woman, we show that fertility change unfolds in a similar way among Christians and Muslims from non-Sharia states.Footnote 6
Total Fertility Rate among Christians and Muslims in Nigeria in 1990 and 2013. Thick black lines indicate 95% confidence intervals.Footnote 7

Total fertility rates by religion by states in Nigeria in 1990, 2008 and 2013.Footnote 9

* Because of the small number of observations it was not possible to calculate TFR for Christians in Sharia states in 1990.
Interestingly enough, the timing of the divergence in fertility trends coincides with the formal introduction of Sharia law over the course of several years following the 1999 return to civilian rule and subsequent reinstatement of constitutional law (Kendhammer Reference Kendhammer2013; for an overview see Oba Reference Oba2002; Ostien and Dekker Reference Ostien, Dekker and Otto2010). This leads to questions regarding how Sharia law or culture specific to those regions where Sharia law has been institutionalized fosters high fertility. As discussed in the next section, we hypothesize that the adoption of Sharia and societal norms related to its practice sustains high fertility culture and contributes to increasing fertility differentials. The widening gap in fertility by religion can thus be understood as a result of persistent high fertility and pronatalist culture among Muslims in Sharia law states contrasted with a progressing fertility transition among Christians and moderate Muslims residing in the Southern states.Footnote 8
ISLAM, SHARIA AND FAMILY BEHAVIOUR
The institutionalization of Sharia law in 12 northern states beginning in 1999 and consequent subjugation of the English legal system represented a return to Islamic primacy which has not been observed since the pre-colonial period (Ostien & Dekker Reference Ostien, Dekker and Otto2010). However, the spread of Sharia law and extended jurisdiction to cover criminal as well as civil matters was the culmination of gradual and some would argue inevitable decline of the system of common law that was imposed on Nigeria during colonialism (Oba Reference Oba2002). Indeed, Sharia law was already being carried out among Nigerian Muslims in the realm of civil/personal law prior to official institutionalization (Nmehielle Reference Nmehielle2004). The full implementation of Sharia law can thus be viewed as symptomatic of pre-existing societal preferences as well as emblematic of a nascent movement away from Western conceptions of law, education and the secular state.
While the institutionalization of Sharia law in the northern states occurred relatively recently, Islam has long been an integral aspect of the religious and political landscape of northern Nigeria, culminating in the Sokoto Caliphate of the early 19th century and near total replacement of customary law with Islamic law (Ostien & Dekker Reference Ostien, Dekker and Otto2010). During this period southern Nigeria was awarded as a protectorate to the British, resulting in the introduction of English law in the South while a system of indirect rule (through local proxies) led to a two-tier legal system in the North which included native/customary law (with elements of Islamic law) and English law. In contrast with the North, Sharia law never supplanted customary personal law in the southern states of Nigeria and southern Muslims have traditionally adhered to tribal customs in most legal matters (Ostien & Dekker Reference Ostien, Dekker and Otto2010). Thus, although customary law in southern Muslim communities often reflects the influence of Islamic law, the norms and procedures regulating marital law have remained uncodified and thus largely contingent on local customs. In the North, however, the legal ease and societal norms associated with marriage and divorce have been identified as key contributors to high fertility by motivating women within polygynous marriages to maximize their number of children in order to prevent divorce and ensure their share of inheritance (Izugbara & Ezeh Reference Izugbara and Ezeh2010).
Although the Quran does not prohibit birth control in marriage and it is permitted for a wide range of justifiable reasons (Omran Reference Omran2012), opposition to modern contraception and family planning programmes emerged in some contexts where these are seen as an import from the West and a deviation from ‘the right path’ (Roudi-Fahimi Reference Roudi-Fahimi2004). For these reasons it is not uncommon that family planning programmes would be politicized in Muslim societies. In this context, strict adherence to Sharia law could imply a lack of sexual health education and/or suspicion toward modern forms of contraception, as well as the relatively low educational levels among young girls. Mazrui (Reference Mazrui, Finkle and McIntosh1994) outlines several ways in which Islamic fundamentalism can affect fertility such as distrust of the West, association of contraception with prostitution, Quran-based fatalistic attitudes regarding procreation, attitudes toward polygyny and large families, subversion of traditional birth spacing, and encouragement of a large age gap between husbands and wives. Within this analysis we will focus primarily on the interplay of Sharia, education, and family planning and its implications for differential Christian-Muslim fertility levels.
Sharia law and the implicit societal norms associated with its practice can influence fertility levels through a number of indirect and direct causal avenues including lowered age of marriage as well as outright prohibitions on formal education.Footnote 10 While there is variation among different schools of thought, puberty marks the age of marriage for young girls under classical Sharia (Rehman Reference Rehman2007). In addition to the increased prevalence of pregnancy and implications for educational attendance, child brides are frequently forbidden from attending school or lack the time to continue their education (Warner Reference Warner2004). A low marriage age thus results in higher fertility by increasing the probability of pregnancy while impeding access to education that could result in lower fertility preferences (Westoff et al. Reference Westoff, Pullum, Adamchak, Hill, Stupp, Bertrand and Brown1992). Disparate age differences are also conducive to patriarchy, resulting in increased male control over contraceptive practices and reproductive behaviour which evidence suggests leads to higher realised fertility (Ezeh et al. Reference Ezeh, Isiugo-Abanihe, Tolnay, Woodcock, Stenner, Ingham and Reichert1993; Isiugo-Abanihe Reference Isiugo-Abanihe1994; Bankole & Singh Reference Bankole and Singh1998).
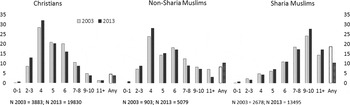
Societal norms, patriarchy, and a resistance towards Western influence – which are sustained by Sharia law – seem to play a role in high fertility culture among Muslims in northern Nigeria. High fertility of Muslims in the Sharia states is coupled with persistently high fertility ideals (Figure 3). In 2013 only about 5% of Muslim women in Sharia states were in favour of relatively smaller families (with two to four children) while large family ideals remain the norm with 62% of women considering at least seven children ideal, and an additional 10% stated that they would accept any number of children God grants them. Fertility ideals did not change much among the Muslim women in Sharia states between 2003 and 2013.Footnote 11 Although more women now give a numeric response to the question, a fairly stable share of those who wish to have many children (more than 10 or ‘any number’) suggests that unlimited fertility and large family ideas are well embedded in the states that adopted Sharia law.
Ideal number of children by religion and residence (%) among women aged 15–49, in 2003 and 2013.Footnote 12

In contrast, fertility ideals have shifted towards smaller families among Christians and to a lesser extent also among Muslims in non-Sharia states. Muslim women residing in non-Sharia states not only have a lower TFR than those residing in Sharia states, but also differ in their perception of the ideal number of children, with more citing four children as ideal and fewer preferring large families with at least seven children. The ideal family size distribution and trend towards preferences for smaller families among Muslim women residing in non-Sharia states mimics the pattern of Christian women, although their overall fertility ideals are slightly higher than those of Christian women. The apparent difference between fertility ideals of Muslim women in Sharia and non-Sharia states calls for more thorough investigation of situation factors of fertility and deeper understanding of the role of religious leaders and locally embedded cultural practices that give rise to these diverging preferences.
The high fertility gap between Muslims and Christians can also be linked to differences in mean age at marriage and in the practice of polygyny. Our findings confirm that mean age at first marriage remains very low, at about 15 years for Muslim women in the Sharia states across all waves of DHS (1990–2013). Muslim women residing in non-Sharia states marry at about 18–19 years, while the mean age at first marriage has increased from 18 to 20 years of age among Nigeria's Christians during 1990–2013. We also see a decline in polygyny among Christians and Muslim women in non-Sharia states (down from 46% to 19% among 15–34 year olds during 1990–2013) while the decline in polygynous marriages has halted in the Sharia states according to the 2003 and 2013 DHS. Here the share of women aged 15–34 who are in polygynous union settled at 40%. Polygyny is conducive to higher fertility within the Nigerian context where co-wives are compelled to have as many children as possible in order to economically constrain the husband's ability to take a new wife and ensure their portion of the husband's inheritance (Izugbara & Ezeh Reference Izugbara and Ezeh2010).
One of the underlying mechanisms behind the changes in reproductive and marital behaviour is education. As we show in the next section, education levels among Christian women significantly increased, while education levels among Muslim women in the Sharia states remain low. Rising education levels, higher contraceptive use and lower desired fertility may have contributed to declining fertility in the largely Christian South. Concurrently and potentially in response to this development, anti-Western attitudes and growing fundamentalism in the largely Muslim North may have resulted in low education levels, early marriage age and retention of pronatalist beliefs.
EDUCATION
Educational attainment is conventionally cited in explanations of fertility differences. Numerous studies cite increasing female educational attainment as one of the key factors of fertility decline. Can improvements in educational levels explain variation in fertility levels and the opening gap between Muslims and Christians in Nigeria? As illustrated in Figure 2, we observe a widening gap in TFR by religion and also diverging trends over time, with Christian fertility declining and Muslim fertility rising. If trends in education were to explain the fertility gap between Muslims and Christians, we should observe (a) higher educational levels of Christians compared with Muslims, and (b) educational improvement among Christians as opposed to stalling education or even worsening educational characteristics of Muslim women.
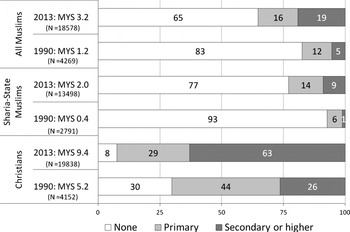
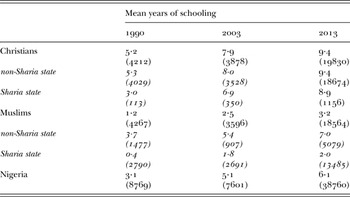
Nigeria has witnessed educational expansion since the 1970s when primary schooling was made mandatory. Greater enrolment at primary levels translated into increased completion of secondary and higher educationFootnote 13 but this seems to be limited to the majority Christian and better developed South. As expected, we find huge differences in educational attainment between Muslim and Christian women in reproductive age (Figure 4). In 2013 a mere 8% of Christian women aged 15–49 had no formal education and a majority attained at least lower secondary education (63%). In contrast, two-thirds of Muslim women had no formal schooling in 2008 and 2013, a modest improvement compared with 83% with no formal education in 1990. Furthermore, the gap in completed mean years of schooling (MYS) between Christian and Muslim women increased from 4·0 to 6·2 years from 1990 to 2013 despite significant gains by non-Sharia state Muslims (Table II). Consistent with the hypothesis of a negative impact of Sharia culture on female educational improvement, the data show that this growing rift is driven entirely by stalled educational gains among Sharia state Muslims, 77% of which lack any formal education.
Educational characteristics of women aged 15–49 by religion in 1990 and 2013.Footnote 14

Mean years of schooling of women 15–49 by religion and region in 1990, 2003 and 2013.Footnote 15

The gap in educational attainment is partly sustained by the persistent perception of Western education as being anti-Islamic (Csapo Reference Csapo1981). Lincove (Reference Lincove2009) finds a significant effect of religion on school attendance and Kazeem et al. (Reference Kazeem, Jensen and Stokes2010) show that children from Christian households are five times more likely to attend school compared with those from Muslim households. In particular, female education remains at very low levels. Studies also suggest that many Muslim parents prefer their daughters to attend traditional Islamic schools, because it guarantees preserving religious values and traditional female roles (Ogunjuyigbe & Fadeyi Reference Ogunjuyigbe and Fadeyi2002). Indeed, Adiri et al. (Reference Adiri, Ibrahim, Ajayi, Sulayman, Yafeh and Ejembi2010) find that a Quranic education is more common than other types of school among Muslim women (49·5%).
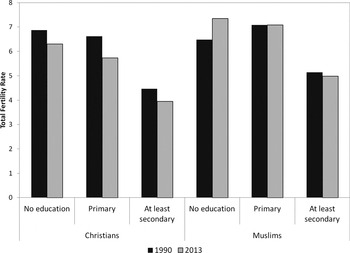
The expected inverse relationship between education and fertility (Bongaarts Reference Bongaarts2003; Skirbekk Reference Skirbekk2008) holds and we find that that fertility is lower among the better educated in both religions (Figure 5). Among Christians, those with primary or less education had at least six children in 2013, while those with at least secondary only have four children. Between 1990 and 2013, fertility fell by roughly half a child for all educational groups among Christians. Overall, fertility levels were more than one child higher among Muslims compared with Christians within all educational groups. The educational gradient in fertility corresponds to the positive effect of in particular secondary and higher education on the use of modern contraceptives (Ejelmi et al. Reference Ejelmi, Dahiru and Aliyu2015).
Total fertility rate by education among Christians and Muslims in Nigeria in 1990 and 2013.Footnote 16

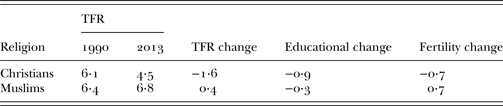
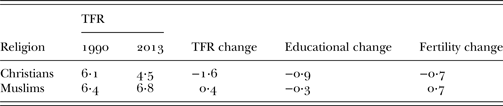
However, TFR rose substantially among Muslims in the period 1990–2013. We find the most pronounced increase among those with no education, a smaller increase for those with at least some primary education, and stalled fertility among women with at least completed lower secondary education. This has taken place in spite of modest improvement in the educational attainment of Muslim women (Figure 4). As can be seen from Table III, the structural effect of increased education depressed the fertility of Muslims by −0·3 children per woman. However, fertility increased by 0·7 children per woman once education is controlled for, using a two-component decomposition of fertility change among Christians and Muslims (see Appendix A1; Retherford & Thapa Reference Retherford and Thapa2004). Decreasing age at entering first marriage can lead to a rise in fertility, however, as we showed earlier the mean age at first marriage stays low at about 15 years but did not decline either. Therefore, other factors, such as possible changes in contraceptive use and possibly the institutionalization of Sharia law, stand behind the increased Muslim fertility in Nigeria.
Decomposition of TFR change into educational change and fertility change.Footnote 17
CONTRACEPTION
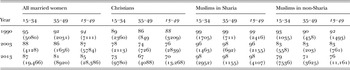
Most extant studies find that contraceptive use is more common among Christian women than Muslim women in Nigeria (Adebowale et al. Reference Adebowale, Fagbamigbe and Bamgboye2011). Our analysis reveals that among currently married or co-habiting Christian and Muslim women in Nigeria, there is an increase in contraceptive practice (either using modern or traditional methods) in non-Sharia states. Despite this modest increase, only around 15% of women of reproductive age use modern contraception (see Table IV) and contraceptive use in Nigeria is low even by regional standards (Bongaarts & Casterline Reference Bongaarts and Casterline2013). The shares of women using contraception are higher among women aged 35–49 compared with younger women.
Percentage of sexually active married or cohabiting women using no contraceptive method, by religion and age.Footnote 18

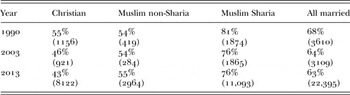
Differences in contraceptive use are significant also between religious groups. Among Christians, the proportion of currently married women not using any method to prevent pregnancy has declined from 88% to 70% between 1990 and 2013. The fraction of non-users has also declined among Muslims in non-Sharia states from 92% to 76%. In contrast, contraceptive use among Muslim women in states where Sharia law has been introduced has remained negligible and a vast majority of married women do not use any method of birth control. The proportion of non-users slightly declined towards 2003 among the younger women aged 15–34 years; however, this trend reversed between 2003–2013, shortly after Sharia law was introduced. Ejelmi et al. (Reference Ejelmi, Dahiru and Aliyu2015) find that religion remains an important predictor of modern contraceptive use in north-eastern and north-western Nigeria even after controlling for number of individual and community level factors.
Further examination of the DHS surveys reveals that women in Sharia states perceive unmet need for family planning. The proportion of non-users who intend to use or are unsure about using some method of birth control in the future has increased among all groups during 1990–2013, including Muslim women in Sharia states. The proportion of non-users who do not intend to use any method of birth control has dropped to 43% for Christians and 55% among Muslims in non-Sharia states in 2013. However, the decline has halted among Muslim women in Sharia states in recent years and about 76% of non-users do not wish to use any contraception in future, see Table V. According to 2013 DHS, 52% of Christian women currently not using contraception and 38% of Muslim women in non-Sharia states reported they would like to use contraception. The situation is very different among Muslim women in Sharia states, where only 12% of women below age 35 expressed a wish to use birth control, a little more than 7·5% among 35–49 year olds.
Trends in the intentions not to use contraception among the married women not using any method to prevent pregnancy, by religion.Footnote 19

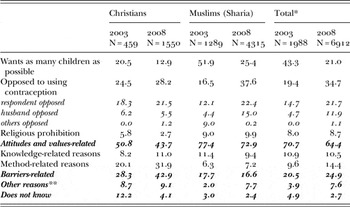
The main reason given for not intending to use any birth control in the future (by the non-users who do not intend to use any birth control) has shifted from wanting as many children as possible, which was the most prominent reason given by the Muslim women from Sharia states, towards opposition to contraception in the period from 2003 to 2008,Footnote 20 see Table VI. This shift is visible for both Christians and Muslims in Sharia states. The growth in opposition to contraception, from 25% to 28% among Christians and 17% to 38% among Muslims may be related to, among other factors, more conservative religious views that stigmatise modern contraception. A smaller proportion of the respondents explicitly cited religious prohibition as the main reason for not using birth control in the future. Religious prohibition was cited more frequently by Muslims (9% in 2003 and 10% in 2008) than by Christians where the share actually declined (from 6% in 2003 to 3% in 2008).
Attitudes towards contraception among non-users, women aged 15–34 years.Footnote 21

* All married women not using any method to prevent pregnancy who do not intend to start in the future.
** Including other fertility-related reasons such as infertility, infrequent intercourse etc.
Compared with 2003, more Muslim non-users from Sharia states cited husband's opposition to birth control – up from about 4% to 15% in 2008, while Christians saw a stagnation of around 6%. Due to this shift towards presumably more direct pressure not to take contraception, fewer cited disapproval of others as influential in their decision. This suggests that both the internalization of attitudes leading to disapproval of birth control and social pressure against use may have intensified in Sharia law states. Moreover, this shift is consistent with a significant body of literature documenting the pivotal role male fertility preferences play on fertility decisions in Nigerian society, particularly among the Hausa ethnic group predominant in northern Nigeria (Isiugo-Abanihe 1994; Bankole & Singh Reference Bankole and Singh1998; Duze & Mohammed Reference Duze and Mohammed2007; Izugbara et al. Reference Izugbara, Ibisomi, Ezeh and Mandara2010).
Another difference between all Christian and Muslim non-users in Sharia states is illustrated in the reason for intention not to use contraception in the future. Here we observe that among Christians the rationale for not intending to use is more frequently related to barriers such as lack of knowledge or a lack of access to contraception (e.g. due to high price, no access, or health concerns). The aforementioned reasons have been increasingly cited by Christian non-users, by about 43% compared with about 17% of Muslims non-users in 2008 (this percentage has not fluctuated). We assume that respondents citing barriers-related reasons are not principally opposed to birth control. If so, a larger proportion of Christian and a smaller proportion of Muslim women would intend to use some methods of preventing pregnancy if they were better informed, had financial means to buy contraceptives and had (better) access to facilities offering methods of family planning.Footnote 22 Problematic access to family planning facilities and services may indeed be a reason why Muslim women in Sharia states who perceive unmet need have little choice, in particular if reproductive choices are being made in a highly unpredictable context (see Johnson-Hanks et al. Reference Johnson-Hanks, Caldwell, Dennis, Guyer, Miyazaki, Notermans and Randall2005; Johnson-Hanks Reference Johnson-Hanks2007). DHS data on the family planning services network in Nigeria do not allow for a more detailed analysis. However, we can conclude that the current opposition to modern contraceptive use is an important reason not to use birth control for Muslim women in Sharia states and it is as much embedded in as it sustains high fertility culture in the region.
POPULATION PROJECTIONS
Will Nigeria become a majority Muslim country?
We argue in the previous sections that the institutionalization of Sharia law has led to persistent high fertility as a result of the protective role it plays in sustaining a high fertility culture. With a small share of the Muslim population residing in non-Sharia states, the fertility of Sharia-state Muslims drives the overall high fertility of Nigerian Muslims. The lack of convergence in Muslim-Christian fertility differentials will not only change the religious landscape of Nigeria, but can also affect overall population growth. If the greater fertility of Muslims is sustained, this will lead to faster population growth over time, particularly as the proportion of Muslims grows. However, if fertility rates for both Muslims and Christians were to converge and decline, this would imply a lower population growth in the coming decades. We study the possible consequences of different fertility trajectories on religious composition in Nigeria using a demographic projection model that takes into account differences in fertility, intergenerational transmissions of religion and age-distribution of religious beliefs (Goujon et al. Reference Goujon, É.C., Skirbekk and Brunn2013; Hackett et al. Reference Hackett, Connor, Stonawski, Skirbekk, Potančoková and Abel2015a; Stonawski et al. Reference Stonawski, Skirbekk, Kaufmann and Goujon2015).
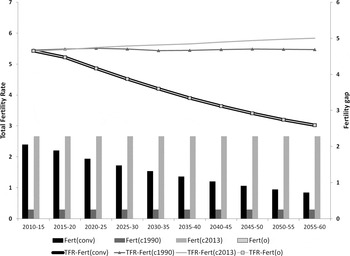
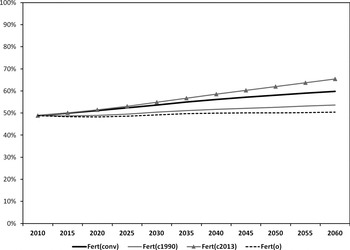
The projection of population by age, sex and religion in NigeriaFootnote 23 is based on the demographic method of multi-state population projectionsFootnote 24 that is widely accepted by technical demographers (Samir et al. Reference Samir, Barakat, Goujon, Skirbekk, Sanderson and Lutz2010; Hackett et al. Reference Hackett, Connor, Stonawski, Skirbekk, Potančoková and Abel2015a, Reference Hackett, Stonawski, Potančoková, Grim and Skirbekk2015b). In order to illustrate the long-term consequences of fertility differentials by religion on the religious landscape of the country, we introduce four scenarios in the period of 50 years, from 2010 to 2060. The scenarios only differ in terms of fertility assumptions (see Figure 6):
-
(1) in the first scenario – Fert(conv) – we assume slow convergence in fertility between Muslims and Christians from initial levels observed in 2010 that would lead to the same level and age-pattern for these groups by 2110 (within 100 years). At each step of this scenario, TFR for the total population follows the UN medium assumptions (United Nations 2011);Footnote 25
-
(2) in the second scenario – Fert(c1990) – the assumption is that fertility by religion is constant during the whole projection period. This we estimate using fertility age-patterns based on the 1990 DHS and adjust them to meet baseline fertility level from the UN (United Nations 2011);
-
(3) similar to Fert(c1990) – Fert(c2013) – fertility is constant but on the level estimated from the 2013 DHS that are adjusted to be in line with the UN level in 2010–15;
-
(4) the last scenario – Fert(o) – is designed to examine how religious composition would change if there was no difference in fertility between religious groups, and TFR of total population followed the UN medium scenario assumptions (United Nations 2011).
Total fertility rate and fertility gap between Muslims and Christians in Nigeria in 2010–2060 by scenario.Footnote 26

Because of a lack of empirical evidence on religion-specific mortality, we assume no mortality difference between religious groups. The course of change in mortality in 2010–2060 follows the 2010 UN medium assumptions. Baseline inflow and outflow of migrants in Nigeria are calculated using estimates of international migration bilateral flows (Abel Reference Abel2013). Religion of migrants was estimated using information from the Pew Research Center's Faith on the Move project (Connor Reference Connor2012). In all scenarios we assume religious switching between Christians and Muslims. Evidence from the Global Attitudes Project of Pew Research Center suggests that around 3–4% of males and 1–2% females (both Muslims and Christians) convert during their life. We model this explicitly in the projections by introducing transition rates.
The results from our projection model suggest that constant fertility levels from the baseline could lead to a dramatic change in population size in Nigeria. During the coming 50 years the population size is projected to increase from 158 million in 2010 to 715 million if relative difference in fertility by religion is kept constant as observed in 2013 (Fert(c2013)), and to 678 million, if fertility differentials from 1990 is used (Fert(c1990)). Fertility following the UN medium trajectory (United Nations 2011) leads to 468 million people by 2060 (Fert(conv) and Fert(o)). As a result of strong population growth, Nigeria may have the second largest Christian and fourth largest Muslim population by 2050 (Hackett et al. Reference Hackett, Connor, Stonawski, Skirbekk, Potančoková and Abel2015a).
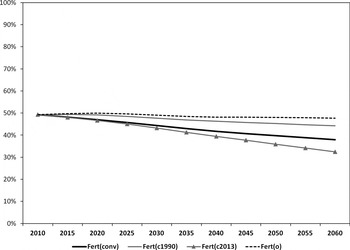
In addition to strong overall population growth, it is likely that Nigeria's population will undergo significant changes in religious composition (Figures 7 and 8). A shift away from the current shares seems inevitable, placing the country on a clear path towards becoming a majority Muslim country in the coming decades. Even if there were no differences in fertility between the two religious groups (Fert(o) scenario), the proportion of Christians would decrease from 49·3% in 2010 to 47·7% in 2060, whereas Muslims would gain 1·6 percentage points and for the first time in the history of a united Nigeria reach a majority of 50·4%. In this scenario the differences in population structure, migration, and religious switching between Muslims and Christians have a minor impact on religious composition (Fert(o)).
Proportion of Christians in Nigeria in 2010–2060 by scenario.

Proportion of Muslims in Nigeria in 2010–2060 by scenario.

Several other scenarios suggest a stronger increase in the size of the Muslim population resulting in a growing majority share of the total population. If the relative difference in fertility is projected from the 1990 level, when the differential was small, the proportion of Christians drops to 44% and Muslims rise to 54%. In a situation of more pronounced and slowly diminishing fertility gap (Fert(conv)), the share of Muslims increases to almost 60% of Nigeria's population and Christians drops to 38% in 2060. Finally, the scenario with the most pronounced fertility gap at the level of the 2013 DHS and constant fertility – Fert (c2013) TFR: Muslims – 6·8, Christians – 4·5 – shows that the Muslim population can reach as much as 65% whereas Christians can decline to as little as 32%. In 2003, 2008 and 2013 DHS data we see stable fertility differential between Christians and Muslims and the data so far do not support the convergence scenario. This does not mean that convergence is not possible in the future but for the coming years the share of the Muslim population will likely follow the Fert(c2013).
We assume in our scenarios, conservatively, that the fertility differentials between Christians and Muslims could decrease or remain constant at the baseline level. However, it is also possible that in the future the fertility of Christians will decrease following the demographic transition trajectory and Muslim fertility stagnates at the current level (e.g. due to a lack of modernisation and sustained high fertility culture). Such a divergence would lead to a far greater share of Muslims in the religious landscape of Nigeria – reaching as high as 70–80% by 2060.
CONCLUSIONS AND DISCUSSION
Nigeria is most likely going to become a majority Muslim country in no more than a couple of decades unless the differential between the Muslim and Christian fertility quickly converges in the near future. However, this is not likely to happen given the high fertility ideals, low prevalence of family planning, and slow educational improvements in Sharia states. Quite to the contrary, legal implementation of Sharia may sustain the high fertility culture by preventing modernisation as a result of opposition towards the Western influence and increased desires to preserve cultural differences in respect to the rest of Nigeria's population.
In this regard, the institutionalisation of Sharia law should be viewed as a symptom of societal preferences that have long been present throughout northern Nigeria. It is likely however that the ongoing normalisation of Sharia law will lead to greater societal pressure to conform to underlying tenets, thus reinforcing many practices contributing to higher fertility while forming a bulwark against Western influences conducive to lower fertility (on normalisation, see e.g. May & Finch Reference May and Finch2009). In Nigeria we are therefore witnessing the confluence of distinctly pronatalist traditions in sub-Saharan Africa (Bongaarts & Casterline Reference Bongaarts and Casterline2013) with a conservative religious ideology, a synthesis which will likely continue to result in high ideal family size and sustained higher fertility.
Fertility intentions and preferences can be powerful in terms of shaping behaviour and they can also be important as a marker of how potentially unrestricted pronatalism penetrates religious and cultural norms following Sharia. Therefore, high fertility can be seen as an integral part of the local traditions and institutionalisation of Sharia law may be seen as a way to preserve local culture. High fertility ideals are a key aspect of high fertility culture and as we showed earlier more than 50% of women in Sharia states prefer large families of 10 and more children or ‘any number of children God gives them’. Only 7% think that four or fewer children is ideal – this contrasts sharply with declining fertility ideals throughout the rest of Nigeria. Marriage customs, polygyny and in particular high divorce rates that result from liberal divorce regulations under Sharia are among other possible factors responsible for sustained high fertility among the majority of Muslims in Nigeria. We could not empirically investigate these potential influences due to data limitations, however, existing research supports this interpretation (e.g. Izugbara & Ezeh Reference Izugbara and Ezeh2010).
Nigeria is an outstanding case due to the uniquely balanced population share of the two main religions and the clear divergence in demographic trends. The high relevance of religion within the Nigerian context further underscores the usefulness of considering religion in demographic studies. According to the 2008 Afrobarometer, both Muslims and Christians claim that religion is very important in their life (95% of Muslims and 88% of Christians). Nigerian society is divided across religious, ethnic and regional lines with a long history of rivalry between the largely Muslim North and mostly Christian South. Moreover, religion is the most frequently cited reason of violent conflict in Nigeria besides land disputes, according to Afrobarometer (2001 and 2003). Religious conflict has intensified since the time of the survey; Boko Haram began committing atrocities in 2008 and therefore it is likely that religion has become an even more important driver of political instability.
Our projections show that should this fertility gap remain constant, or slowly decrease (in the convergence scenario), Nigerian Muslims will have a clear 60% majority by 2060, making it one of the largest Muslim states in the world. However, it is very likely that the gap in fertility can grow even further leading to a higher share of Muslims in Nigerian society. This discrepancy can ultimately bring significant change to democratic outcomes, redefine the political dynamics between traditionally comparable religious groups, and potentially call into question power-sharing agreements such as the rotating presidency. Indeed, within the context of an ethnically and religiously diverse country such as Nigeria, a newfound emphasis on religious identity coupled with religion-specific fertility differentials could very well be precursors to future sectarian conflict and carry significant political and economic implications for the region and the world.
APPENDIX
A1. Decomposition method for disentangling fertility change from educational change.
Two components: (1) educational change, (2) fertility change
 $$\eqalign{& \Delta TFR = TFR\left( {t + h} \right) - TFR\left( t \right) \cr & = 5\mathop \sum \limits_{a,e} ASFR_{a,e}\left( {t + h} \right)\,\cdot \,\displaystyle{{w_{a,e}\left( {t + h} \right)} \over {w_a\left( {t + h} \right)}} - 5\mathop \sum \limits_{a,e} ASFR_{a,e}\left( t \right)\,\cdot \,\displaystyle{{w_{a,e}\left( t \right)} \over {w_a\left( t \right)}} \cr & = 5\mathop \sum \limits_{a,e} \left[ {\left( {\displaystyle{{ASFR_{a,e}\left( {t + h} \right) + ASFR_{a,e}\left( t \right)} \over 2}} \right)\left( {\displaystyle{{w_{a,e}\left( {t + h} \right)} \over {w_a\left( {t + h} \right)}} - \displaystyle{{w_{a,e}\left( t \right)} \over {w_a\left( t \right)}}} \right)} \right] \cr &\quad + 5\mathop \sum \limits_{a,e} \left[ {\left( {\displaystyle{{\displaystyle{{w_{a,e}\left( {t + h} \right)} \over {w_a\left( {t + h} \right)}} + \displaystyle{{w_{a,e}\left( t \right)} \over {w_a\left( t \right)}}} \over 2}} \right)\left( {ASFR_{a,e}\left( {t + h} \right) - ASFR_{a,e}\left( t \right)} \right)} \right]}$$
where: ASFR a,e (t + h) – age specific fertility rate at age a and educational group e at time t + h, w a,e (t + h)- number of females at age a and education e at time t + h.