Implications
All genomic evaluations have to rely on the association of phenotypes with genotypes. In dairy cattle, phenotypic information for genotyped sires often comes from other countries where daughters of these sires are present. This is especially the case for small populations that often rely on importation of bulls from larger populations. Appropriate genomic evaluation systems combining optimally all information are therefore internationally warranted to maximize their positive social impact on the whole breeding industry (i.e. breeders, artificial insemination companies). Only when based on such advances, genomic selection can contribute broadly on an economic and, using the appropriate traits, environmental level. Currently there are few contributions. Therefore this paper shows, using the example of the Walloon region of Belgium, how such an advanced approach can be implemented in the setting up of a single-step genomic evaluation.
Introduction
Simultaneous use of all relevant data by BLUP is a requirement to predict unbiased breeding values (Henderson, Reference Henderson1984). However, this condition is not always fully met. Especially in dairy cattle, but also in other species where external animals are introduced, foreign artificial insemination (AI) sires are strongly preselected, but foreign raw data used to do this selection is unavailable leading to potential biases in local evaluations. Local estimated breeding values (EBV) might be also less accurate because only incomplete data are available (i.e. foreign raw data is not included). Genomic selection could increase these problems for local genomic evaluations. Currently, most genomic evaluation systems are multi-step (VanRaden et al., Reference VanRaden2009). The multi-step methods involve a deregression step of, mainly highly reliable, EBV to obtain pseudo-records, followed by regressing these pseudo-records on genomic relationships with a blending of the traditional pedigree-based information (VanRaden, Reference VanRaden2008). Usually, the primary sources of foreign phenotypic information are the results from the Multiple Across Country Evaluation (MACE) computations, performed by the Interbull Centre (Uppsala, Sweden). On the other hand, more and more genomic evaluation systems (e.g. Harris et al., Reference Harris, Winkelman and Johnson2012; Koivula et al., Reference Koivula, Strandén, Pösö, Aamand and Mäntysaari2012; Přibyl et al., Reference Přibyl, Madsen, Bauer, Přibylová, Šimečková, Vostrý and Zavadilová2013) show interest switching to approximate, using pseudo-observations, or full single-step genomic BLUP (ssGBLUP), that simultaneously combines genomic, pedigree and all local phenotypic information (Legarra et al., Reference Legarra, Christensen, Aguilar and Misztal2014). The ssGBLUP, mainly through the simultaneous combination, should reduce potential biases introduced by the multi-step methods in the estimation of genomically enhanced breeding values (GEBV; VanRaden, Reference VanRaden, Olson, Null, Sargolzaei, Winters and Van Kaam2012). However, ssGBLUP normally uses local information and does not natively fulfil the condition by using all important sources of information, as multi-step methods do; that is, by relying on MACE results.
The Walloon dairy cattle population under performance recording is a small-scale population of ~55 000 cows, mainly sired by foreign bulls. For example, 81% of the cows in 1st to 3rd parity in 2015 were sired by AI bulls born outside of the Walloon Region of Belgium. In this context, properties of both multi-step and single-step methods mentioned before, were attractive in the development of Walloon genomic evaluations systems. Due to the widespread use of imported AI bulls, the recovery of sources of information, such as MACE, was required for the Walloon genomic evaluation system. However, due to the type and evolution of the genotyped population (i.e. more genotyped cows) and expected future developments (e.g. novel traits recorded on genotyped cows, multi-trait models) ssGBLUP was considered the best option for the Walloon genomic evaluation, but under the condition to combine simultaneously all available genotype, pedigree, local and foreign information in a single-step genomic evaluation.
Towards this orientation, in order to support local breeding, the objective of this study was to report the development of a full genomic evaluation for Walloon Holsteins by using single-step genomic prediction combining local and foreign information (MACE results).
Material and methods
Hereafter, records will refer to EBV and associated reliabilities (REL), local information will refer to local EBV and associated REL estimated from available local data and foreign records or information will refer to MACE EBV and associated REL.
Genotyped and phenotyped populations
During the April 2016 run, 4847 genotyped animals were included in the Walloon genomic evaluations. Among them, 4324 were born after the year 2001, the remaining genotyped animals being ancestors. A large majority of genotyped animals were bulls (4038 bulls v. 809 cows). Among these genotyped bulls were a large proportion of the sires and maternal grandsires of recent Walloon Holstein cows. Approximately half of the cows were genotyped during research projects representing the Walloon variability in Holstein cattle, and the other cows were genotyped upon request from breeders, limiting the risk of preselection. A total of 38 374 single nucleotide polymorphisms (SNP) markers were selected after editing for call rates and minor allele frequencies. The pedigree extracted for the genotyped animals and from the database used for the official Walloon genetic evaluation included 29 383 animals.
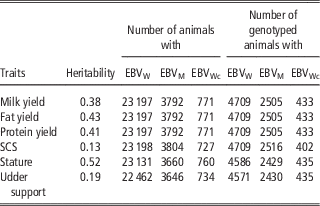
Genetic parameters, number of animals and information available from single trait analyses of six traits (milk yield, fat yield, protein yield, somatic cell score (SCS), stature and udder support) are presented in Table 1. The production traits (milk, fat and protein) were defined as 305 days yields, SCS was defined as average value across lactations. All genotyped cows were associated with records in the routine Walloon genetic evaluation, but not all genotyped sires. Numbers of available local and foreign records were slightly different among the traits. Local information included EBV and associated REL for bulls and cows estimated from data provided by the Walloon Breeding Association (subscript W; EBVW; RELW) for the official Walloon evaluation of December 2015. Foreign information included MACE EBV and REL for sires provided by the December 2015 MACE evaluation (subscript M; EBVM, RELM).
Used genetic parameters and amount of local and foreign information available for the genomic evaluation in April 2016

EBV=estimated breeding value with subscripts: W=Walloon genetic evaluation, M=Multiple Across Country Evaluation (MACE), Wc=Walloon contribution to MACE evaluation; SCS=somatic cell score.
For every trait, contributions of Walloon information into MACE were determined based on the domestic effective daughter equivalents (EDC) associated with EBVM and RELM as reported by Interbull. Multiple Across Country Evaluation information free of Walloon information had, therefore, a reported domestic EDC equal to 0. For all animals and traits with a domestic EDC different from 0, Walloon EBV and associated REL contributing to the December 2015 MACE routine-run (subscript Wc; EBVWc; RELWc) were considered to avoid double counting of contributions due to records (Table 1). Information was harmonized between the local and MACE values by adjusting scale and mean difference towards the original expression of the trait reported in the Walloon genetic evaluation computations. Local phenotypic information was, therefore, also summarized using EBV and REL.
Bayesian integration procedure
A Bayesian procedure to integrate multiple sources of external information into local genetic evaluations was outlined by Vandenplas et al. (Reference Vandenplas, Colinet, Glorieux, Bertozzi and Gengler2014). The term ‘Bayesian’ refers to the alteration of the prior mean and (co)variances of the random additive genetic effect of the local genetic evaluation. The alteration is based on the knowledge of EBV and REL obtained from a genetic evaluation other than the local genetic evaluation, for allowing the consideration of this information by the local genetic evaluation. While it is, at least theoretically, equivalent to an approach based on deregression (Calus et al., Reference Calus, Vandenplas, ten Napel and Veerkamp2016), the proposed Bayesian approach has the advantage that it does not rely explicitly on pseudo-observations, because it directly generates an approximate system of equations. Also, Vandenplas et al. (Reference Vandenplas, Colinet, Glorieux, Bertozzi and Gengler2014) outlined that these proposed systems of equations could be extended to integrate multiple sources of external information into ssGBLUP. An advantage of Bayesian procedures is that foreign original phenotypes are not required. The equations blend local and several sources of external information and avoid double counting of contributions due to records and due to relationships. It was adapted to blend Walloon and MACE information into a ssGBLUP for each trait separately. This method, hereafter called single-step genomic Bayesian procedure (ssGBayes), was used as the computational method for the Walloon genomic evaluation system. The equation associated with ssGBayes that blends genomic, Walloon and MACE information and that considers Walloon information contributing to MACE (hereafter called ssGBayesW+M−Wc) can be written as follows:
 $$ \eqalignno{ & \left( {{\bf G}^{{{\bf {\asterisk} }{\minus}{\bf 1}}} {\plus}{\bf \bLambda }_{{\bf W}} {\plus}{\bf \bLambda }_{{\bf M}} {\minus}{\bf \bLambda }_{{{\bf Wc}}} } \right){\bf \hat{\vskip 2.5pt a}}_{{{\bf W}{\plus}{\bf M}{\minus}{\bf Wc}}} \, \cr & \quad \quad{ {\equals}\,{\bf D}_{{\bf W}}^{{{\minus}{\bf 1}}} \!{{\bf {\hskip 5pt \vskip -3pt \hat} {\bf \hskip -2.9pt u}}}_{{{\bf W}}} {\plus}{\bf D}_{{\bf M}}^{{{\minus}{\bf 1}}} \!\!{ {\vskip -3pt \hskip 6pt \bf \hat}{\bf \hskip -3pt u}}_{{\bf M}} {\minus}{\bf D}_{{{\bf Wc}}}^{{{\minus}{\bf 1}}}}\, {{\rm {\hskip 3pt \vskip -3pt \hat}{\bf \hskip -2pt u}}}_{{{\bf Wc }}} $$
where
 $${\bf G}^{{\bf {\asterisk}}} \,{\equals}\,{\bf H}\sigma _{a}^{2} $$
is the combined genomic-pedigree-based (co)variance matrix, H being the combined genomic-pedigree-based relationship matrix (e.g. Aguilar et al., Reference Aguilar, Misztal, Johnson, Legarra, Tsuruta and Lawlor2010; Christensen and Lund, Reference Christensen and Lund2010),
 $$\sigma _{a}^{2} $$
being the additive genetic variance;
 $${\vskip -3pt \hskip -3pt \bf \hat}{\hskip -3pt \rm a}}_{{{\bf W}\!{\plus}\!{\bf M}{\minus}{\bf Wc}}} $$
is the unknown vector of Walloon GEBV based on Walloon and MACE information;
 $${\vskip -2pt \hskip -3pt \bf \hat{\vskip 3pt u}}_{{\bf W}} $$
is the vector of EBVW;
 $${\vskip -2pt \hskip -2pt \bf \hat{\vskip 2.5pt u}}_{{\bf M}} $$
is the vector of EBVM;
 $${\vskip -2pt \hskip -2pt \bf \hat{\vskip 3pt u}}_{{{\bf Wc}{\rm }}} $$
is the vector of EBVWc;
 $${\bf \Lambda }_{{\bf i}} $$
(i=W, M and Wc) is a matrix mimicking the least squares contributions to the left-hand side (LHS) of the hypothetical BLUP equations based on Walloon and MACE information and
 $${\bf D}_{{\bf i}}^{{{\minus}{\bf 1}}} $$
is the inverse of the prediction error (co)variance matrix of
 $${\vskip -2pt \hskip 2pt \bf \hat{\vskip 3pt u}}_{{\bf i}} $$
. More details how
 $${\bLambda }_{{\bf i}} $$
and
 $${\bf D}_{{\bf i}}^{{{\minus}{\bf 1}}} $$
were approximated are given later.
The inverse of the combined genomic-pedigree-based relationship matrix H was computed using the inverse of the additive pedigree relationship matrix A and a modified genomic relationship matrix, using the following formula:
 $${\bf H}^{{{\minus}1}} \,{\equals}\,{\bf A}^{{{\minus}1}} {\plus}\left[ {\matrix{ 0 & 0 \cr 0 & {\tau (\alpha {\bGamma } {\plus}{\rm (1{\minus}}\alpha {\rm )}{\bf A}_{{22}} )^{{{\minus}1}} {\minus}\omega {\bf A}_{{22}}^{{{\minus}1}} } \cr } } \right]$$
where A
22 is the additive pedigree relationship matrix for the genotyped animals;
 $${\bGamma } $$
is the genomic relationship matrix; τ and ω are empirical weight factors (e.g. Tsuruta et al., Reference Tsuruta, Misztal, Aguilar and Lawlor2011), for the inverse of the modified genomic relationship matrix and the inverse of A
22, respectively. The matrix
 $${\bGamma } $$
was computed following the first method of VanRaden (Reference VanRaden2008), that is:
 $${\bGamma } \,{\equals}\,{{{\bf ZZ'} } \over {{\rm 2}\mathop{\sum}{{\rm p}_{{\rm i}} \left( {{\rm 1{\minus}p}_{{\rm i}} } \right)} }},$$
where Z is the centred matrix of SNP markers alleles that each individual inherited and p i is the minor allele frequency at locus i.
For compatibility between A
22 and
 $${\bGamma } $$
, diagonal and off-diagonal values of
 $${\bGamma } $$
were, respectively, centred on the average of diagonal and off-diagonal elements of A
22. Based on suggestions from Tsuruta et al. (Reference Tsuruta, Misztal, Aguilar and Lawlor2011), τ and ω were respectively fixed to 1 and 0.70. The value for ω helped to reduce inflation of GEBV and compensated for pedigree incompleteness (Misztal et al., Reference Misztal, Vitezica, Legarra, Aguilar and Swan2013; Masuda et al., Reference Masuda, Misztal, Tsuruta, Legarra, Aguilar, Lourenco, Fragomeni and Lawlor2016). Therefore it also compensated for associated potential incompatibilities between A, and A
22, that is due to differences in the consideration of inbreeding, the directly constructed A
−1 matrix did not consider inbreeding in order to stay close to the routine polygenic evaluation, but A
22, to be compatible with
 $${\bf \Gamma } $$
, considered inbreeding.
The values of α reflect the partition of the genetic variance between the SNP and residual polygenic parts and were fixed to 0.60 for milk production traits and to 0.65 for the other traits. These values were based on additional studies (results not shown) verifying the effect of different α in terms of predictability of future (G)EBV from data limited to that collected 4 years earlier.
Regarding the vectors
 $${\vskip -3pt \hskip 1pt \bf \hat{\vskip 3ptu}}_{{\bf i}} $$
for the three sources of information (i.e. W, M and Wc), it is worth noting that only some animals included in the pedigree were associated with known EBV and REL (hereafter called external animals). Therefore, for each i
th source of information, animals not associated with available EBV were called internal animals. The vector of EBVi (i=W, M and Wc) for all animals included in the pedigree,
 $${\vskip -3pt \hskip 3pt \bf \hat{\vskip 3pt u}}_{{\bf i}} $$
, was estimated as (Vandenplas et al., Reference Vandenplas, Colinet, Glorieux, Bertozzi and Gengler2014):
 $${\vskip -3pt \hskip 2pt \bf \hat{\vskip 3pt u}}_{{\bf i}} \,{\equals}\,\left[ {\matrix{ {{\bf G}_{{{\bf i(IE)}}} {\bf G}_{{{\bf i(EE)}}}^{{{\minus}{\bf 1}}} {\bf \vskip -3pt \hskip 2pt \hat{\vskip 3pt u}}_{{{\bf i(E)}}} } \cr {{\bf \vskip -3pt \hskip 2pt \hat{\vskip 3pt u}}_{{{\bf i(E)}}} } \cr } } \right]$$
where
 $${\bf G}\,{\equals}\,{\bf A}\sigma _{a}^{2} $$
and the subscript i refers to internal animals not associated with the i
th source of information, the subscript E refers to external animals associated with the ith source of information,
 $${\vskip -3pt \hskip 3pt \bf \hat{\vskip 3pt u}}_{{{\bf i(E)}}} $$
is the vector of EBV for the i
th source of information associated with external animals and:
 $${\bf G}^{{{\minus}{\bf 1}}} \,{\equals}\,\left[ {\matrix{ {{\bf G}_{{{\bf i(EE)}}} } & {{\bf G}_{{{\bf i(EI)}}} } \cr {{\bf G}_{{{\bf i(IE)}}} } & {{\bf G}_{{{\bf i(II)}}} } \cr } } \right]^{{{\minus}{\bf 1}}} $$
is the inverse of the pedigree-based (co)variance matrix.
For the three sources of information (i.e. W, M and Wc), the matrix
 $${\bf D}_{{\bf i}}^{{{\minus}{\bf 1}}} $$
was approximated as:
 $${\bf D}_{{\bf i}}^{{{\minus}{\bf 1}}} \,{\equals}\,{\bf G}_{{}}^{{{\minus}{\bf 1}}} {\plus}{\bLambda }_{{\bf i}}^{{}} ,$$
where
 $${\bLambda }_{{\bf i}}^{{}} $$
is a diagonal variance matrix with one diagonal element per animal equal to
 $${{RE_{{ij}} } \mathord{\left/ {\vphantom {{RE_{{ij}} } {\sigma _{e}^{2} }}} \right. \kern-\nulldelimiterspace} {\sigma _{e}^{2} }}$$
for j=1, 2, …, J animals (Vandenplas et al., Reference Vandenplas, Colinet, Glorieux, Bertozzi and Gengler2014). The element
 $$\sigma _{e}^{2} $$
is the residual variance and the element RE
ij
is the effective number of records, so-called record equivalents, for the jth animal. Record equivalents expressed the amount of contributions for an animal (Misztal and Wiggans, Reference Misztal1988). For both Walloon and MACE information, it is worth noting that double counting of contributions due to relationships among related animals could exist. Indeed, contributions for a given animal were initially associated to own information and to those coming from related animals. Therefore, the effective number of records RE
ij
for the external animals requires to be cleaned for these latter contributions, and was estimated using a two-step algorithm (Vandenplas and Gengler, Reference Vandenplas, Colinet and Gengler2012). The two-step algorithm is a process that reverses the approach used by Misztal and Wiggans (Reference Misztal1988) who concentrated the contribution from own records and relatives. The two-step also algorithm takes into account all relationships between animals associated with information and their ancestors. For the internal animals, RE
ij
is equal to 0, because they have no own records in the considered external genetic evaluation.
Comparisons with computations without Multiple Across Country Evaluation results
Because a major feature of this optimized single-step genomic evaluation system, as implemented in the Walloon genomic evaluation system, is its ability to use MACE information, in comparison with standard ssGBLUP, the influence of the use of this information was tested. Therefore ssGBayes was run considering only Walloon information (ssGBayesW) using the following, simplified, system of equations:
 $$\left( {{\bf G}^{{{\asterisk}{\minus}{\bf 1}}} {\plus}{\bLambda }_{{\bf W}} } \right){\vskip -3pt \hskip 2pt \bf \hat{\vskip 3pt a}}_{{\bf W}} \,{\equals}\,{\bf D}_{{\bf W}}^{{{\minus}{\bf 1}}} {\vskip -3pt \hskip 2pt \bf \hat{\vskip 3pt u}}_{{\bf W}} ,$$
where
 $${\vskip -3pt \hskip 2pt \bf \hat{\vskip 3pt a}}_{{\bf W}} $$
is the vector of Walloon GEBV only based on Walloon information.
By comparing [6] and [7], it is important to highlight that under the hypothesis that no animals were genotyped (
 $${\bf G}^{{{\asterisk}{\rm }{\minus}{\bf 1}}} \,{\equals}\,{\bf G}_{{}}^{{{\minus}{\bf 1}}} $$
), we obtained
 $${\vskip -3pt \hskip 2pt \bf \hat{\vskip 3pt a}}_{{\bf W}} \,{\equals}\,{\vskip -3pt \hskip 2pt \bf \hat{\vskip 3ptu}}_{{\bf W}} $$
which is the original set of Walloon EBV. Because the equations associated with ssGBayesW+M−Wc and ssGBayesW, respectively, represented hypothetical mixed model equations, REL was computed using the standard formula:
 $${{\rm REL}_{{\rm j}} {\rm \,{\equals}\,1{\minus}\,PEV}_{{\rm j}} {\rm \,/\,\sigma }_{{\rm j}}^{{\rm 2}} }{\rm ,}$$
where
 $$\sigma _{j}^{2} $$
is the diagonal element of G
* for animal j and PEV
j
is the prediction error variance obtained from the diagonal element of the inverted left-hand side for this animal j. Computations of (G)EBV and associated PEV by the two ssGBayes runs were executed using BLUPF90 (Misztal, Reference Misztal and Wiggans2013) modified to implement ssGBayes equations.
Enhanced breeding values validation
The GEBV validation was based on the GEBV test (Mäntysaari et al., Reference Mäntysaari, Liu and VanRaden2010) established by Interbull Centre (Sweden). The GEBV Interbull test compares the bias and the improvement of accuracy of a forward prediction when genomic information is used (i.e. a genomic evaluation), or is not used (i.e. a conventional genetic evaluation). The forward prediction uses EBV or GEBV predicted by using data available 4 years ago, that is we must exclude the last 4 years of data and re-run the analyses with reduced data, and using the same model that is being tested.
To test bias in national genomic evaluations, a regression model is used to estimate the slope (b1), to compare with its expectation and test bias on GEBV. The statistical significance is tested by using a t test against H0 (Confidence interval of 95%). Moreover, improvement in accuracy is performed by comparing the coefficient of determination (R 2) of the reduced genomic model and equivalent reduced conventional model (from 4 years ago) regressed to current performances. This validation accuracy is calculated as follows:
 $$R_{{validation}}^{2} \,{\equals}\,{{R^{2} } \over {\overline{w} }},$$
where
 $${\bar w} $$
are a function of average EDC of all tested bulls (Mäntysaari et al., Reference Mäntysaari, Liu and VanRaden2010).
The GEBV test consists basically in two tests, for bias and improvement from polygenic evaluation. To pass the GEBV test, first, for a given country by trait combination, the value of b 1 must be greater than the lower endpoint of the 95% confidence interval or biological equivalent. Moreover, the R 2 from the model including genomic information must be higher than the model including only parent average information (polygenic). Detailed information regarding the Interbull validation test for genomic evaluations (GEBV test) can be found in http://www.interbull.org/ib/cop_appendix8.
In order to check the influence of MACE results, we tested two types of genomic evaluations, with and without foreign information.
Results
Table 1 contains the number of (genotyped) animals with local and foreign information available for the six analysed traits (milk yield, fat yield, protein yield, SCS, stature and udder support). Approximately 3750 bulls evaluated by Interbull were also included in the computations. Walloon information for around 20% of these bulls contributed to the December 2015 MACE routine-run. Table 1 also indicates that at least 61% of the 4038 genotyped bulls and at least 13% of the 29 383 animals in the pedigree file had foreign information.
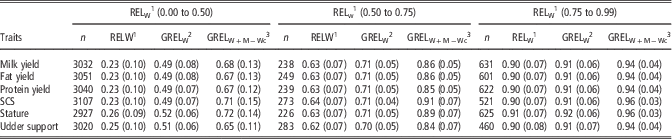
Table 2 gives details on the improvement of average REL when only genomic and local information was considered. For the genotyped bulls with low reliable official Walloon EBV (RELW<0.50), the genomic information allowed a substantial increase of 0.26 points for average REL of these bulls according to the studied traits.
Average reliabilities (REL; SD in parentheses) associated to estimated (genomically enhanced) breeding values (EBVW, GEBVW and GEBVW+M−Wc) when genomic and local information is considered

W=Walloon genetic evaluation; M=Multiple Across Country Evaluation (MACE); Wc=Walloon contribution to MACE evaluation; SCS=somatic cell score.
1 REL obtained from Walloon polygenic evaluation.
2 Genomic REL obtained from Walloon genomic evaluation using only EBVW.
3 Genomic REL obtained from Walloon genomic evaluation using EBVW, EBVM and EBVWc.
The genomic information also increased average REL for bulls with already more accurate Walloon EBV. Indeed, the average REL was increased by 0.07 to 0.08 points for the bulls with RELW between 0.50 and 0.75. Even for locally well proven bulls with RELW⩾0.75, the genomic information added 0.01 to the average REL, for example this represents 11 EDC for milk yield.
Considering the simultaneous combination of genomic and foreign information (i.e. ssGBayesW+M−Wc), the increases of the averaged REL for each of the three mentioned categories of genotyped bulls (Table 2) were higher than those associated with ssGBayesW. As expected, the highest increase of REL was observed for the bulls with the lowest RELW. The use of ssGBayesW+M−Wc led to an increase of average REL between 0.14 points for udder support and 0.22 points for SCS compared with ssGBayesW. The increase was lower for genotyped bulls with RELW included in the range (0.50 to 0.75) with 0.14 to 0.20 additional points of REL, respectively for udder support and SCS. Even for the already locally well proven bulls (i.e. RELW⩾0.75), ssGBayesW+M−Wc still provided more reliable GEBV than ssGBayesW. Additional points of REL ranged from 0.03 for milk production traits to 0.05 for SCS (Table 2).
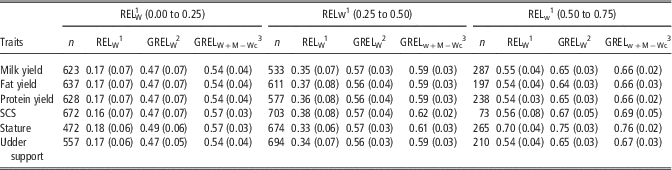
Table 3 shows the enhancements of reliabilities for genotyped animals only associated with EBVW, that is without foreign information, but sired by a genotyped bull with MACE results. These genotyped animals were Walloon cows as well as foreign or Walloon bulls to be tested. Again, similarly to Table 2, even if ssGBayesW allowed an increase of average REL from 0.05 to 0.31 additional points, ssGBayesW+M−Wc led to higher REL. For the six traits, ssGBayesW+M−Wc provided an average REL higher than 0.50 for the genotyped animals with a RELW lower than 0.25.
Average reliabilities (REL; SD in parentheses) associated to estimated (genomically enhanced) breeding values (EBVW, GEBVW and GEBVW+M−Wc) for genotyped animals without Multiple Across Country Evaluation (MACE) (M) results and sired by genotyped bulls with MACE

W=Walloon genetic evaluation; Wc=Walloon contribution to MACE evaluation; SCS=somatic cell score.
1 REL obtained from Walloon polygenic evaluation.
2 Genomic REL obtained from Walloon genomic evaluation using only EBVW.
3 Genomic REL obtained from Walloon genomic evaluation using EBVW, EBVM and EBVWc.
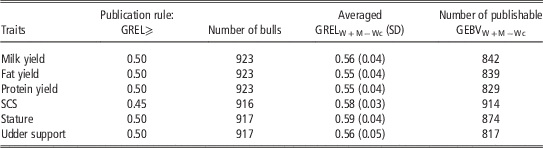
Obtained REL from the Walloon genomic evaluations for young genotyped AI bulls, but having not yet daughters with phenotypic data in Wallonia or own MACE results, are reported in Table 4. If their sires were genotyped and had MACE results, the REL of GEBV of these animals were higher than the publishable threshold in more than 89% of the cases.
Average genomic reliabilities (GRELW+M−Wc Footnote 1 ; SD in parentheses) associated with genomically enhanced estimated breeding values (GEBVW+M−Wc Footnote 1 ) for genotyped bulls without own Multiple Across Country Evaluation (MACE) (M) results, without own daughters with phenotypic data in Wallonia, and sired by genotyped bulls with MACE

W=Walloon genetic evaluation; Wc=Walloon contribution to MACE evaluation; SCS=somatic cell score.
1 GEBVW+M−Wc and GRELW+M−Wc are computed using results from Walloon genetic evaluation (W) and MACE (M) corrected for contribution from contribution of Walloon genetic evaluation to MACE (Wc).
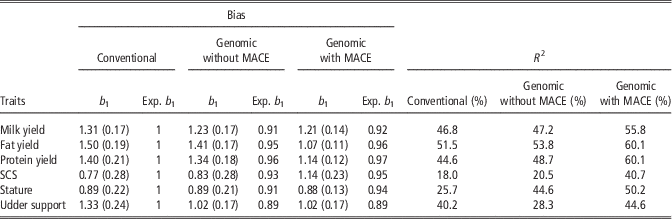
The values of bias and accuracy are presented in Table 5. All reported traits passed the GEBV test established by Interbull for bias and improvement from conventional evaluations by including MACE information. The b 1 values were greater than the lower endpoint of the 95% confidence interval, whereas R 2 values from genomic were higher than R 2 values using only local information. GEBV validation test results from April 2016 showed improvements in R 2 of 9.0% points for milk yield, 8.6% points for fat yield, 15.5% points for protein yield, 22.7% points for SCS, 24.5% points for stature and 4.4% points for udder support.
Bias (SD), expected bias (Exp. b 1) and accuracy (R 2) of genomically enhanced estimated breeding value (GEBV) test by comparing current performances (genomic) with and without Multiple Across Country Evaluation (MACE) information and data available from 4 years ago (conventional evaluation)

SCS=somatic cell score.
In addition, by excluding MACE information, all traits passed the test as well (Table 5). However, the R 2 values were lower compared with those by including MACE. For bias, the expected regression coefficients for the GEBV test were within confidence intervals based on two times standard errors (please see http://www.interbull.org/ib/gebvtest for further information).
Discussion
The computational strategies based on the ssGBayes method used in the Walloon genomic evaluations allowed the incorporation of large amounts of additional information and increased the overall REL of the produced GEBV. Given the limited size of the genotyped population, results were in line with expectations or exceeded them (e.g. Wiggans et al., Reference Wiggans, VanRaden and Cooper2011a). The method should therefore be internationally appealing for small and medium sized populations. Computed REL were based on the inverse of the coefficient matrices and are therefore not directly comparable with results reported in other studies which were based on validation R 2. We are aware that EDC are computed through approximation, but this is a general feature of most REL computations. What is really relevant is that computed REL are compatible inside and across different types of inputs. In our situation, all evaluations (Walloon, MACE) use compatible REL computation methods. It is only at output level where we compute exacted REL by using diagonal elements of inverted LHS.
The Walloon genomic evaluation system is constantly undergoing optimizations and enhancements. First, the proportion of genotyped cows available is expected to increase in the next years through scientific projects and by genotyping cows at the request of breeders and producers whose interest could potentially be boosted by increased alternative uses of genotypes (e.g. Yin and König, Reference Yin and König2016). Second, genotyping of new key bulls will be optimized. For example, bulls with phenotypes through their daughters (e.g. maternal grandsires, brothers, half-brothers), related to selection candidates, will be genotyped, in order to increase the links between genotyped animals with phenotypes and the selection candidates. Therefore, an increase in REL, and of the proportion of publishable GEBV, is expected. As expected by definition, in general, average RELW were about the same within classes by trait. Similar increases from RELW to GRELW were observed for all traits. This can happen by chance as animals are not exactly the same between traits. Another reason is that the only additional information from RELW to GRELW is the quite similar genomic relationship matrix between animals, even if the animals are not 100% the same. On the other hand, increases in REL were observed from GRELW to GRELW+M−Wc. Here, additional information comes not only from genomic relationships, but also from MACE phenotypes (Misztal et al., Reference Misztal, Tsuruta, Aguilar, Legarra, VanRaden and Lawlor2012). Although VanRaden et al. (Reference VanRaden, Van Tassell, Wiggans, Sonstegard, Schnabel, Taylor and Schenkel2012) reported similar REL gains for traits such as milk, fat and protein yield, Wiggans et al. (Reference Wiggans, VanRaden and Cooper2011b) observed gains between 25.6 and 35.0 points for the same traits. Lower gains in REL for udder support compared with other traits may happen due to the lower heritability of this trait. Similar smaller gains in udder support were reported by VanRaden et al. (Reference VanRaden2009) and Schenkel et al. (Reference Schenkel, Sargolzaei, Kistemaker, Jansen, Sullivan, Van Doormaal, VanRaden and Wiggans2009), with values of 0.14 and 0.10, respectively.
Third, another important methodological element is the optimization of the weight α used in the combination of the raw genomic relationships and the pedigree relationships. As explained earlier this coefficient was recognized as describing the partition of variance (Christensen and Lund, Reference Christensen and Lund2010). Several tests with our data but also research done by others (e.g. Liu et al., Reference Liu, Goddard, Reinhardt and Reents2011) showed that the used weight has a large influence and that the optimal proportion between raw genomic and pedigree relationships is critical. Exploiting this, now better understood, partitioning of total genetic variance into variances explained by SNP effects and by the residual polygenic effect should allow better estimates of α. Fourth, as was shown by Gengler et al. (Reference Gengler, Nieuwhof, Konstantinov and Goddard2012) and Liu et al. (Reference Liu, Goddard, Hayes, Reinhardt and Reents2014, Reference Liu, Seefried, Reinhardt, Rensing, Thaller and Reents2016) future equivalent single-step genomic models could avoid completely the setting up of explicit genomic relationship matrices. This theory can be developed further to become a very attractive computing strategy inside our ssGBayes method. Fifth, the ssGBayes method used in the Walloon genomic evaluation system can also be set up as a multi-trait model allowing the genomic evaluation of only locally available traits (e.g. novel traits based on fine milk composition (Gengler et al., Reference Gengler, Soyeurt, Dehareng, Bastin, Colinet, Hammami, Vanrobays, Lainé, Vanderick, Grelet, Vanlierde, Froidmont and Dardenne2016), methane emissions (Vanlierde et al., Reference Vanlierde, Vanrobays, Dehareng, Froidmont, Soyeurt, McParland, Lewis, Deighton, Grandl, Kreuzer, Gredler, Dardenne and Gengler2015)) using external information from correlated traits (e.g. traits evaluated by Interbull). A multi-trait model would also allow avoiding harmonization of external information (e.g. expressed as indices or standardized estimates) and internal information (Vandenplas et al. Reference Vandenplas and Gengler2015). This is especially desirable in the context of dairy cattle evaluations in which EBV are often not on the original phenotypic scale (e.g. EBV defined as average 305 day milk yield over first three lactations when the original records are test-day yields). Our current implementation avoids this issue by using EBV based on the reported and Interbull trait definitions, but, thus, approximating only local phenotypic information. However, the ssGBayes methodology is very flexible and could be set up to use directly local phenotypic data (e.g. Vandenplas et al., Reference Vandenplas, Spehar, Potocnik, Gengler and Gorjanc2017).
The GEBV test can be considered as quality assurance assessment for national genomic evaluations. In this study, GEBV test results showed the importance of the combination of local and foreign information. The fact that all traits passed the test, by using MACE or not, but associated to strong increases in R 2 when adding MACE, demonstrated the importance of both sources of information, genomic relationships and MACE. Finally, high differences in R 2 to conventional evaluations, for most of the traits, validated our national genomic model for the studied traits. Based on all results, the computed GEBV by using ssGBayes method should, therefore, be considered accurate and using also correctly local and MACE results.
Conclusions
Results presented in this study showed that the ssGBayes method is a good choice for the Walloon genomic evaluation system and an interesting option for other countries and evaluations. It was validated through the GEBV Test. This system in its use for the Walloon Holstein population appropriately integrates MACE results into ssGBLUP and recovers indirectly large amounts of external phenotypic information. Generated GEBV were associated to satisfactory REL given the size of the population. The whole genomic evaluation system will allow breeders to improve their selection decisions. The computed REL are taking into account genetic distances from selection candidates to genotyped animals with phenotypes. Extensions to other breeds (i.e. Dual Purpose Belgian Blue) are under development. Finally, the Walloon genomic evaluation system and the ssGBayes method in general have a large potential for future developments and enhancements. The flexibility of ssGBayes based systems can be used to adapt it to many other situations and implementations both at a Walloon level but also in other countries (e.g. Vandenplas et al., Reference Vandenplas, Spehar, Potocnik, Gengler and Gorjanc2017) or even international settings.
Acknowledgements
The authors acknowledge the Ministry of Agriculture of the Walloon Region of Belgium (Service Public de Wallonie, DGO3) for its financial support. Research leading to the implementation of this system was supported through several grants, that is research projects D31-1233 and D31-1274. Jérémie Vandenplas, as former research fellow, and Nicolas Gengler, as an honorary senior research associate, acknowledge the former and ongoing support of the National Fund for Scientific Research (F.R.S.-FNRS, Brussels, Belgium) for their positions and through several grants. The help of S. Tsuruta (University of Georgia, Athens, USA) and I. Aguilar (Instituto Nacional de Investigación Agropecuaria, Las Brujas, Urugay) concerning the BLUPF90 family of programs made available to us by I. Misztal (University of Georgia, Athens, USA), on which the developed computing programs are based, is acknowledged. Additional computational resources have been provided by the Plateau de Calcul et Modélisation Informatique of the University of Liège Gembloux Agro-Bio Tech and the Consortium des Équipements de Calcul Intensif funded by the National Fund for Scientific Research (F.R.S.-FNRS, Brussels, Belgium) under grant no. 2.5020.11.