I. INTRODUCTION
Nanoindentation is an important tool to measure the mechanical properties of materials at submicron scale.Reference Pharr and Bolshakov1 Instrumented indenters are able to monitor the variation of load with the indentation depth during loading and unloading. The extracted force curve contains information about the mechanical properties of the indented material. The most frequent quantity that has been evaluated from the unloading section of the curve is the elastic modulus.Reference Pharr and Bolshakov1–Reference Troyon and Huang7 Elastic modulus evaluation is fundamentally based on the solution provided by SneddonReference Sneddon8, Reference Sneddon9 for an axisymmetric rigid punch indenting a linear elastic half space.Reference Pharr and Bolshakov1
Nanoindentation experiments generally involve elastic as well as plastic deformation of materials. It has been proven for most materials that the unloading portion of the force curve is elastic.Reference Oliver and Pharr2, Reference Oliver and Pharr3, Reference Bolshakov, Oliver, Pharr, Baker, Ross, Townsend, Volkert and Børgesen10 Such finding enabled the incorporation of the analytical closed-form solutions of contact mechanics to estimate the elastic modulus of indented materials. The analytical solutions of indentation problems are only derived for axisymmetric shapes and due to the wide use of Berkovich indenters, it was intuitive to approximate the three-sided pyramid tip into a cone and use the analytical solution to estimate the elastic modulus.
Oliver and PharrReference Oliver and Pharr2 proposed a power law function to describe the unloading section of the force curve in the form

where hr is the residual depth after unloading. a and m are fitting parameters. Interestingly, values regularly obtained for m are between 1.2 and 1.6. This is different from the analytical solution provided by SneddonReference Sneddon8, Reference Sneddon9 which results in m of 2 for conical tips.
To explain this discrepancy, Bolshakov et al.Reference Bolshakov, Oliver, Pharr, Baker, Ross, Townsend, Volkert and Børgesen10 utilized the idea of effective tip shape. By utilizing two-dimensional (2D) finite element analysis (FEA), they showed that a better representation for the problem of a conical tip unloaded from a plastic indent is a parabola of revolution elastically indenting a flat linear elastic material. The surface profile of the effective tip can be described by a monomial function of the form

In 1946, GalinReference Galin11 provided an explicit formula for axisymmetric indenter whose shape is given by Eq. (2). Borodich and KeerReference Borodich and Keer12 corrected a typing mistake in the equation of Galin and published it in the correct form. Separately, Martin and TroyonReference Martin and Troyon5 derived a closed-form solution for this particular indentation problem by employing Sneddon’s integrals and reached the same conclusion. The expression of the force depth relation reads
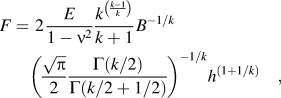
where E is the elastic modulus of the material and ν is its Poisson’s ratio. Γ is the gamma function. One major advantage of Eq. (3) is the direct connection between the power of the force curve m and the power of the effective tip profile k, where

Pharr and BolshakovReference Pharr and Bolshakov1 further developed the idea of the effective tip shape and attached the value of the force power m to the pressure distribution under the indenter tip. Assuming that the pressure at maximum indentation depth is relatively flat, a tip profile that generates such pressure is derived using principles of contact mechanics. It was found that the power law profile, Eq. (2), provides a good description of such tip shape.
Although the theory seems complete, inaccuracies are still present in the results obtained by nanoindentation. Fu et al.Reference Fu and Cao13 proved using elastic contact mechanics equations that there is no indenter corresponding to a uniform pressure distribution, so the profile proposed by Bolshakov et al.Reference Bolshakov, Oliver, Pharr, Baker, Ross, Townsend, Volkert and Børgesen10 is already an approximation. Furthermore, the idea of simplifying a pyramid tip into an axisymmetry shape has been criticallyReference Shim, Oliver, Pharr, Wahl, Huber, Mann, Bahr and Cheng14–Reference Gadelrab, Chiesa, Greer, Zhu, Clark, Gianola and Ngan16 studied and showed that the edges of the pyramid significantly affect the pressure distribution under the tip. Obtaining the tip area function that properly describes the shape of the tip is a major source of uncertainty.Reference Hermann, Hasche, Pohlenz and Seeman17, Reference Chudoba and Jennett18 This adds to the complications of verifying the theory experimentally. Atomic force microscope (AFM) can play a major role in investigating this problem. With accurate indenter tip metrology as well as sample remainder indents metrology, three-dimensional (3D) surfaces are generated, eliminating the uncertainties of the tip shape and contact area. FEA solves the other part of the challenge by running 3D analysis to estimate the pressure distribution under the tip without the need to simplify the tip into a two-dimensional (2D) equivalent.
In this work, we investigate the idea of effective tip shape and the accuracy of running an elastic analysis to simulate the unloading portion of the force curve. A Berkovich tip is used in the study and utilized to indent a fused silica sample. We are able to combine the AFM tip scans with FEA to simulate the loading–unloading force cycles on fused silica. This helps in locally determining the elastic modulus of the sample, after which an effective tip shape is generated from real indents. The effective tip is utilized to run an elastic indentation and obtain force curves that are compared to the experimental ones. The results show an overestimation of the modulus taking place in the case of applying the concept of effective tip shape. This behavior is explained by examining the pressure distribution extracted during the elastic indentation.
II. EXPERIMENTAL WORK
A Berkovich indenter is utilized to indent a fused silica sample on MFP Nanoindenter (Asylum Research). The tip is pushed toward the surface of the sample under load control to a maximum force of 1.2 mN. After the unloading path, five loading and unloading cycles are performed to the same maximum value of the force. This results in a maximum indentation depth of 82 nm. The material of the tip is industrial diamond with elastic modulus of 865 Gpa and Poisson’s ratio of 0.2. The experiments take place in an acoustic enclosure with a temperature control unit to minimize thermal drifting. The condition of zero thermal drift in the three axes is verified experimentally.
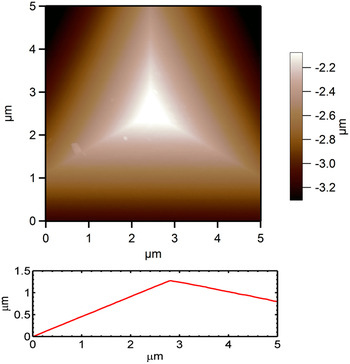
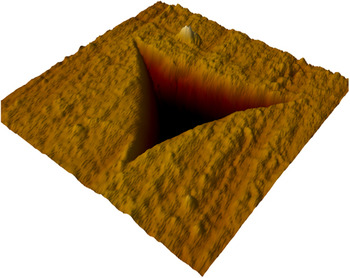
After indentation, MFP 3D AFM (Asylum Research) is used to scan both the tip and remaining indent. Figure 1 shows the AFM scans of the Berkovich tip. The scan sizes are chosen to be 5 × 5 μm2 with 512 × 512 scan resolution to be able to capture the details of the tip rounding near the tip apex. It was proved that at scan sizes less than 7 × 7 μm2, the effect of scan speed or resolution on the accuracy of the obtained image becomes minimal.Reference VanLandingham, Juliano and Hagon19 A very sharp AFM tip with tip radius of 5 nm is utilized to scan the indenter surface. By doing so, minimal dilation of the nanoindenter tip scan takes place and the AFM scans of the tips are reliable. Figure 2 shows a 1 × 1 μm2 AFM scan for the remaining indent. It is observed that the free surface is curving outwards due to the material elastic rebound after load removal.
Atomic force microscopic (AFM) scans of the Berkovich tip utilized in the experiment. A section is taken through an edge and a face to reveal the geometry of the tip.

An AFM scan of the remaining indent with 1 × 1 μm2 scan size. The free surface of the indent is curved due to the elastic rebound of the surface after load removal.

FE simulation
1. First loading–unloading cycle
Due to the complexity of the mechanics of the indentation process, a combination of AFM and FEA can help the investigation of the problem with minimal assumptions. The AFM scans of the nanoindenter tips are imported to a commercial FE code, ANSYS. This is accomplished by exporting the AFM scan of the tip into a FE code in ANSYS as explained in detail in Ref. Reference Gadelrab, Bonilla and Chiesa20. By having the scanned tip in ANSYS, the indentation process is simulated in both loading and unloading.
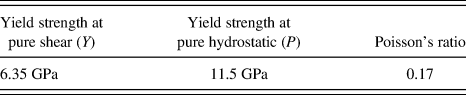
In a previous study,Reference Gadelrab, Bonilla and Chiesa20 we have demonstrated that the deformation of fused silica can be well described by a linear Drucker–Prager yielding criterion. This is due to the fact that fused silica is an amorphous material and it densifies during indentation. As Drucker–Prager model accounts for the hydrostatic component of stress during yielding, this model resulted in improved results in studying nanoindentation of fused silica.Reference Gadelrab, Bonilla and Chiesa20 Fortunately, it is proven that the unloading curve of nanoindentation experiments is elastic and the yield criterion utilized to describe the loading segment of the curve has almost no effect on the elastic unloading section.Reference Gadelrab, Bonilla and Chiesa21 Based on these observations, the analysis of the loading–unloading cycle can be performed with a perfect plasticity model without altering our analysis of the unloading curve. However, as the Drucker–Prager parameters of fused silica are known from Ref. Reference Gadelrab, Bonilla and Chiesa20, we opted to proceed with the Drucker–Prager yielding criterion to obtain the highest accuracy. Having the true tip shape in an FE simulation with a Drucker–Prager model provides accurate estimation of the elastic modulus of the indented material by just fitting the experimental unloading curve with the numerical one.
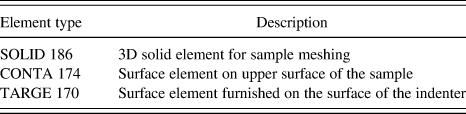
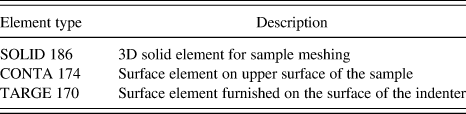
After importing the tip geometry into FE, a cylinder of size (D × h = 4 μm ×4.5 μm) is generated to simulate the test sample. The sample size is chosen to be large enough to avoid any interaction with boundaries or the free surfaces. The cylinder is meshed, and contact elements are furnished on the top surface of the cylinder and on the surface of the indenter. The indenter is modeled as a rigid surface. Element type and description are found in Table I. The FE results are checked against mesh dependency.
Description of the elements used in the finite element method of the indentation experiment.
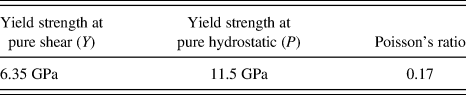
The material properties of fused silica that are utilized in the simulation are summarized in Table II.Reference Gadelrab, Bonilla and Chiesa20
Summary of fused silica material properties utilized to fit the experimental force curve.
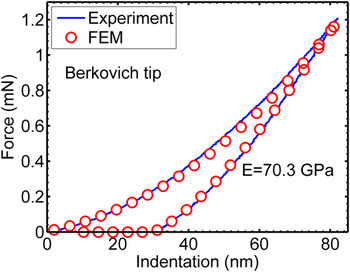
The loading and unloading experiment is performed numerically, and iteratively and the elastic modulus of the material is modified until agreement in the numerical and experimental unloading curves is achieved. Figure 3 shows the force curves using the Berkovich tip. There is very good agreement between the numerical and experimental values.
Experimental force curve of fused silica indented by a Berkovich tip. The numerical force curve from finite element method (FEM) agrees very well with the experimental one. The estimated modulus of the fused silica is 70.3 GPa.

2. Indentation of a preindented surface and the effective tip shape
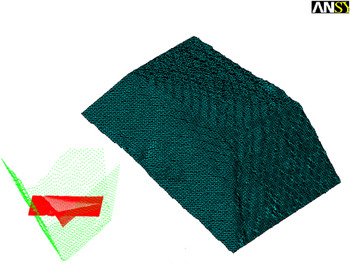
A similar approach to the one described in the previous section is utilized to study the unloading and subsequent reloading cycles of the force curve at the same position. The AFM scans of the tip and real indent in fused silica are used to generate the effective tip shape and attention is paid to follow the definition provided by Bolshakov et al.Reference Bolshakov, Oliver, Pharr, Baker, Ross, Townsend, Volkert and Børgesen10 After extracting the AFM scans in a matrix form, a MATLAB script modifies the x- and y-coordinates of the scans so that the apex of the indenter tip is aligned with the deepest point of the indent. The indenter is given different rotation angles until the indenter geometry matches the remaining indent. The step that follows calculates the difference in height between every two corresponding points in the two scans. This z-difference is utilized to generate the effective tip surface in ANSYS to simulate the indentation process. The generated surfaces of the effective tip shape for a Berkovich is demonstrated in Fig. 4.
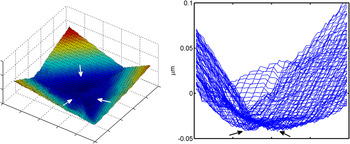
Effective tip shape for a Berkovich indenter. The shape is not smooth as was anticipated by two-dimensional equivalence as ridges can still be seen on the surface. The inset shows the geometry of the tip and the indent utilized to generate the effective surface.

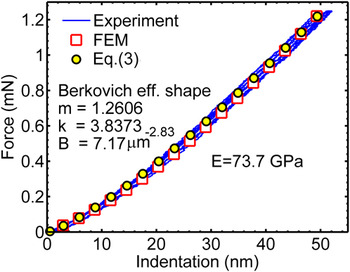
The same finite element method from the previous section is performed with the new effective tip shape. The major difference in numerical simulation is that the simulation is completely elastic with no yield criterion used. Different elastic modulii are utilized until the elastic force curve obtained from the numerical simulation matches the experimental force one. The experimental and numerical force curves for the effective tip of the Berkovich are shown in Fig. 5.
Elastic force curves from reindenting fused silica. The curve obtained from the FEM of the effective tip shape matches the experimental one with an elastic modulus of 73.7 GPa. This is higher than the value obtained from the loading cycle. Equation (3) also agrees with the experimental and numerical results with m = 1.2606.

III. RESULTS AND DISCUSSION
To examine the value of the elastic modulus obtained from the reloading curves, we fit at first the complete force curve to locally evaluate the elastic modulus of fused silica. The estimated elastic modulus from FEA using a Berkovich tip is 70.3 GPa. The value obtained is in close agreement to the nominal bulk value (72 GPa) and values published in the literature.Reference Oliver and Pharr2, Reference Troyon and Martin6, Reference Bolshakov, Oliver, Pharr, Baker, Ross, Townsend, Volkert and Børgesen10, Reference Chudoba and Jennett18, Reference Jennett, Meneve, Moody, Gerberich, Burnham and Baker22 The numerical unloading force curve agrees very well with the experimental one as seen in Fig. 3.
The elastic simulation of the repeated load–unload cycles at the same location using the effective tip shape results in an overestimation of the elastic modulus. The value of the estimated elastic modulus for the effective Berkovich tip is 73.7 GPa with an over estimation of about 5% from the value obtained during the first loading cycle.
It is interesting to note that the elastic force curves obtained from FEA of effective shape can be readily fit using the simple power law relation [Eq. (1)]. Due to the fact that multiple solutions can exist to Eq. (3) that generates a force curve to fit the elastic experimental reloading curves, the value of m is estimated first by fitting Eq. (1) to the experimental force curves. Consequently, the k value is calculated from Eq. (4) after which the B value is determined. The m value in the case of an effective Berkovich tip is 1.2606 resulting in a k of 3.8373. The value obtained for m is in very good agreement to the expected value of 1.25.Reference Pharr and Bolshakov1, Reference Oliver and Pharr2
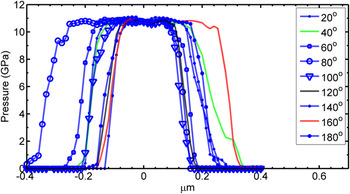
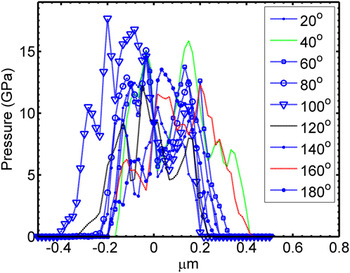
The idea of effective tip shape is fundamentally based on assuming a constant pressure under the tip during deformation.Reference Pharr and Bolshakov1 To check the validity of this assumption, the contact pressure under the tip during indentation is obtained. Figure 6 shows the contact pressure under the Berkovich tip. To cover the area of indentation, sections are plotted every 20° to extract the contact pressure. The pressure is constant along the contact area and drops rapidly at the boundaries. This is in agreement with the results in Refs. Reference Pharr and Bolshakov1 and Reference Chudoba and Jennett18.
Contact pressure distribution at peak load during the first loading cycle. Sections are taken every 20° degrees to cover the whole contact area. The pressure is clearly flat and drops rapidly close to the boundaries.

On the other hand, studying the pressure distribution under the contact effective shape reveals a completely different contact pressure map. Figure 7 shows the highly nonuniform contact pressure under the effective Berkovich tip. Higher pressure values are located near the boundaries.
Contact pressure at maximum load for the effective tip shape. The pressure is nonuniform and is highest close to the boundaries. Pressure reaches high values that will induce plasticity if yielding is included in FEM.

The reason behind the high pressure toward the boundaries of the contact area during elastic indentation can be understood by examining the effective tip shape. It is seen that the effective tip shape shows an outwards curvature of the surface. This behavior was discussed in detail in Refs. Reference Pharr and Bolshakov1 and Reference Bolshakov, Oliver, Pharr, Baker, Ross, Townsend, Volkert and Børgesen10. However, the 2D analysis that was utilized in these studies doesn’t reveal the complete shape of the indenter tip. In real pyramidal tips, the edges of the remaining indents, unlike the faces, become pinned and they do not elastically rebound back after unloading.Reference Oliver and Pharr3 As a result, the generated effective tip shape is not a smooth surface as is anticipated by the 2D analysis, ridges are clearly seen on the surface, see Fig. 8. Furthermore, the free surface of the effective tip is bowing outward, and it meets the sample flat surface first during FE simulation, resulting in higher pressure at the boundaries.
Effective tip shape of the indenter. The arrows show the outward curvature of the surface and the ridge in between. This results in a nonuniform pressure distribution during loading.

In addition to the nonuniform distribution of pressure under the effective tip shape, the contact pressure reaches significantly higher values in comparison to the values obtained during first loading. This can be explained by the high values of elastic modulus utilized to fit the elastic force curves. Consequently, traces of yielding will be observed if plasticity is included in the reloading FE simulation, which are not observed experimentally.
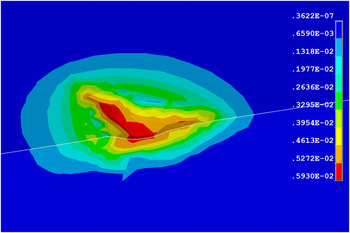
Previous studiesReference Oliver and Pharr2, Reference Shuman, Costa and Andrade23 and the current study show that the reloading curves of fused silica are elastic. On the other hand, to match the reloading curves results in an overestimation of the elastic modulus, and the pressure distribution is quite higher than the one extracted from FEA of first loading cycle, pointing out that plasticity will occur. This contradiction, can be resolved if we take into consideration the status of the deformed material under the indenter tip as shown in Fig. 9. While the effective tip shape describes the geometry of the problem well, the assumption of a homogeneous elastic material utilized in the FE simulation is weak. In reality when the tip indents a preindented surface, the elastic response recorded by the machine is generated from two sources: the deformed region in the vicinity of the tip and fresh matrix of the material surrounding the deformed region. The load is transferred from the tip through the deformed region into the material. Accordingly, in elastic simulations, the deformed region is neglected and the whole sample is assumed homogeneous and elastic. To properly simulate the reindentations process with the effective tip shape, the stresses inside the material has to be mapped to the flat sample before performing the elastic analysis. In other words, the elastic material model implemented in FEA is an oversimplification that can lead to such discrepancy. It is also worth mentioning that in the work of Pharr and Bolshakov,Reference Pharr and Bolshakov1 the generated effective surface generally described the overall elastic force curves; however, clear deviations were observed when it was experimentally compared to different materials.
Von Mises stress distribution in the remaining indent after sample unloading (Stress in units N/μm2). The deformed region affects the pressure transfer from the tip to the sample.

IV. CONCLUSION
AFM and FEA can be successfully linked to study and properly analyze the complex mechanics involved in the indentation process. We showed that the effective tip surface is not smooth as was anticipated by 2D analysis. Traces of the edges of the tips utilized in the indentation can still be observed on the surface. Although the pressure distribution at the peak load is flat, a very nonuniform distribution of the pressure is obtained from the elastic analysis. This is mainly caused by nonsmooth shape of the effective tip.
The effective tip shapes were utilized to generate numerical force curves that fit the experimental ones. The estimated elastic modulus of the sample was overestimated. This also resulted in higher elastic contact pressure which indicates traces of yielding if plasticity was involved in the analysis.
It is thought that the idea of the effective tip shape properly describes the reindentation problem from a geometric point of view. However, assuming that the material is a linear elastic half space is a simplification. The stresses of the deformed region have to be mapped on the flat surface before running the elastic analysis.